Monthly Archives: May 2011

Banks stockpile homes buyers don't need to buy

Banks attempts to manage MLS inventory have resulted in an enormous REO inventory and an even larger shadow inventory of future REO. Banks will need to sell, but buyers won't have to buy.

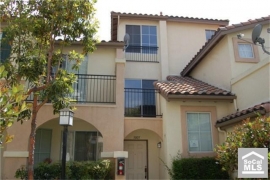
Irvine Home Address … 1902 CRESCENT OAK Irvine, CA 92618

Resale Home Price …… $264,900

So let’s try one last time

So we never forget

This is still worth fighting

Still worth fighting for

It’s gone on

For too long

And this is it

My Darkest Days — Still Worth Fighting For

Affordable housing is no longer part of the American Dream. Lenders have usurped the American Dream by forcing everyone to take on huge debts to get an education, a car, and a house.

How many among us were debt-free at 25, 30, 35 or 40? Lenders assail teenagers with credit card offers knowing their parents will pick up the tab. They burden students with college loans that will take an entire career to pay off. By the time most graduate, they are so burdened with debt that they cannot save money to buy a car or a house, so they take on even more debt just to get by.

Now that lenders have inflated a massive housing bubble with even more debt, they pushed millions of people into insolvency where their only hope is strategic default on their mortgages and bankruptcy. As a result, they now have an abundance of homes they can't sell because the over-indebted population cannot afford them. Yet they hold onto these homes at inflated prices to force the next generation of buyers to play along.

As Marie Antoinette would say, “Let them eat house.”

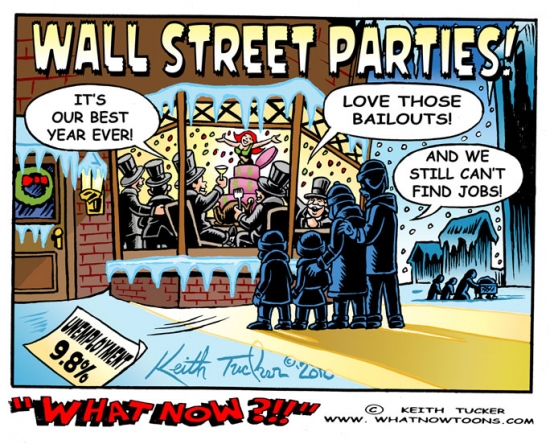
Banks Amass Glut of Homes, Chilling Sales

By ERIC DASH — Published: May 22, 2011

EL MIRAGE, Ariz. — The nation’s biggest banks and mortgage lenders have steadily amassed real estate empires, acquiring a glut of foreclosed homes that threatens to deepen the housing slump and create a further drag on the economic recovery.

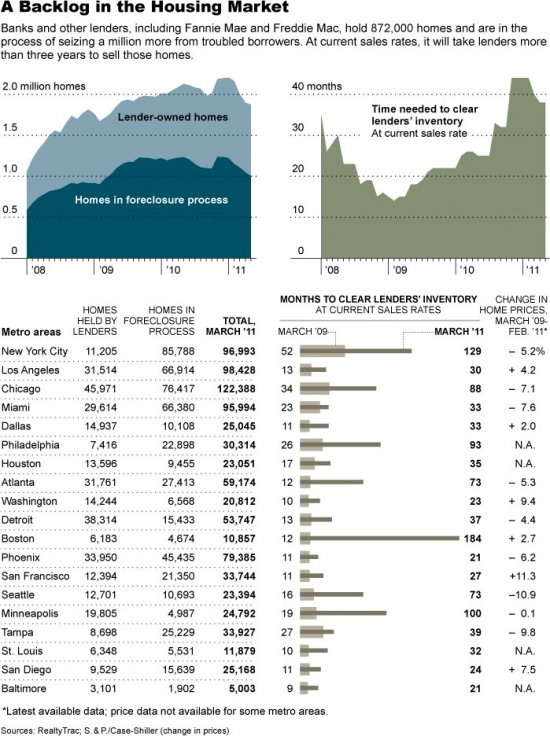
All told, they own more than 872,000 homes as a result of the groundswell in foreclosures, almost twice as many as when the financial crisis began in 2007, according to RealtyTrac, a real estate data provider. In addition, they are in the process of foreclosing on an additional one million homes and are poised to take possession of several million more in the years ahead.

Calculated Risk has added some clarification to the RealtyTrac numbers in a recent post:

I pointed out that the RealtyTrac estimate of 872,000 REO (lender Real Estate Owned) was probably too high, and I also noted that there are approximately 2.25 million homes currently in the foreclosure process. There are another 1.8 million homes with the borrower more than 90 days delinquent – so there is more to come. …

First, the F's (Fannie, Freddie and the FHA) will probably foreclose on close to 500 thousand homes this year since they are picking up the pace. So they will also sell 500+ thousand homes this year – they sold 110,000 in Q1 alone.

But notice that modifications and short sales are twice the number of foreclosures. So if the F's foreclose and sell 500 thousand homes, they might modify/short sell another 1,000,000 (this is mostly modifications, and of course short sales are distressed sales too, but they usually sell for more than REO).

If we add in the PLS and banks and thrifts, the lenders will probably make significant progress on delinquencies this year (and again in 2012). Of course some of the modifications will redefault and end up as REO too, but I just wanted to make sure everyone knows that all of these properties won't end up as REO.

They don't all have to end up as REO to either pummel prices or hold prevent appreciation for several years. There is a very simple dynamic of sales in play: banks need to sell and buyers don't need to buy.

The reason markets capitulate is because sellers give up waiting for the prices they want and liquidate for whatever they can get. Real estate owned inflicts carrying costs and maintenance expenses on banks of about 1.5% each month without providing any income. The more REO a bank has, the more it costs them each month. A lender holding out for top dollar may go broke before the market recovers, assuming they aren't too big to fail.

Since each lender has a different financial strength and different beliefs about the future of pricing, some lenders will sell now even though prices are low and their losses will be large. Each bank that liquidates keeps prices down while they sell and makes the other banks wait longer if they want to get their wishing prices.

Eventually, years go by with banks bleeding cash with no end in sight, and lenders get motivated to liquidate and get what capital they can. When lenders become motivated to liquidate, that is capitulation. It's the same dynamic for individuals who hold cashflow negative properties that are underwater. At some point, most figure out it is pointless to throw bad money after bad, so they cut their losses through strategic default. Lenders don't strategically default, they merely sell REO for whatever they can get, lobby for a bailout, and move on.

Back to the NY Times Article:

Five years after the housing market started teetering, economists now worry that the rise in lender-owned homes could create another vicious circle, in which the growing inventory of distressed property further depresses home values and leads to even more distressed sales. With the spring home-selling season under way, real estate prices have been declining across the country in recent months.

“It remains a heavy weight on the banking system,” said Mark Zandi, the chief economist of Moody’s Analytics. “Housing prices are falling, and they are going to fall some more.”

The double dip was the last gasp of denial market bulls had left. With house prices tunneling to new lows five years after the market peaked, many who held out hope that 2011 and 2012 might help them with their capital recovery are now facing the reality that it will take a very long time to get back to the peak. With carrying costs of 1.5% per month, capitulation becomes a more viable option than waiting with hopes of recovery later, particularly with the GSEs liquidating their inventory.

Over all, economists project that it would take about three years for lenders to sell their backlog of foreclosed homes. As a result, home values nationally could fall 5 percent by the end of 2011, according to Moody’s, and rise only modestly over the following year. Regions that were hardest hit by the housing collapse and recession could take even longer to recover — dealing yet another blow to a still-struggling economy.

Although sales have picked up a bit in the last few weeks, banks and other lenders remain overwhelmed by the wave of foreclosures. In Atlanta, lenders are repossessing eight homes for each distressed home they sell, according to March data from RealtyTrac. In Minneapolis, they are bringing in at least six foreclosed homes for each they sell, and in once-hot markets like Chicago and Miami, the ratio still hovers close to two to one.

Before the housing implosion, the inflow and outflow figures were typically one-to-one.

There is not light at the end of the tunnel. As long as they are taking on many more houses than they liquidate, they fall further behind.

The reasons for the backlog include inadequate staffs and delays imposed by the lenders because of investigations into foreclosure practices. The pileup could lead to $40 billion in additional losses for banks and other lenders as they sell houses at steep discounts over the next two years, according to Trepp, a real estate research firm.

The reasons for the backlog all can be reduced to the desire of lenders to keep prices up. The numerous delays were not holding back banks eager to process foreclosures. Each delay had a cover story such as robo-signer, but the reality is that lenders simply don't want to flood the MLS with properties and recreate Las Vegas in every housing market in the country.

“These shops are under siege; it’s just a tsunami of stuff coming in,” said Taj Bindra, who oversaw Washington Mutual’s servicing unit from 2004 to 2006 and now advises financial institutions on risk management. “Lenders have a strong incentive to clear out inventory in a controlled and timely manner, but if you had problems on the front end of the foreclosure process, it should be no surprise you are having problems on the back end.”

If I were an asset manager from Washington Mutual during the bubble, I would be hiding my head in shame rather than using that as a credibility booster in a news article. His comments are accurate though.

A drive through the sprawling subdivisions outside Phoenix shows the ravages of the real estate collapse. Here in this working-class neighborhood of El Mirage, northwest of Phoenix, rows of small stucco homes sprouted up during the boom. Now block after block is pockmarked by properties with overgrown shrubs, weeds and foreclosure notices tacked to the doors. About 116 lender-owned homes are on the market or under contract in El Mirage, according to local real estate listings.

But that’s just a small fraction of what is to come. An additional 491 houses are either sitting in the lenders’ inventory or are in the foreclosure process. On average, homes in El Mirage sell for $65,300, down 75 percent from the height of the boom in July 2006, according to the Cromford Report, a Phoenix-area real estate data provider. Real estate agents and market analysts say those ultra-cheap prices have recently started attracting first-time buyers as well as investors looking for several properties at once.

There is a price point where anything will sell. If prices are low enough to attract cashflow investors, they will buy even in a declining market because the cashflow is so rewarding. Prices won't fall to zero, and the activity of cashflow investors is usually the buying interest that causes markets to bottom.

Lenders have also been more willing to let distressed borrowers sidestep foreclosure by selling homes for a loss. That has accelerated the pace of sales in the area and even caused prices to slowly rise in the last two months, but realty agents worry about all the distressed homes that are coming down the pike.

“My biggest fear right now is that the supply has been artificially restricted,” said Jayson Meyerovitz, a local broker. “They can’t just sit there forever. If so many houses hit the market, what is going to happen then?”

Prices will go down. What else could happen? Low prices aren't a bad thing, particularly for today's buyers. realtors seem to forget that for each unhappy seller, there is often a very happy buyer.

Back when lenders began restricting inventory realtors cheered the move. Now that buyers know this inventory is out there and buyer motivation is at a low because of it, realtors are suddenly concerned about the problem. Perhaps realtors believed they could overcome the inventory problem with brute force of bullshit. Unfortunately for them, buyers aren't that stupid.

The major lenders say they are not deliberately holding back any foreclosed homes.

What? I would like to read a quote from someone at a major bank who actually stated that transparent lie. I have profiled many properties on this blog that were bought by the bank a year earlier and finally made their way onto the MLS.

They say that a long sales process can stigmatize a property and ratchet up maintenance and other costs. But they also do not want to unload properties in a fire sale.

“If we are out there undercutting prices, we are contributing to the downward spiral in market values,” said Eric Will, who oversees distressed home sales for Freddie Mac. “We want to make sure we are helping stabilize communities.”

Stabilize communities? Give me a break. They want to maximize recovery at the expense of today's buyers. If they could get everyone to sign on for massive loans with 50% DTIs, they would do it in a moment if it got them out of their mess.

If they really wanted to stabilize communities, they would firesale their homes, and give Americans affordable housing. Imagine a society where we weren't putting 30% or more of our income toward debt service on housing. Wouldn't that free up a great deal of money for stimulating the economy? Of course it would.

The biggest reason for the backlog is that it takes longer to sell foreclosed homes, currently an average of 176 days — and that’s after the 400 days it takes for lenders to foreclose.

Why does it take so long to sell REO? Any property can be sold in 90 days if they just reduce the price.

After drawing government scrutiny over improper foreclosures practices last fall, many big lenders have slowed their operations in order to check the paperwork, and in two dozen or so states they halted them for months.

Conscious of their image, many lenders have recently started telling real estate agents to be more lenient to renters who happen to live in a foreclosed home and give them extra time to move out before changing the locks.

“Wells Fargo has sent me back knocking on doors two or three times, offering to give renters money if they cooperate with us,” said Claude A. Worrell, a longtime real estate agent from Minneapolis who specializes in selling bank-owned property. “It’s a lot different than it used to be.

Lenient with renters? I feel better knowing the banks have decided to treat the renting subclass with a fraction of the respect they give the deadbeats who squat in their properties for years without making any payments. If banks are conscious of their images, they have completely failed to capture the hearts and minds of the people.

Every loan owner who gets the boot will hate the bank for life, and any renter who gets evicted by a bank because the landlord was a deadbeat will similarly hate the bank for life. Further, everyone who realizes the banks are stealing their money through government bailouts will also hate the banks for life. So who exactly thinks positively of banks these days?

Realty agents and buyers say the lenders are simply overwhelmed. Just as lenders were ill-prepared to handle the flood of foreclosures, they do not have the staff and infrastructure to manage and sell this much property.

Most of the major lenders outsourced almost every part of the process, be it sales or repairs. Some agents complain that lender-owned home listings are routinely out of date, that properties are overpriced by as much as 10 percent, and that lenders take days or longer to accept an offer.

It shouldn't be too surprising that REO departments are understaffed and inefficient. Who at the bank is going to get kudos for spending a lot of money to accelerate their loss recognition? Of course, lenders would be better off if they quickly resolved their REO and get what's left of their capital back. But they won't see it that way.

The silver lining for home lenders, however, is that the number of new foreclosures and recent borrowers falling behind on their payments by three months or longer is shrinking.

“If they are able to manage through the next 12 to 18 months,” said Mr. Zandi, the Moody’s Analytics economist, “they will be in really good shape.”

In really good shape? Wishful thinking.

The liquidation phase of the Great Housing Bubble will persist for years. Even if banks begin liquidation in earnest and accept whatever happens to house prices, it will still take three to five years before the REO is gone. Since the banks seem determined not to capitulate, it will likely take another decade before the liquidation is complete. Buyers can sit on the sidelines longer than lenders can remain solvent.

Bought at the peak with 100% financing

The bank unknowingly bought this property at the peak for full asking price. They provided a borrower all the money to obtain this property and thereby took on all the risk in the event of a price decline. With an asking price that represents a 42% loss after commissions, this REO is going to cost the lender plenty.

Irvine House Address … 1902 CRESCENT OAK Irvine, CA 92618

Resale House Price …… $264,900

House Purchase Price … $435,000

House Purchase Date …. 5/11/2006

Net Gain (Loss) ………. ($185,994)

Percent Change ………. -42.8%

Annual Appreciation … -9.3%

Cost of House Ownership

————————————————-

$264,900 ………. Asking Price

$9,272 ………. 3.5% Down FHA Financing

4.56% …………… Mortgage Interest Rate

$255,628 ………. 30-Year Mortgage

$55,901 ………. Income Requirement

$1,304 ………. Monthly Mortgage Payment

$230 ………. Property Tax (@1.04%)

$100 ………. Special Taxes and Levies (Mello Roos)

$55 ………. Homeowners Insurance (@ 0.25%)

$294 ………. Private Mortgage Insurance

$239 ………. Homeowners Association Fees

============================================

$2,222 ………. Monthly Cash Outlays

-$120 ………. Tax Savings (% of Interest and Property Tax)

-$333 ………. Equity Hidden in Payment (Amortization)

$16 ………. Lost Income to Down Payment (net of taxes)

$53 ………. Maintenance and Replacement Reserves

============================================

$1,838 ………. Monthly Cost of Ownership

Cash Acquisition Demands

——————————————————————————

$2,649 ………. Furnishing and Move In @1%

$2,649 ………. Closing Costs @1%

$2,556 ………… Interest Points @1% of Loan

$9,272 ………. Down Payment

============================================

$17,126 ………. Total Cash Costs

$28,100 ………… Emergency Cash Reserves

============================================

$45,226 ………. Total Savings Needed

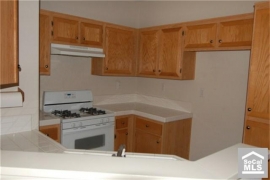
Property Details for 1902 CRESCENT OAK Irvine, CA 92618

——————————————————————————

Beds: 1

Baths: 2

Sq. Ft.: 900

$294/SF

Property Type: Residential, Condominium

Style: 3+ Levels, Contemporary

Year Built: 1999

Community: 0

County: Orange

MLS#: P781874

Source: SoCalMLS

Status: Active

——————————————————————————

Nice Irvine Townhouse located in Oak Park community. Great location near the swimming pool. 1 Bedroom, 1.5 Bath, plus attached 2 car tandem garage. Master suite has walk in closet and vaulted ceilings. Oak Park is a gated community with 2 swimming pools, clubhouse and spa. Close to shopping center and restaurants.

More self-serving bullshit from the National Association of realtors

The NAr released its spin concerning the very poor sales numbers in April. As expected, their words are mostly self-serving bullshit.

Irvine Home Address … 1 GOLDFINCH Irvine, CA 92603

Resale Home Price …… $2,988,500

Stop right there. That's exactly where I lost it.

See that line. Well I never should have crossed it.

Stop right there. Well I never should have said

That it's the very moment that

I wish that I could take back.

I'm sorry for the person I became.

I'm sorry that it took so long for me to change.

I'm ready to be sure I never become that way again

'cause who I am hates who I've been.

Who I am hates who I've been.

Relient K — Who I Am Hates Who I've Been

One of the most life-changing spiritual lessons I have learned (and continue to relearn) is to constantly raise my standards. For example, when I look back on the quality of my daily posts on the IHB, I have consistently raised my standards for accuracy, completeness, and consistency. I work diligently to improve the reader experience by simultaneously educating and entertaining.

I have done many things in my past that I am not proud of. I don't spend much energy beating myself up or feeling self loathing. Instead I raise my standards and change my ways. I am in no position to judge anyone. On this blog, I try to point out the foolishness of people's actions, not to single myself out as being any better (I am not), but to enlighten readers to the errors in thinking bubble era people made so we can all learn from these mistakes and avoid them in our own lives.

The housing bubble was about human frailty not the operations of some unaccountable system. Changing the system is only part of the solution. If people fail to recognize the poor reasoning, faulty assumptions, and incorrect understandings that drove them to their own demise, they will repeat those mistakes and so will others who follow their lead.

The National Association of realtors has gone down the wrong path. They are lost in a mire of their own bullshit, and the only way out is a radical change. I will not be that agent of change as I won't soil myself to join their organization, but at some point, an internal movement may arise where some members say enough is enough and demand the organization stop their dishonorable practices. Who they become may hate who they were.

NAr disrespects its customers

Since Barry Ritholtz post on How to Read National Association of Realtors News Release, I have been contemplating the utter disrespect the NAr demonstrates for its customers through its constant manipulation of data for the sole purpose of convincing buyers to act even if it isn't in the buyers best interest to do so. It angers me that such a corrupt and self-serving philosophy of business is at the core of the NAr because their actions harm so many people.

The NAr doesn't care about its customers. They have no interest in sharing the truth or providing accurate information if such information may cause a buyer not to buy or a seller not to sell. A reasonable deduction from NAr press releases is that they will say anything to generate sales, specifically they want to control buyer psychology.

Spin and bullshit have a purpose. Many people considering buying a home are unsure if the decision is wise, and they look to figures of authority to validate their desires to buy and placate their worries. Unfortunately, realtors are considered experts, so their words carry influence. realtors use this implied authority to their advantage. Therefore, every word that is not data in a NAr press release is designed to positively impact buyer psychology.

Perhaps in an era of steadily rising house prices tethered to incomes, there is little harm in pushing a few wavering buyers into what is often a good purchase. At least that's how realtors comfort themselves. But once realtor induced kool aid intoxication took over, our housing markets became more volatile, and when there is volatility, the market undergoes periods of falling prices when it really isn't a good time to buy.

No part of the realtor business philosophy covers those periods when it isn't a good time to buy. Their spin and bullshit were relatively harmless when fewer people believed it, but in today's volatile housing market, being told when someone shouldn't buy and why is important information — information the NAr is not willing to share even if they were smart enough to figure it out.

Why else would Lawrence Yun have spent the last several years convincing people they should buy homes? He is either incompetent or knowingly complicit in a lie. I assume he is paid well enough to sell his soul.

The specifics of data, spin and bullshit

As a reminder:

Data: Factual statements that present statistics or some measurable phenomenon. Presenting data is ostensibly the reason for a real estate press release. However, the real intention is to spin the data or otherwise manipulate the interpretation.

Spin: The offered interpretation of data that forwards the agenda of the organization issuing the press release. Spin is usually a plausible interpretation that is most often taken out of context, knowingly, by the authors.

Bullshit: An interpretation of data that is either not factual, or the data itself is not factual, or an interpretation that is not plausible based on the data. Bullshit is an obvious lie an organization passes off to a gullible public in hopes that nobody catches on.

With that, let's see what the esteemed National Association of realtors had to say about the dismal market conditions in April.

April Existing-Home Sales Ease

Washington, DC, May 19, 2011

They can't even write a headline without injecting bullshit into it. Notice the word “ease.” Doesn't it sound positive? We were recently told quantitative easing was a good thing (another lie). The Eagles invite us to “Take it Easy.” Professional athletes talk about “easing” into the flow of competition. But what does it mean for sales to ease?

It means sales went down!

Is is reasonable to assume the NAr chose that word to manipulate buyer psychology? Why didn't they say “April Existing-home sales declined?” That is what in fact happened.

Existing-home sales slipped in April, although the market has managed six gains in the past nine months, according to the National Association of Realtors®.

Slipped? Did the market step on a banana peel? And if the market gained in six of the past nine months that means sales declined in three of the last nine.

Existing-home sales, which are completed transactions that include single-family, townhomes, condominiums and co-ops, eased 0.8 percent to a seasonally adjusted annual rate of 5.05 million in April from a downwardly revised 5.09 million in March, and are 12.9 percent below a 5.80 million pace in April 2010; sales surged in April and May of 2010 in response to the home buyer tax credit.

Easing and surging? Lawrence Yun should be writing porn. Perhaps next months sales will be throbbing or pulsing? In all likelihood, sales will be limp as the market remains flaccid.

What are the key facts above?

  • Existing home sales went down between March and April. That is very unusual and should be a cause for alarm.
  • March figures were revised downward because they have set up their reporting to exaggerate current months sales and quietly revise them lower later — another example of their duplicity.
  • The homebuyer tax credit pulled demand forward, and both sales and prices have been hurting ever since.

Lawrence Yun, NAR chief economist, said the market is underperforming. “Given the great affordability conditions, job creation and pent-up demand, home sales should be stronger,” he said. “Although existing-home sales are expected to trend up unevenly through next year, unnecessarily tight credit is continuing to restrain the market, along with a steady level of low appraisals that result in contract cancellations.

The market is underperforming, but the reasons Yun gave are a combination of spin and bullshit. In most markets (not ours) affordability is good, but unemployment is still a huge problem, and pent up demand is nonsense the NAr comes up with when they have nothing else. Desire is not demand.

What does it mean for a market to “trend up unevenly?” Most housing analysts expect the housing market to decline rather uniformly. Nobody outside of the NAr believes we will see any kind of uptrend even or otherwise. This is obviously spin bordering on bullshit.

I recently asked Are home sales slumping because lenders refuse to lend? Apparently, the tight credit meme is circulating in realtor circles. This is likely a precursor to a lobbying push in Washington to get the FHA and the GSEs to take on more risk by lowering their standards — something which would be disastrous for taxpayers but great for NAr commissions in the short term.

A parallel NAR practitioner survey shows 11 percent of realtors® report a contract was cancelled in April from an appraisal coming in below the price negotiated between a buyer and seller, 10 percent had a contract delayed, and 14 percent said a contract was renegotiated to a lower sales price as a result of a low appraisal.

I have run into this problem myself. I recently had a deal in Las Vegas where I obtained a full asking price offer from an FHA buyer for $95,900. Since it is a flip, it required two appraisals. The first came in at $96,000, but the second came in at $91,000. The buyer barely had the down payment, so I had to chose between killing the deal to wiping out two-thirds of the profit. In a declining market, I took the deal and decided to move on.

More conservative appraisals are better for the overall health of the housing market. I don't particularly like paying the price, but conservative appraisals are part of the solution. Every bubble era loan had some appraiser agree with an inflated value. Prices in Las Vegas went up 40% in 2004 alone. That didn't happen because appraisers were doing the right thing.

According to Freddie Mac, the national average commitment rate for a 30-year, conventional, fixed-rate mortgage was 4.84 percent in April, unchanged from March; the rate was 5.10 percent in April 2010.

Although sales are clearly up from the cyclical lows of last summer, home sales are being held back 15 to 20 percent due to the very restrictive loan underwriting standards,” Yun said.

Sales are not up. Earlier in the press release the data said April 2010 had 5.8M sales and April 2011 had 5.05M. Further, summer is not a time when we have cyclical lows. That is pure bullshit that doesn't even pretend to mirror any kind of reality. He finishes with repetition of his earlier spin about restrictive loan standards.

All-cash transactions stood at 31 percent in April, down from a record level of 35 percent in March; they were 26 percent in March 2010; investors account for the bulk of cash purchases.

NAR President Ron Phipps, broker-president of Phipps Realty in Warwick, R.I., said the lending community needs to return to sensible standards. “We want to ensure that qualified buyers will be able to own their property on a sustained basis from a sound credit evaluation, but banks needn’t be so stingy as to only lend to those with the highest credit scores,” he said.

What does a realtor know about underwriting? Isn't restricting credit to those who will pay it back a reasonable reaction to loaning money to so many people who didn't? What he is advocating is a return to subprime lending. It's a low-risk position for him since it isn't his money being loaned to a subprime deadbeat.

Very high shares of cash purchases, and high credit score requirements, have led to historically low default rates among home buyers over the past two years. This trend implies a gulf is opening between those who can and cannot have access to the American dream of home ownership,” Phipps said. “At the same time, existing guidelines from Freddie Mac and Fannie Mae must be fully implemented so all appraisals are done by valuators with local expertise.

Default rates over the last two years have not been historically low. By pre-bubble standards, default and delinquency rates are still elevated mostly due to declining prices and ongoing unemployment problems. His reference to implementing existing guidelines is a subtle push for higher appraisals.

Notice the emotional appeal to the American Dream. What he advocates didn't work out well last time.

The national median existing-home price for all housing types was $163,700 in April, which is 5.0 percent below April 2010. Distressed homes – typically sold at a discount of about 20 percent – accounted for 37 percent of sales in April, down from 40 percent in March; they were 33 percent in April 2010.

Home values, despite month-to-month volatility, have been remarkably stable in the range of $160,000 to $170,000 for the past three years,” Yun said. “Stable home prices in turn will steadily lower loan default rates, including strategic defaults.

There has been very little month-to-month volatility. Prices rebounded steadily from March 2009 to May 2010 when the government subsidies ran out, and they have been falling steadily ever since.

There is no reason to believe stable home prices will steadily lower default rates. Stable prices probably will prevent additional strategic defaults, but only good jobs and reasonable payments will steadily lower default rates.

Total housing inventory at the end of April increased 9.9 percent to 3.87 million existing homes available for sale, which represents a 9.2-month supply at the current sales pace, up from an 8.3-month supply in March.

I am surprised they didn't inject some spin to take the sting out of that ugly statistic. How is the housing market supposed to recover with a 9.2 month supply of homes on the market?

First-time buyers purchased 36 percent of homes in April, up from 33 percent in March; they were 49 percent in April 2010 when the tax credit was in place. Investors slipped to 20 percent in April from 22 percent of purchase activity in March; they were 15 percent in April 2010. The balance of sales was to repeat buyers, which were 44 percent in April.

As i reported last week in Shadow inventory can not be absorbed by first-time buyers, the homebuyer's tax credit of $8,000 merely pulled forward demand from 2011 into 2010.

Phipps added that proposals and regulations are being considered in Washington that could further constrain the housing market. “One of the most damaging proposals would effectively raise downpayment requirements to 20 percent, which would slam the brakes on the housing market,” he said. “What we need to do is simply return to the sound standards that were in place before the introduction of risky mortgage products.”

Twenty percent down payments would not damage the housing market. Calling the proposal damaging is spin, and claiming it would put the brakes on the housing market is bullshit. If implemented, a 20% down requirement will lower prices and make markets much more stable. Those are good things.

I found it amusing that he concluded with stating that we should return to pre-bubble lending practices. Well, that is 20% down and 30-year fixed-rate mortgages, something he claimed was bad one sentence earlier.

“Our data shows only one out of five first-time buyers needing a mortgage could afford a 20 percent downpayment, and without first-time buyers the trade-up market would stall with very negative consequences for housing and the overall economy,” Phipps said.

It wouldn't surprise me that very few first-time buyers have 20% to put down. When 100% financing became available during the bubble, people stopped saving money for down payments because it was unnecessary. Couple that with a severe recession from the collapse of the housing bubble, and very few buyers have the savings necessary to complete such a large purchase.

Ironically, low downpayment FHA and VA loans, which are so critical to this segment, have performed well and never needed a taxpayer bailout because those borrowers stayed well within their budgets.” NAr consumer survey data shows 56 percent of entry level buyers in the past year financed with an FHA loan.

The reason FHA and VA loans from the bubble era performed better is because there were so few of them. With subprime lenders giving out copious amounts of free money with little or no documentation, FHA market share dropped from its historic 8% to 10% average to about 2% of the market. Fortunately, FHA and VA did not lower their underwriting standards to compete during the bubble. Unfortunately, they have become the replacement for subprime in the deflation of the bubble, and the losses from strategic default are starting to add up.

We may yet have to bail out the FHA. Insurance premiums have more than doubled on FHA loans in the last 18 months, and it still may be too little too late to prevent a bailout.

Single-family home sales slipped 0.5 percent to a seasonally adjusted annual rate of 4.42 million in April from 4.44 million in March, and are 12.6 percent below the 5.06 million pace in April 2010. The median existing single-family home price was $163,200 in April, which is 5.4 percent below a year ago.

The spin highlighted in the previous sentence is a fact, but its placement near the end of the press release was done to purposefully lessen its impact. Let me help them, SALES AND PRICES ARE DOWN!!!

Existing condominium and co-op sales fell 3.1 percent to a seasonally adjusted annual rate of 630,000 in April from 650,000 in March, and are 15.0 percent below the 741,000-unit level one year ago. The median existing condo price5 was $167,300 in April, down 2.3 percent from April 2010.

Regionally, existing-home sales in the Northeast fell 7.5 percent to an annual pace of 740,000 in April and are 32.1 percent below a year-ago surge. The median price in the Northeast was $225,400, which is 7.3 percent below April 2010.

Existing-home sales in the Midwest rose 5.7 percent in April to a level of 1.12 million but are 16.4 percent below a cyclical peak in April 2010. The median price in the Midwest was $133,200, down 5.1 percent from a year ago.

In the South, existing-home sales declined 1.0 percent to an annual pace of 1.95 million in April and are 9.3 percent below a year ago. The median price in the South was $142,800, which is 4.1 percent lower than April 2010.

Existing-home sales in the West slipped 1.6 percent to an annual level of 1.24 million in April and are 0.8 percent below April 2010. The median price in the West was $203,400, down 6.1 percent from a year ago.

The National Association of realtors®, “The Voice for Real Estate,” is America’s largest trade association, representing 1.1 million members involved in all aspects of the residential and commercial real estate industries.

Is the NAr the voice for real estate? I think we can do better. Real estate agents can do better. Barry Ritholtz put it this way last September:

And, buyers have figured out that the NAR news releases are unmitigated fantasy. They have learned that any organization that has to go to such lengths to spin bad news must know that the news is much much worse. The result has been a Real Estate buyers strike.

Here it is, three years after that lame defense of NAR spin, and we can see the damage that spin has wrought. It is readily apparent that the NAR has become counter-productive to the agents they are supposed to be serving.

No, the NAR is not supporting you. They are making your jobs much, much harder. They are spinning the public, and doing you an enormous disservice.

Try RealityTM! Its what is working these days.

Reality and truth are casualties of a philosophy that believes manipulation by a trusted adviser is acceptable behavior.

How many realtors made representations to clients during the bubble that induced trusting sheeple to buy homes they couldn't afford?

Do realtors feel guilt over their actions? Actions that caused pain and suffering to those who believed it? Aren't realtors responsible for their representations?

I haven't read any remorseful confessions from realtors, and I don't think that's asking too much. Some lenders feel bad about what happened, but realtors don't feel responsible. They should.

Do the rules apply to the high end?

Shevy and I have been telling people not to buy a house unless you plan to hold for at least 3-5 years and perhaps longer because it will take that long for prices to bottom and them appreciate enough to cover the transaction costs.

Apparently, the high end does not need to worry about that. Prices of the best homes just continue to go up 10%+ per year so no matter when people buy, they can always escape with a profit, right? I don't think so.

The owners of today's featured property bought a year ago, and despite continually dropping sales and asking prices, they believe their house has appreciated nearly 10% last year.

Realistically, they are playing the breakeven negotiating gambit where they price it high enough to pay the commissions and lower their price to get out for what they paid. I don't think it is going to work. Do you?

Irvine House Address … 1 GOLDFINCH Irvine, CA 92603

Resale House Price …… $2,988,500

House Purchase Price … $2,600,000

House Purchase Date …. 4/8/2010

Net Gain (Loss) ………. $209,190

Percent Change ………. 8.0%

Annual Appreciation … 12.0%

Cost of House Ownership

————————————————-

$2,988,500 ………. Asking Price

$597,700 ………. 20% Down Conventional

4.56% …………… Mortgage Interest Rate

$2,390,800 ………. 30-Year Mortgage

$522,823 ………. Income Requirement

$12,199 ………. Monthly Mortgage Payment

$2590 ………. Property Tax (@1.04%)

$600 ………. Special Taxes and Levies (Mello Roos)

$623 ………. Homeowners Insurance (@ 0.25%)

$0 ………. Private Mortgage Insurance

$610 ………. Homeowners Association Fees

============================================

$16,622 ………. Monthly Cash Outlays

-$1789 ………. Tax Savings (% of Interest and Property Tax)

-$3114 ………. Equity Hidden in Payment (Amortization)

$1016 ………. Lost Income to Down Payment (net of taxes)

$394 ………. Maintenance and Replacement Reserves

============================================

$13,128 ………. Monthly Cost of Ownership

Cash Acquisition Demands

——————————————————————————

$29,885 ………. Furnishing and Move In @1%

$29,885 ………. Closing Costs @1%

$23,908 ………… Interest Points @1% of Loan

$597,700 ………. Down Payment

============================================

$681,378 ………. Total Cash Costs

$201,200 ………… Emergency Cash Reserves

============================================

$882,578 ………. Total Savings Needed

Property Details for 1 GOLDFINCH Irvine, CA 92603

——————————————————————————

Beds: 4

Baths: 4

Sq. Ft.: 4510

$663/SF

Property Type: Residential, Single Family

Style: One Level, Tuscan

View: Canyon, Hills, Mountain, Panoramic, Yes

Year Built: 2003

Community: Turtle Rock

County: Orange

MLS#: S658630

Source: SoCalMLS

Status: Active

——————————————————————————

Simply gorgeous single story estate with private guest quarters located in the prestigious guard gated community of Shady Canyon Villas. Quality upgrades include granite chef style kitchen with breakfast island, stainless steel appliances, formal dining room, 500 bottle wine closet, rich hardwood and travertine floors, custom paint, coffered ceilings, venetian plaster entry, custom lighting system plus so much more. Professionally landscaped courtyards with romantic fireplaces, outdoor cabana, and endless views to enjoy!

Shadow inventory can not be absorbed by first-time buyers

A recent study has concluded there are not enough first-time homebuyers to absorb shadow inventory.

Irvine Home Address … 49 CLOUDS Pt Irvine, CA 92603

Resale Home Price …… $2,450,000

I have waited a lifetime

Spent my time so foolishly

t feels like the first time

Feels like the very first time

It feels like the first time

It feels like the very first time

Foreigner — Feels Like the First Time

Someone has to buy all the homes from the banks. The amend-extend-pretend fantasy of lenders is that rising prices from natural demand was going to bail them out. It was never going to happen. As I noted in The Great Housing Bubble:

… late buyers who were “pulled forward” from the future buyer pool overpaid, and many lost their homes. This eliminated them from the buyer pool for several years due to poor credit and newly tightened credit underwriting standards.

We are seeing the impact of a depleted buyer pool now.

In a healthy market, move-up buyers can sell their homes and buy a different one. These buyers represent a significant portion of sales, and they are almost completely absent from the market right now because few of the buyers over the last 5 years have any equity, and many who bought in the 5 years prior are trapped underwater in their debtor's prisons.

The problem with the depleted buyer pool is going to be with us for quite a while.

First, everyone who short-sells, or defaults and goes into foreclosure is going to be forced to wait some period of time before they can obtain a down payment and qualify for a loan. I have documented the government's desperation to qualify warm bodies, but as they lower their standards, they simply encourage more strategic default.

Second, those who lost their jobs will need to wait until lenders consider their work history stable enough to qualify for a loan. Potential borrowers cannot get a job and buy a house a month later. Most often lenders will force a wouldbe buyer to wait for two years of stable employment. in addition, many of the unemployed exhausted their financial reserves to survive the recession, and they don't have the necessary down payment to close the deal.

Third, Americans took on so much debt during the borrowing binge of the 00s that many can't qualify due to the back-end lending ratios which are still quite liberal. Even those who qualify with a 50% back-end DTI really can't afford the property even if they get it.

Fourth, the ongoing slide in prices is going to trap more and more borrowers in an underwater condition preventing them from selling and moving on to another property. Further, the slide in prices erodes the equity future buyers need to provide a down payment for a move up.

Due to the variety of conditions either limiting or eliminating existing owners from entering the buyer pool, it will fall to first-time homebuyers to absorb the inventory controlled by the banks. Unfortunately, there simply aren't enough first-time buyers to do the job.

First-time homebuyers are too few in number to absorb inventory overhang

by CHRISTINE RICCIARDI — Thursday, May 19th, 2011, 1:03 pm

The number of first-time homebuyers coming to market this spring is not enough to absorb the amount of housing inventory on the market.

The percentage of first-time homebuyers searching for a property fell to 35.7% in April, according to the latest Campbell/Inside Mortgage Finance HousingPulse Tracking Survey. First-time homebuyers comprised 43.4% of the demand market in April 2010, when the homebuyer tax credit was in place.

The decline in first-time buyers is largely responsible for the decline in sales. It's a trend likely to continue until well after unemployment bottoms.

In the latest NAr press release (the topic for Monday's post), I found this tidbit:

First-time buyers purchased 36 percent of homes in April, up from 33 percent in March; they were 49 percent in April 2010 when the tax credit was in place. Investors slipped to 20 percent in April from 22 percent of purchase activity in March; they were 15 percent in April 2010. The balance of sales was to repeat buyers, which were 44 percent in April.

First-time homebuyers were nearly half the market, and now they are only a third. Demand was pulled forward as many 2011 buyers opted to overpay in 2010 to obtain the tax credit. As I noted last week, the $8,00 tax credit didn't do homebuyers any favors. Back to the HousingWire article:

Research Director for Campbell Surveys Thomas Popik said while there are still a “normal” number of first-time homebuyers searching for a place to live, the number of available homes is causing a demand gap.

“The normal proportion of first-time homebuyers is about one-third of the market and that’s where we are now,” said Thomas Popik, research director for Campbell Surveys. “Unfortunately, that’s not enough demand to absorb the excess supply from homeowners defaulting on their mortgages.

First-time homebuyers absorb housing inventory, as opposed to current homeowners who trade in their property for a another one, thereby sustaining the supply level. According to the survey, the gap between first-time homebuyers and distressed property supply climbed to 12% in April, compared to just 3.5% in the year prior.

In a normal market, current homeowners do trade in their property for another one, but that isn't what's going on. Current loanowners are trading in their properties for rentals because they are either short selling or going through foreclosure. They are a net loss of buyers in the buyer pool as evidenced by the plummeting home ownership rate.

And, the housing inventory is at a five-month high, according to a report from the Federal Reserve Bank of Cleveland. The report also laid out data that found sales are down 12.6% compared to 2010 (see chart below).

I substituted Calculated Risk's chart in favor of the one provided in the article.

As a result, we expect existing home sales for the spring/summer buying season to be significantly below last year and that will put continued downward pressure on home prices,” Popik said.

Yes, any bullishness for 2011 was crushed by the latest news on sales and prices.

This circumstantial “deficit” of first-time homebuyers is putting a dependence on investors to buy up distressed properties. Investors accounted for 23% of sale transaction activity in April, the Campbell/IMF survey found. This figure is up from 18% one year earlier.

Investors are also buying the properties first-time homebuyers are not, as 45% of foreclosed properties were dubbed damaged or inhabitable in April's survey. The Campbell/IMF Distressed Property Index, which measures the health of the U.S. housing market, fell slightly to 47.7% during the month from 48.6% in March.

When I buy a foreclosure in Las Vegas, about one-third only need minor work, but another third to a half would not pass an FHA inspection. That's why fund's like mine are needed to clean up this mess.

The depleted buyer pool does impact Irvine

Irvine is generally not a first-time homebuyer market. To the degree our market relies on move-up buyers, it faces the challenges listed at the beginning of this post. Expect sales of both new and resale homes to remain tepid for the foreseeable future.

From an IHB reader who commented on the new Irvine Company offerings:

I went to Stonegate Maricopa and Laguna Altura Toscana over the past few days. Findings are below, sales will be slow…..

Though they will both say they are more than pleased with sales, etc., the fact of the matter is they are not starting off like gangbusters compared to the well marketed launch of homes in Woodbury in early 2010. (Though I would love to poll new owners in Woodbury today to see if they feel they got a good deal….)

STONEGATE

– Since early April, Stonegate has sold about 12 houses in Maricopa and they were borderline pushy to sell a Plan 3 home with June delivery once they heard I did not have to sell a home….

– For a house that is nearly a million dollars, I want more than 10 feet from the back of my home to the back of my property….

– Layout of homes on inside were Decent

LAGUNA ALTURA – TOSCANA

– I felt trapped once I was inside the gate – at least 7 minutes from house to any commercial location

– I was surprised that I did not hear the highway traffic more but TOSCANA is farthest from the highway

– NOT a single lot was designated as “sold” though they were happy with sales (read foot traffic) the first 3 days….

– For 1.25 Million, I want more that 12 feet from the back of my house to the back of the lot

– $400 a square foot before landscaping and window treatments, etc. is steep though the layout is functional

– With HOA, RE taxes and Mello Roos, your monthly obligation is nearly $2000 before you even get to the mortgage……

I received this email from a reader:

Laguna Altura appears very much like Stonegate, no, wait, it is EXACTLY the same as Stonegate, except that there are NO schools, no community amenities, killer HOA fees, and a higher tax rate on the smaller homes than on the larger homes….located with only one way in and one way out on one of the most dangerous roads in the county, at prices that are $400/sq/ft…..makes you wonder what were they thinking?

The next $200,000 haircut

Today's featured property is a microcosm of the slow decline in high end prices experienced across much of coastal Southern California.

The property was purchased by a knife catcher in early 2008 for $2,685,000. It was listed for nearly $3M, so the buyer probably felt they got a bargain. They sold it on 4/14/2010 for a $235,000 loss. Given the astronomical cost of ownership on these Turtle Ridge properties, if you add the nearly $10,000 per month they lost in equity, this was a very, very expensive home.

The 2010 knife catcher is trying to get out with a minimal loss. Do you think they will escape unscathed, or will they be the next in line to take a $200,000 haircut?

Irvine House Address … 49 CLOUDS Pt Irvine, CA 92603

Resale House Price …… $2,450,000

House Purchase Price … $2,450,000

House Purchase Date …. 4/14/2010

Net Gain (Loss) ………. ($147,000)

Percent Change ………. -6.0%

Annual Appreciation … 0.0%

Cost of House Ownership

————————————————-

$2,450,000 ………. Asking Price

$490,000 ………. 20% Down Conventional

4.56% …………… Mortgage Interest Rate

$1,960,000 ………. 30-Year Mortgage

$428,616 ………. Income Requirement

$10,001 ………. Monthly Mortgage Payment

$2123 ………. Property Tax (@1.04%)

$450 ………. Special Taxes and Levies (Mello Roos)

$510 ………. Homeowners Insurance (@ 0.25%)

$0 ………. Private Mortgage Insurance

$395 ………. Homeowners Association Fees

============================================

$13,480 ………. Monthly Cash Outlays

-$1659 ………. Tax Savings (% of Interest and Property Tax)

-$2553 ………. Equity Hidden in Payment (Amortization)

$833 ………. Lost Income to Down Payment (net of taxes)

$326 ………. Maintenance and Replacement Reserves

============================================

$10,427 ………. Monthly Cost of Ownership

Cash Acquisition Demands

——————————————————————————

$24,500 ………. Furnishing and Move In @1%

$24,500 ………. Closing Costs @1%

$19,600 ………… Interest Points @1% of Loan

$490,000 ………. Down Payment

============================================

$558,600 ………. Total Cash Costs

$159,800 ………… Emergency Cash Reserves

============================================

$718,400 ………. Total Savings Needed

Property Details for 49 CLOUDS Pt Irvine, CA 92603

——————————————————————————

Beds: 5

Baths: 4

Sq. Ft.: 4333

$565/SF

Property Type: Residential, Single Family

Style: Two Level, Tuscan

View: Tree Top

Year Built: 2004

Community: Turtle Ridge

County: Orange

MLS#: P781598

Source: SoCalMLS

Status: Active

——————————————————————————

Great floor plan for young kids!!! Exclusive community of Turtle Ridge. This Amberhill residence is located on a private cul-de-sac with a lot over 14,500 sqft. Ideal for entertaining, this home features a dramatic living room with vaulted ceilings and a separate dining open to the backyard. A catering gourmet kitchen totally remodeled, upgraded with custom cabinetry, stainless steel appliances and travertine floors. With approx. 4333 sqft of living space, there is plenty of room for everyone. Casita with custom built-ins, wood paneled ceilings & custom fireplace. Master suite with balcony overlooking the pool offering privacy & room for relaxation. Dramatic master bath totally upgraded with stone floors and counters, appointed with custom cherry cabinets and custom details. Entertain and unwind in your own private resort like backyard, professionally landscaped, appointed with a pool, spa, fireplace, built-in bbq & cozy loggia. Minutes from schools, shopping and the beach.

Have a great weekend,

Irvine Renter

California home sales fall 6.1%, prices fall 2.4%

Home sales and prices fell on a year-over-year basis in California. More shockingly, sales fell from March to April during the prime selling season.

Irvine Home Address … 76 LAKEPINES Irvine, CA 92620

Resale Home Price …… $199,900

It don't matter, he's dope

He knows that, but he's broke

He's so stagnant that he knows

When he goes back to his mobile home

Eminem — Lose Yourself

I was bearish at the top of the real estate bubble when few others were. I maintained my bearish views locally while others celebrated the false bottom of March 2009. For nearly two years thereafter, my detractors would stop by and try to educate me on my foolish ways. Some of them are still at it.

As I watched Las Vegas's housing market continue to decline while the government engineered bottom was put in place in other markets, and I became very bullish on Las Vegas, not because real estate prices will be going up there, but because the cashflow is outstanding. I am bullish for reasons independent of resale price appreciation.

The double dip is confirming what me and other housing bears were saying about the nature of markets. For as powerful as the government and federal reserve are, they are powerless against the forces of a multi-trillion dollar housing market.

There have been surprises along the way. In one of my earliest posts back in March of 2007, I predicted there would be some form of government intervention, but I didn't think we would see the federal reserve buying mortgage paper, nor did I foresee the government takeover of the GSEs. It's the surprises that make the evolving story more interesting.

Housing markets exhibit seasonality. Most housing analysts assumed we would have a spring rally of some sort with increasing sales and prices. Even the most bearish analysts have been surprised by the failed spring rally this year. The lack of spring activity is a very good reason to be bearish, and with prices locally above rental parity, there is little reason to be bullish.

California home sales and prices fell in April

A weak home shopping season leaves sales in California down 6.1% and the median price down 2.4% from April 2010.

By Alejandro Lazo, Los Angeles Times — May 17, 2011

California housing sales and prices dipped in April as a weak spring home shopping season took hold in Southern California and the Bay Area.

Typically, sales rise during the spring as many families try to move during the summer school recess. But this year, continued high unemployment and the absence of last year's federal tax credit for buyers are dampening demand.

The decline in sales is very surprising — in a bad way. The main reasons are as he describes.

Sales fell statewide to 35,202 in April, a 3.3% decrease from March and 6.1% drop from April 2010, according to real estate research firm DataQuick of San Diego.

“What's clear now is that 2011 is off to a slow start,” DataQuick President John Walsh said in a news release. “But it's a little soon to write off the rest of the year.”

Prices are falling, demand is low, unemployment is high, prices are still inflated, wages are stagnant, and government props are being removed from the market. What reason is there for optimism about pricing or volume in 2011 in California? I don't think it's too early to write off the rest of the year. If sales and prices typically fall during the fall and winter, and with the conforming limit going down this October, I see many reasons to write off the remainder of 2011.

From DataQuick News:

California April Home Sales

May 16, 2011

An estimated 35,202 new and resale houses and condos were sold statewide last month. That was down 3.3 percent from 36,417 in March, and down 6.1 percent from 37,481 for April 2010. California sales for the month of April have varied from a low of 27,625 in 1995 to a high of 71,638 in 2004, while the average is 44,359. DataQuick's statistics go back to 1988.

Current sales are 20% below average.

The median price paid for a home last month was $249,000, unchanged from March, and down 2.4 percent from $255,000 for April a year ago. The year-over-year decrease was the seventh in a row after 11 months of increases. The bottom of the current cycle was $221,000 in April 2009, while the peak was at $484,000 in early 2007.

The bear rally ended when the tax cuts expired, and prices have been falling every since.

Distressed property sales made up about 54 percent of California’s resale market last month.

Distressed sales are what push prices lower. With over half the market being distressed, and with a large shadow inventory waiting to be sold, house prices will likely go lower.

Of the existing homes sold in April, 36.6 percent were properties that had been foreclosed on during the past year. That was down from 39.1 percent in March and down from 38.1 percent in April a year ago. The all-time high was 58.5 percent in February 2009.

The amend-extend-pretend dance began in 2008, so the foreclosure pipeline peaked several months thereafter as the pipeline flow was reduced to a level that didn't crush prices.

Short sales – transactions where the sale price fell short of what was owed on the property – made up an estimated 17.6 percent of resales last month. That was up from and estimated 17.2 percent in March but down from 17.7 percent a year earlier. Two years ago short sales made up 11.8 percent of the resale market.

Lenders made a conscious decision to resolve more properties through the short-sale process. It has been a failure as REO sales are still double short sales.

The typical mortgage payment that home buyers committed themselves to paying last month was $1,050. That was the same as in March, and down from $1,108 in April 2010. Adjusted for inflation, last month's mortgage payment was 52.7 percent below the spring 1989 peak of the prior real estate cycle. It was 61.7 percent below the current cycle's peak in June 2006.

The nearly vertical red line below in 2003 and 2004 corresponds to the influx of Option ARMs with low teaser rates which allowed borrowers to dramatically increase their mortgage balances and bid up prices. Current loan balances are 61.7% lower than the peak in 2006. It shouldn't be too surprising such an occurrence would cause prices to drop.

San Diego-based DataQuick monitors real estate activity nationwide and provides information to consumers, educational institutions, public agencies, lending institutions, title companies and industry analysts.

Indicators of market distress continue to move in different directions. Foreclosure activity has declined somewhat but remains high by historical standards. Financing with multiple mortgages is low, down payment sizes are stable, cash and non-owner occupied buying has eased a bit this spring but remains relatively high, DataQuick reported.

Media calls: Andrew LePage (916)456-7157 or alepage@dqnews.com

Perhaps down payments are stable in California over the last two years, but that stability is at very low levels reflecting the dominance of FHA financing in the market.

No payments since 2008

The peak buyer of today's featured property paid $332,000 using 100% financing. Her notice of default is dated from 2008 meaning she has been squatting for at least two and a half years.

Foreclosure Record

Recording Date: 06/08/2010

Document Type: Notice of Sale

Foreclosure Record

Recording Date: 04/03/2009

Document Type: Notice of Sale

Foreclosure Record

Recording Date: 12/31/2008

Document Type: Notice of Default

Irvine House Address … 76 LAKEPINES Irvine, CA 92620

Resale House Price …… $199,900

House Purchase Price … $332,000

House Purchase Date …. 7/12/2005

Net Gain (Loss) ………. ($144,094)

Percent Change ………. -43.4%

Annual Appreciation … -8.4%

Cost of House Ownership

————————————————-

$199,900 ………. Asking Price

$6,997 ………. 3.5% Down FHA Financing

4.59% …………… Mortgage Interest Rate

$192,904 ………. 30-Year Mortgage

$42,332 ………. Income Requirement

$0,988 ………. Monthly Mortgage Payment

$173 ………. Property Tax (@1.04%)

$0 ………. Special Taxes and Levies (Mello Roos)

$42 ………. Homeowners Insurance (@ 0.25%)

$222 ………. Private Mortgage Insurance

$290 ………. Homeowners Association Fees

============================================

$1,714 ………. Monthly Cash Outlays

$0 ………. Tax Savings (% of Interest and Property Tax)

-$250 ………. Equity Hidden in Payment (Amortization)

$12 ………. Lost Income to Down Payment (net of taxes)

$45 ………. Maintenance and Replacement Reserves

============================================

$1,522 ………. Monthly Cost of Ownership

Cash Acquisition Demands

——————————————————————————

$1,999 ………. Furnishing and Move In @1%

$1,999 ………. Closing Costs @1%

$1,929 ………… Interest Points @1% of Loan

$6,997 ………. Down Payment

============================================

$12,924 ………. Total Cash Costs

$23,300 ………… Emergency Cash Reserves

============================================

$36,224 ………. Total Savings Needed

Property Details for 76 LAKEPINES Irvine, CA 92620

——————————————————————————

Beds: 1

Baths: 1

Sq. Ft.: 932

$214/SF

Property Type: Residential, Single Family

Style: Two Level

View: Creek/Stream

Year Built: 1977

Community: Northwood

County: Orange

MLS#: P658271

Source: SoCalMLS

Status: Active

——————————————————————————

Nice 1 Bdrm Loft Townhome With Beautiful Water Views. Granite Counter Top in Kitchen. Stand Alone Fireplace in the Living Room; Breakfast Bar and Separate Dining Area. Assigned Carport Parking. Walk-In Master Bdroom Closet. Spacious Back Patio. Private Full-Size Washer/Dryer Hookups.

The $8,000 tax credit didn't do homebuyers any favors

Many housing analysts, myself included, stated the $8,000 homebuyer tax credit would fail to cause the housing market to bottom.

Irvine Home Address … 76 KAZAN St #36 Irvine, CA 92604

Resale Home Price …… $245,000

Don't let me down

Don't make a sound

Don't throw it all away

Remember me

The Klaxons — Not Over Yet

The housing bubble is not over yet. Though delayed for two years, the deflation of the bubble has resumed its progress toward affordability and the purging of kool aid from the beliefs and actions of buyers everywhere.

Many of the buyers in the bear rally of 2009-2010 believed they were getting a good deal on the backs of the taxpayer. They believed they were buying at the bottom and getting government assistance to boot.

They were wrong.

Buyers during the tax credit who purchased early to take advantage of the tax credit were merely being duped into overpaying for real estate by a government intent on bailing out our banking system at the expense of homebuyers and taxpayers alike.

Dean Baker predicted the failure of the tax credit in early 2010.

Dean Baker: We’re Still In a Housing Bubble

January 26, 2010, 11:22 AM ET By Nick Timiraos

,,, Housing economist Dean Baker, the co-director of the Center for Economic and Policy Research, laid out his case at a risk conference last week for why we still have a housing bubble. Adjusted for inflation, home prices are still 15-20% higher than they were in the mid-1990s. “There’s no plausible fundamental explanation for that,” he says.

Why? Simple, he says: Economic fundamentals are all going in the other direction. Rental apartment vacancies are reaching record highs. Many segments of the housing market are still oversupplied. And the core demographic in the country—the baby boomers—are reaching the age where they’re more likely to downsize, buying less house in the years to come.

Far from some rosy estimates that housing is going through a temporary, once in a lifetime downturn, and that once the market bottoms, homes will again appreciate well beyond the rate of inflation, Mr. Baker argues that home prices are far more likely to increase annually at the rate of inflation, at best.

“If anything, I expect housing to be weaker than normal rather than stronger over the next decade,” he says. “People who say this is a temporary story, there’s no real reason to believe anything like that.”

The recent burst of good housing news has been fueled by government stimulus, including the tax credit, low mortgage rates and easy financing from the Federal Housing Administration. Mr. Baker, who had been a skeptic of the tax credit, concedes that it has worked. So, too, he says, has the FHA effectively supplied credit to goose sales.

But that’s likely for the worse, he argues, taking the opposite view of policymakers at the FHA.

As a matter of policy I can’t see that we want people to buy a house in 2009 that’s 10-20% higher than it would sell for in 2011,” he says. “In so far as the FHA was encouraging people to buy homes in bubble markets that were not deflated, that’s not good for the FHA and you didn’t help the homeowner. We didn’t do those people a favor.”

Dean Baker was as right as right can be….

How the $8,000 Tax Credit Cost Home Buyers $15,000

Price declines have more than eclipsed savings, new numbers show.

MAY 10, 2011 — By JACK HOUGH

The government's recent $8,000 cash incentive for first-time home buyers has proved even more costly for recipients than for taxpayers, according to data released Monday. Typical buyers have lost twice as much to price declines as they received from the program.

The median home value fell to about $170,000 in March from $185,000 a year earlier, according to Zillow.com. That means a buyer who closed on a house just before the tax-credit program expired in April 2010 collected $8,000 but has since lost $15,000 in value. Those who bought earlier in the program have done worse; the median price is down $20,000 from March 2009.

By the numbers

“The $8,000 first-time home buyers tax credit . . . has brought many new families into the housing market,” the White House boasted in November 2009 upon announcing an extension and expansion of the program. Judging by sales declines since, that seems beyond doubt. Over the past year, the pace of existing home sales has fallen more than 6% and that of new home sales has fallen 22%.

The credit wasn't great for taxpayers, either. IRS says it paid $26 billion in home buyer credits in 2009 and 2010, enough to cover the maximum $8,000 credit for more than 3 million buyers.

So what did the program accomplish? It funneled money to banks who received larger loan payoffs than they would have if market prices had been allowed to correct naturally. The only beneficiaries of the tax credit were banks.

(It says at least $513 million went for fraudulent claims. Some claimants hadn't bought houses. Some filed twice. Some were under age 18 or incarcerated.)

Mortgage fraud is reaching record levels. It shouldn't be surprising that tax fraud is also on the rise.

In October 2009, when the extension of the $8,000 credit for homebuyers was under consideration, I outlined five reasons the U.S. didn't need more housing perks. These included already-high prices and an abundance of benefits, the questionable stimulus value of home subsidies and a gaping budget deficit. In January 2010, with the extension passed, I recommended that eager buyers wait at least nine months and purposely miss the $8,000 tax credit deadline to take advantage of price declines after. The median price fell about $8,000 over the next nine months and another $8,000 since.

i have consistently maintained that buyers who are concerned about declining prices should wait until the government stimulants were removed from the market. Only after the temporary subsidies were removed would we be able to gauge the health of the housing market. Since the props were removed, prices have steadily fallen, and the pace of the decline is quickening even during the prime buying season.

I realize that writing an apology for this program's failure probably isn't high on Congress's or the President's list of priorities right now. But just in case someone's conscience is bothering them, let me offer a simple draft:

“We thought the $8,000 tax credits would raise house prices and spur the economy. We were wrong. For starters, it makes no sense for a housing affordability program to have the stated goal of raising prices, because higher prices mean less affordability, not more. Another thing: The program didn't work. We squandered taxpayer cash, increased the debt and lured many Americans into losses. We're deeply sorry. We'll try not to repeat the mistake. If anything, in light of America's daunting fiscal challenges, we're going to consider sun-setting costly, existing programs that lure house buyers, like the mortgage interest deduction and capital gains exemption, which together are more than 10 times as expensive as the expired tax credit program, costing about $1,200 per household last year alone.”

No government official will admit failure because they consider it a success. The purpose of the program was to give money to banks. In that regard, it was a success.

For homeowners who are wondering if prices are done falling, and for renters who want to know if now is the time to buy, here's my best guess. In April 2007, when I first wrote that renting had come to make more financial sense than home-ownership, I calculated that prices would have to decline by half to restore the historic relationship between prices and rents. Since then, they've fallen 30% nationwide. Inflation has eaten another 8% of their value. So the worst of the plunge seems done, but prices might drift lower or lose ground to inflation in coming years. In some hard-hit markets, of course, houses are a good deal. For a very rough gauge of value in a specific area, divide recent sale prices by the yearly amount charged to renters for comparable properties. If the result is over 20, prices are probably too high. If it's less than 10, houses might be a steal. If it's in between, well, it's in between.

For another take on prices, consider something I and others have argued about the natural rate of price increase for houses. It's exactly the rate of inflation. Houses, after all, are sticks and stones and other ordinary things, and inflation by definition is the gradual rise in the price of ordinary things. If house prices forever rose faster than the rate of inflation, they'd become infinitely expensive relative to rents, incomes and the cost of building materials.

The truth is a bit more nuanced. Wage inflation is the best barometer of house prices. Inflation of other goods and services may eat into the income available to purchase housing, but the general rate of inflation is not as good a measure as local wage inflation. California house prices have gone up more than the rest of the country partly due to kool aid intoxication and partly due to above average wage growth.

House prices indeed tracked the rate of inflation during the 1970s, 1980s and 1990s, straying only slightly and briefly and returning each time. In 2000, house prices began to detach from the inflation rate and race ahead of it. Therefore, normalcy might be restored once the house price rise since 2000 matches the rate of inflation since then.

Houses are up 41% since 2000. Inflation has increased other costs by 32%. By this measure, too, prices on a national level seem nearly back to normal but not quite there yet.

Barry Ritholtz also believes house prices have not fallen to their historic inflation-adjusted price levels.

Not enough time to Ponzi

The owners of today's featured property bought near the peak and began the process of serial refinancing to obtain HELOC spending money, but the housing bust stopped their plans short. Now they are selling for a big loss and passing the buck on to the bank.

  • They paid $335,000 on 1/21/2005 using a $268,000 first mortgage, a $67,000 second mortgage, and a $0 down payment. Haven't seen many 100% financing deals lately. A few survivors must be around.
  • On 10/14/2005 they refinanced with a $274,891 first mortgage and a $67,000 second.
  • On 9/11/2006 they enlarged their second mortgage with a $80,000 refinance.
  • On 2/28/2007 they obtained a $85,000 HELOC.
  • Their total debt is $359,891 which only represents $24,891 in mortgage equity withdrawal. They bought too late to get much HELOC money, but based on their behavior, that was clearly the plan.
  • They were served notice in February. There is no way to know how long they were in shadow inventory before that.

Foreclosure Record

Recording Date: 02/23/2011

Document Type: Notice of Default

Irvine House Address … 76 KAZAN St #36 Irvine, CA 92604

Resale House Price …… $245,000

House Purchase Price … $335,000

House Purchase Date …. 1/21/2005

Net Gain (Loss) ………. ($104,700)

Percent Change ………. -31.3%

Annual Appreciation … -4.8%

Cost of House Ownership

————————————————-

$245,000 ………. Asking Price

$8,575 ………. 3.5% Down FHA Financing

4.59% …………… Mortgage Interest Rate

$236,425 ………. 30-Year Mortgage

$51,883 ………. Income Requirement

$1,211 ………. Monthly Mortgage Payment

$212 ………. Property Tax (@1.04%)

$0 ………. Special Taxes and Levies (Mello Roos)

$51 ………. Homeowners Insurance (@ 0.25%)

$272 ………. Private Mortgage Insurance

$185 ………. Homeowners Association Fees

============================================

$1,931 ………. Monthly Cash Outlays

-$112 ………. Tax Savings (% of Interest and Property Tax)

-$306 ………. Equity Hidden in Payment (Amortization)

$15 ………. Lost Income to Down Payment (net of taxes)

$51 ………. Maintenance and Replacement Reserves

============================================

$1,578 ………. Monthly Cost of Ownership

Cash Acquisition Demands

——————————————————————————

$2,450 ………. Furnishing and Move In @1%

$2,450 ………. Closing Costs @1%

$2,364 ………… Interest Points @1% of Loan

$8,575 ………. Down Payment

============================================

$15,839 ………. Total Cash Costs

$24,100 ………… Emergency Cash Reserves

============================================

$39,939 ………. Total Savings Needed

Property Details for 76 KAZAN St #36 Irvine, CA 92604

——————————————————————————

Beds: 2

Baths: 1

Sq. Ft.: 900

$272/SF

Property Type: Residential, Condominium

Style: One Level, Other

Year Built: 1972

Community: 0

County: Orange

MLS#: S644297

Source: SoCalMLS

Status: Active

On Redfin: 117 days

——————————————————————————

Great location! Award winning Irvine Schools, and shopping. Quiet and private upstairs location, and close to HOA Amentities. Washer dryer room in unit. Well kept and Perfect for investors or the first time buyer.