Monthly Archives: May 2011

Future homebuyers benefit as current loanowners suffer

To the chagrin of loanowners, falling prices and low interest rates make houses in many markets very affordable.

Irvine Home Address … 145 PATHWAY Irvine, CA 92618

Resale Home Price …… $425,000

and I'm not going back

into rags or in the hole

and our bruises are coming

but we will never fold

and I was your silver lining

as the story goes

I was your silver lining

but now I'm gold

Rilo Kiley — Silver Lining

Most articles on the housing market appear to be written as if everyone who reads them is a homeowner. Everything written about house prices going down is portrayed as bad and visa versa. Despite the fact that nearly 40% of the general population rents most articles are written as if renters are a lowly subclass not worthy of consideration and totally lacking a point of view.

Lower prices benefit renters who are waiting to buy. That is a benefit to 40% of the population, yet their story is never told. Even today's featured article is clearly aimed at homeowners. The author felt it necessary to point out to homeowners that there is another point of view. Some people are benefiting from the housing bust. Apparently, this is such an alien concept that it needs to be pointed out. This won't be news to regular readers of this blog.

For the young, there’s a silver lining in the housing bust

By Robert J. Samuelson, Published: May 8

If you’re a 20-something or even younger, your economic future is at best clouded. Your taxes will almost certainly be higher than today’s; your public services (schools, police, sanitation, defense, scientific research) will almost certainly be lower. Paying for old people, covering rising health-care costs, repairing dilapidated roads and servicing government pensions and the huge federal debt will squeeze take-home pay. Is there any hope for economic gains?

We are also making college much more expensive for young people so they begin their working lives with massive debts. What little discretionary income they have will not support the entitled lives granted an earlier generation. Do We Owe Baby Boomers Their Imagined Home Equity for Retirement?

Well, yes — and from a surprising source. Housing. Say what?

Almost everyone considers the housing collapse a disaster, and it is.

His bias is openly stated.

Since 2007, roughly 8 million homes have gone into foreclosure. Housing prices, according to the widely cited Case-Shiller index, are down about 33 percent from their 2006 peaks. They’re still falling, albeit at a slower pace. In some cities (Atlanta, Cleveland, Las Vegas, Detroit, Phoenix), they’re at or below 2000 levels. Home sales are stunted, and construction is a quarter of its previous peak. Housing’s implosion retards the economic recovery. Aside from unemployed carpenters and real estate agents, there’s much unsold lumber, carpet and appliances.

But housing’s troubles may have a silver lining. If you’re a homeowner, the steep fall in prices is calamitous. But if you’re a future buyer, it’s a godsend. What we’re seeing is a massive wealth transfer from today’s older homeowners to tomorrow’s younger homeowners. From year-end 2006 to 2010, housing values fell $6.3 trillion, reports the Federal Reserve. Assuming there’s no sharp rebound in prices — a good bet — that’s $6.3 trillion the young won’t pay.

Look at how much less a family in Las Vegas now has to spend on housing. The median home price is back at 1995 levels when interest rates were north of 9%.

Affordability is the highest on record in Las Vegas, and it is likely to get even better as the crushing weight of inventory takes its toll.

Up to a point, the lower home prices merely deflate the artificial “bubble.” But there’s evidence that the declines transcend that. The National Association of Realtors routinely publishes a housing “affordability” index, which judges the ability of median families to buy the median-price home at prevailing interest rates. By this measure, existing homes are the most affordable since the index started in 1970.

Young buyers “will be able to enter the housing market at bargain prices,” argues NAR economist Lawrence Yun.

Finally, Lawrence Yun makes a statement that is not complete bullshit. His job will become much easier when reality begins to coincidentally mirror his spin and bullshit — and it will be a coincidence. He or his replacement will spin bullshit endlessly, and those times when their bullshit comes to pass will be an accident. Remember 2006?

When home prices again rise, increases will parallel income gains, meaning that the relative burden of housing costs will remain roughly stable, Yun says. He expects only modest increases in interest rates. (A rise of one percentage point — say, from 5 percent to 6 percent — on a $150,000 mortgage boosts the monthly payment about $95.)

He is clearly torn here. The standard line of NAr bullshit right now is that people need to hurry up and buy while interest rates are low. His realistic expectation of slowly rising interest rates doesn't convey the false sense of urgency that accompanies most NAr propaganda.

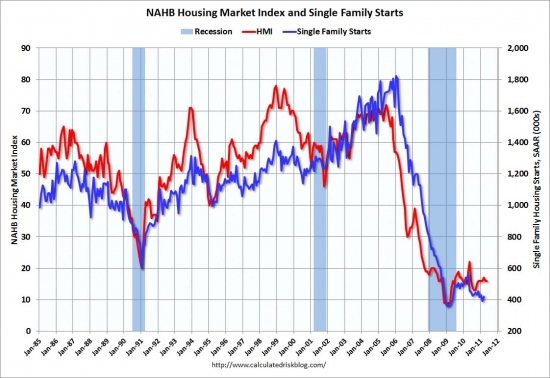
Falling real estate prices have also affected new homes. They’re getting smaller and less embellished, as they must. New homes typically sell at a 10 to 20 percent premium over comparable existing homes. If prices don’t fall, buyers won’t buy. From 1973 to 2007, the size of the average new home grew by about 50 percent, from 1,660 square feet to 2,521 square feet. By 2009, that was 2,438 square feet, with more declines expected.

“People have become much more value oriented,” says Jeff Mezger, chief executive of KB Home, a major builder. At the height of the boom, with cheap mortgage credit widely available, over-confident buyers selected five-bedroom homes with Jacuzzis and granite-top kitchen counters, he says. Now, buyers favor practical amenities: more kitchen cabinets and bigger closets.

KB Homes made the quickest and best adjustments to falling prices by retreating to their small standard offerings of years past. The housing bust has been very hard on the homebuilding industry. Nobody anticipated new construction taking out the previous low of 1992 and staying below this level for nearly 4 years. This will be remembered as the Great Homebuilding Depression by those who endure.

Prior to the housing bubble, smaller square footage used to demand a premium. The expensive kitchens and baths are required in a small studio unit as well as a large McMansion. When dollars per square foot began to rise as houses got larger, homebuilder incentives are to add as much inexpensive square footage in bedrooms, family rooms, great rooms and so on. Hence, we ended up with seas of McMansions. Until the sales price per square foot of SFDs falls below the sales prices per square foot of condos, the market has not reached a stable point, and McMansions will still be supplied in abundance.

We are, perhaps, at a historic juncture. The relentless expansion of home size since World War II — encouraged by federal subsidies, including the mortgage-interest tax deduction — arguably resulted in many Americans being “over-housed.” Homes grew beyond what was “needed” or could even be enjoyed. The reason they kept expanding, Cornell economist Robert Frank has argued, was social competition. People want to be in the “best” neighborhoods with the “best” schools, and these neighborhoods have ever-larger homes. Somewhat smaller homes, Frank contends, won’t make people less happy.

Useless square footage is a thing of the past. Now that people have to pay for their housing with wage income and HELOC supplementation is not forthcoming, buyers will become conscious of every square foot. Bigger will not mean better. During the housing bubble the most borrowers over-extended, the more they were rewarded with HELOC booty and the illusion of price decline immunity. The incentives were all wrong. Now only the kool aid remains.

If the housing collapse mutes this self-defeating syndrome, the main beneficiaries will be today’s young. Their homes will be somewhat cheaper and smaller; their operating costs (mainly utilities) will be somewhat lower. The sacrifices in living standards will be barely noticeable, and the savings — housing, after all, represents most families’ largest expense — will provide some relief from higher taxes and health costs.

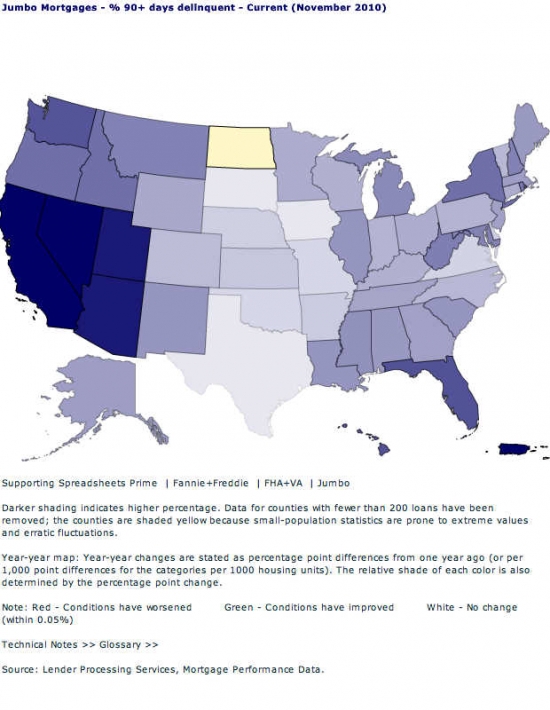
Caveats apply. Housing markets are famously local; what’s true in one won’t be true in another. Moreover, the housing bust still looms large. The young are staying or returning home; new household formations are less than half of previous levels. Mortgage credit is constricted. Private lenders, once promiscuous with loans, are now prudish. Fannie Mae and Freddie Mac are in a state of transition — to what, no one knows. The price adjustment, especially for new homes, is incomplete. Unless these problems are overcome, housing construction will remain depressed. Eventually, the scarcity of homes would push prices up.

But crises pass and have unintended consequences. The young just might catch a much-needed break from this one.

And so will patient IHB readers.

Your time will soon be at hand. IMO, the steep drop in house prices will continue through the end of the year, and it marks the opening of the window of opportunity to find better properties at lower prices. Sellers, mostly banks, will be more abundant and more motivated, particularly as prices decline. The patient will be able to find good deals. Everyone needs to be prepared for a long drawn-out bottoming process with yearly false spring rallies and late-year declines. One of the next few spring rallies will be an enduring one, but there is no way to know which one it will be. It isn't very likely to be 2011, and 2012 is looking even more suspect. Perhaps January to March of 2013 will mark the bottom tick of prices for coveted Irvine SFRs. Perhaps it will be even later.

For me, those are reasons to be bullish. But I am a contrarian, and I won't mind an extended bottoming period to carefully select the property or properties I want to own. If the bottom drags out for five years and provides a window where new owner-occupants find great deals, and I can acquire cashflow positive real estate, I think that is a great thing.

Past Peak Buyer

I don't have a category for the owners of today's featured property. They bought in December of 2007 when prices were just beginning their steep drop. Perhaps this looked like a relative bargain at the time, but since the builders on the Ranch were not lowering their prices in late 2007, they were one of the few sales that took place as down payments skyrocketed. Needless to say, they weren't readers of the blog back then.

These owners put 10% down, and took out a purchase money HELOC for 10% of the price. If they didn't use it, it may retain its non-recourse status. If they did use this HELOC, their recourse protections are gone, and their loss is doubled. In either case, they likely didn't see this purchase as a fast track to losing their money and trashing their credit. By purchasing when they did, they got to experience the steepest drop the market had to offer, at least until now.

Irvine House Address … 145 PATHWAY Irvine, CA 92618

Resale House Price …… $425,000

House Purchase Price … $627,500

House Purchase Date …. 12/6/2007

Net Gain (Loss) ………. ($228,000)

Percent Change ………. -36.3%

Annual Appreciation … -11.1%

Cost of House Ownership

————————————————-

$425,000 ………. Asking Price

$14,875 ………. 3.5% Down FHA Financing

4.59% …………… Mortgage Interest Rate

$410,125 ………. 30-Year Mortgage

$90,001 ………. Income Requirement

$2,100 ………. Monthly Mortgage Payment

$368 ………. Property Tax (@1.04%)

$233 ………. Special Taxes and Levies (Mello Roos)

$89 ………. Homeowners Insurance (@ 0.25%)

$472 ………. Private Mortgage Insurance

$418 ………. Homeowners Association Fees

============================================

$3,680 ………. Monthly Cash Outlays

-$339 ………. Tax Savings (% of Interest and Property Tax)

-$531 ………. Equity Hidden in Payment (Amortization)

$26 ………. Lost Income to Down Payment (net of taxes)

$73 ………. Maintenance and Replacement Reserves

============================================

$2,908 ………. Monthly Cost of Ownership

Cash Acquisition Demands

——————————————————————————

$4,250 ………. Furnishing and Move In @1%

$4,250 ………. Closing Costs @1%

$4,101 ………… Interest Points @1% of Loan

$14,875 ………. Down Payment

============================================

$27,476 ………. Total Cash Costs

$44,500 ………… Emergency Cash Reserves

============================================

$71,976 ………. Total Savings Needed

Property Details for 145 PATHWAY Irvine, CA 92618

——————————————————————————

Beds: 3

Baths: 2

Sq. Ft.: 1700

$250/SF

Property Type: Residential, Condominium

Style: Two Level

View: Hills, Mountain

Year Built: 2007

Community: Portola Springs

County: Orange

MLS#: P775467

Source: SoCalMLS

Status: Active

——————————————————————————

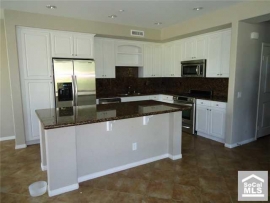
Beautiful home located in the village of PORTOLA SPRINGS and in the IRVINE SCHOOL DISTRICT. This home is located at END-UNIT. Light bright and beautiful kitchen features GRANITE COUNTERTOPS and STAINLESS STEEL appliances with plenty of cabinet and counter space. 10 years builder warranty. Enjoy association POOL, PARK with basketball court, two tennis courts and a recreation center. Easy access to FWY and TALL ROAD. /////MUST SEE!!!/////

Strategic mortgage default has become common and accepted in 2011

Fannie Mae noted in a recent press release that “Nearly Twice as Many Underwater Borrowers Think It Is Okay to Default Due to Financial Distress.” Has strategic default reached a tipping point in America?

53 Carver   Irvine, CA 92620  outside 53 Carver   Irvine, CA 92620  inside

Irvine Home Address … 53 CARVER Irvine, CA 92620

Resale Home Price …… $650,000

It's these changes in latitudes, changes in attitudes

Nothing remains quite the same

With all of our running and all of our cunning

If we couldn't laugh we would all go insane

Jimmy Buffett — Changes in Latitudes, Changes in Attitudes

Attitudes toward strategic default are changing. Last December I flatly stated, Strategic mortgage default will become common and accepted in 2011.

Many of those who chose not to strategically default make this choice because they believe making the payment is a moral obligation — an obligation above and beyond what is written in the contract. Banks are relying on those borrowers motivated by their perceived morality to keep making payments. Unfortunately, there is no longer a moral stigma associated with strategic default (accelerated default is a more accurate term).

Banks need a moral stigma to be associated with loan repayment. If the transaction were viewed by borrowers as a simple business transaction — which it is — then issues of morality are not effective at cajoling debtors into repayment, particularly when default is in the best interest of the debtor. Banks have long relied on borrower morality to get repaid.

Due to the events of the Great Housing Bubble, borrowers no longer feel a moral obligation to repay their mortgage debts. Borrowers view the system as corrupt. Many borrowers believe greedy lenders inflated prices with oversized loans to pad their own profit margins. Those borrowers are correct in their views and beliefs, and based on that view, many borrowers no longer feel compelled by morality to repay their mortgage debt.

Fannie Mae in it's most recent press release confirmed my prediction. Strategic default is rapidly becoming accepted by Americans.

May 11, 2011

Fannie Mae's National Housing Survey Shows Uptick in Consumer Attitudes Since December, But Rising Household Expenses May Be Cause for Concern

Though Perceptions of Investment Safety Have Been Declining, 57 Percent of Americans Believe That Homeownership Has a Lot of Potential as an Investment, Ranking Higher Than Other Investments

Feeling Less Financially Secure, Nearly Twice as Many Underwater Borrowers Think It Is Okay to Default Due to Financial Distress

One of my former co-workers is a deeply moral man. He views life rather simply, and most issues to him are either black or white. I watched him deal with the struggles of our declining incomes as the real estate bust dragged on, yet he remained committed to paying his mortgage on a house in Riverside County that declined about 50% in value. He was paying $3,200 per month for a property he could rent for $1,800.

Late in 2008, the pain became unbearable, and in a sudden change of heart, he moved out of his house to a rental in the same neighborhood and stopped paying his mortgage. In fact, he simply stopped everything. He left the house, stopped communicating with the bank, and moved on with his life. His was a purchase-money, non-recourse loan, so there wasn't much the bank could do.

I never questioned him about his decision. It was none of my business. But knowing the kind of man he is, it must have pained him deeply. I know he was concerned about the standard of behavior he was setting for his children, and he was worried his family and his community would lose respect for him.

As it turned out, he was one of the last on his street to strategically default. All his neighbors he was worrying about had already bailed on their homes. He was the last holdout who fought acceptance of strategic default as an option. It cost him $20,000 more than it would have if he had made his move a year earlier when the situation was already hopeless.

WASHINGTON, DC — Fannie Mae's latest national housing survey finds that Americans expressed more cautious optimism during the first quarter of 2011 than in the fourth quarter of 2010, but they continue to lack confidence in the overall strength of the housing market and economic recovery. The First-Quarter 2011 Fannie Mae National Housing Survey polled homeowners and renters between January 2011 and March 2011. Findings were compared to similar surveys conducted throughout 2010 and December 2003.

Survey results show that Americans' newfound optimism about home prices, the economy, and personal finances is balanced by concerns about rising household expenses, which may require Americans to remain cautions about the recovery. Despite consumer caution, 57 percent of Americans still believe that buying a home has a lot of potential as an investment – ranking higher than other investments, such as buying stocks and putting money into and IRA or 401(k) plan.

Since March of 2009, real estate has been one of the poorest performing asset classes in the country. The stock market has more than doubled. Ben Bernanke's printing press is causing commodities to rise, and most other asset classes have been going up as well. The real estate kool aid is more powerful than reality.

“Despite moderate signs of improvement in the housing market and the overall economy, consumer attitudes continue to be shaped by ongoing concerns about the recovery and their own financial situations,” said Doug Duncan, Vice President and Chief Economist of Fannie Mae. “Uncertainty regarding the improving labor market, expectations of little home price and interest rate movement, and rising household expenses has left consumers feeling less financially secure and translates into weak mortgage demand. While we have seen indications of improving economic activity in recent months, especially the strengthening of private sector employment, consumers' attitudes improved only marginally, and in some areas not at all, from a year ago, reflecting the continued unevenness and uncertainty of this recovery.”

  • Only 33 percent of Americans said they believe the economy is on the right track, up four percentage points from the fourth quarter of 2010, but virtually unchanged from January 2010 (31%).
  • Forty-two percent of respondents said they expect their personal finances to improve over the next year (up by 2 percentage points from the fourth quarter of 2010), compared with 44 percent in January 2010.
  • Forty percent say that their current monthly household expenses are significantly higher than twelve months ago, up from 34 percent in the previous quarter and 31 percent in January 2010.

Does anyone believe the government statistics on inflation? The cost of everything is going up — except real estate.

  • While the number of Americans who perceive homeownership as a safe investment has been declining (from 83% in 2003 to 66% in first quarter of 2011), 57 percent still believe that buying a home has a lot of potential as an investment, more than any other investment tested.
  • Nearly twice as many Underwater Borrowers (27%) think it is okay to walk away from a mortgage if they face financial distress than in January 2010.

They don't devote much text to what is really the only important finding in their study. Of course, this particular fact doesn't bode well for their massive underwater loan portfolio, so they probably aren't going to make it a headline like I did.

Consumer attitudes don't change that fast or that often. For twice as many borrowers to accept strategic default as acceptable behavior is an alarming trend for banks.

As is the case with any change in attitude, it takes a few pioneers to take a bold step forward. When the timid see the success of the bold, they emulate them. If their are significant rewards for the behavior — which there are for strategic default — then the behavior spreads rapidly, and all resistance to the idea is washed away.

Strategic default is part of the downward spiral that crushes house prices. The cycle above can only be broken if negative equity does not prompt strategic default. Since the debt relief is so substantial, the benefits quickly outweigh the negatives. Without a compunction against strategic default, the cycle continues unabated until house price graph looks like Las Vegas's.

That is what strategic default does to a housing market. Lenders are rightfully frightened this outcome will repeat in every housing market in America.

The Fannie Mae First-Quarter 2011 National Housing Survey polled homeowners and renters to assess their attitudes toward owning and renting a home, confidence in homeownership as an investment, the current state of their household finances, views on the U.S. housing finance system, and overall confidence in the economy.

The cognitive dissonance revealed in some of these survey results is truly remarkable. Read on.

Other Survey Highlights

Forty-four percent of homeowners believe that the value of their home today is worth 20 percent or more than what they originally paid for it, declining from 46 percent in June 2010 and 51 percent in January 2010.

One in three Americans (30%) expect home prices to strengthen over the next year, up four percentage points from the fourth quarter of 2010, but virtually unchanged from a year ago.

Most people live in a house seven years or less. Since every market in the county is trading below its 2004 price levels, it is highly unlikely that 44% of homeowners have homes worth 20% more than they paid for it.

Most people don't have a clue about what makes house prices go up and down, so perhaps it isn't too surprising that 30% believe house prices will go up. House prices in nearly every market will decline this year.

Fifty-nine percent of Generation Y Americans (ages 18-34) expect their personal financial situation to improve over the next year, compared to 49 percent among Generation X (ages 35-44) and 37 percent among Baby Boomers (ages 45-64).

Fewer African-Americans think the economy is on the right track (44% in the first quarter of 2011 versus 51% in the previous quarter), and they are less optimistic about their personal finances (61% expect their finances to get better over the next year compared to 67% in the fourth quarter of 2010).

Only 13 percent of Pre-Baby Boomers (age 65+) think it will be easier for the next generation to purchase a home than it was for them, compared with 28 percent of Generation Y Americans.

Does the generation that manages to price-out the subsequent generation feel guilty about their actions? If buyers really are priced out forever, how would homeowners feel about that?

Nearly one in four (23%) Mortgage Borrowers say they are underwater, compared with 30 percent in January 2010.

Only 31 percent of Underwater Borrowers think they have sufficient savings (compared to 42% in June 2010, and 43% of all Mortgage Borrowers).

Forty-six percent of Underwater Borrowers say they are stressed about their ability to make payments on their debt (versus 35% in June 2010, and 33% of all Mortgage Borrowers).

For more detailed findings from the survey, click here.

If nearly half of borrowers are feeling mortgage distress, strategic default will continue to grow in popularity.

Back on the market

Some properties get caught up in the mortgage morass and take years to emerge in the hands of a family who will make it their own. Today's featured property is one such problem child.

I first profiled this property on August 10, 2009 in the post, Power Poker. It appeared again in the April 7, 2010, post, The Debt Star Has Cleared the Planet.

  • This property was purchased for $800,000 on 9/14/2004. The owners used a $640,000 first mortgage and a $160,000 down payment.
  • On 11/18/2005 they refinanced with a $714,750 first mortgage and a $142,950 stand-alone second.
  • The total property debt is $857,700 plus accumulated missed payments.
  • Total mortgage equity withdrawal is $57,700 plus four years of free rent worth approximately $120,000.

Four full years of squatting with no end in sight

There is a reason we have a foreclosure process: when people stop paying, we need to get them out of the property and recycle it to someone who will pay for it. Now, after over four years, she is still there.

Foreclosure Record

Recording Date: 10/15/2009

Document Type: Notice of Sale

Foreclosure Record

Recording Date: 07/09/2009

Document Type: Notice of Default

Document #: 2009000364972

Foreclosure Record

Recording Date: 11/12/2008

Document Type: Notice of Rescission

Document #: 2008000530065

Foreclosure Record

Recording Date: 01/04/2008

Document Type: Notice of Sale

Document #: 2008000006033

Foreclosure Record

Recording Date: 10/01/2007

Document Type: Notice of Rescission

Document #: 2007000592079

Foreclosure Record

Recording Date: 09/27/2007

Document Type: Notice of Default

Document #: 2007000586776

Foreclosure Record

Recording Date: 05/23/2007

Document Type: Notice of Default

Document #: 2007000334839

This house has been in default as long as I have been writing for the IHB. It looks as if they have received two loan modifications, and they still can't make the payments. Obviously, the lender was in no hurry to take this one back. The owners are now working on four years without a consistent mortgage payment, so they are also happy with the status quo.

With owners getting upwards of four years of free housing, strategic default is quite appealing, particularly if the alternative is to stress over payments the borrower cannot afford.

53 Carver   Irvine, CA 92620  outside 53 Carver   Irvine, CA 92620  inside

Irvine House Address … 53 CARVER Irvine, CA 92620

Resale House Price …… $650,000

House Purchase Price … $105,000

House Purchase Date …. 7/24/1998

Net Gain (Loss) ………. $506,000

Percent Change ………. 481.9%

Annual Appreciation … 14.3%

Cost of House Ownership

————————————————-

$650,000 ………. Asking Price

$130,000 ………. 20% Down Conventional

4.59% …………… Mortgage Interest Rate

$520,000 ………. 30-Year Mortgage

$114,113 ………. Income Requirement

$2,663 ………. Monthly Mortgage Payment

$563 ………. Property Tax (@1.04%)

$0 ………. Special Taxes and Levies (Mello Roos)

$135 ………. Homeowners Insurance (@ 0.25%)

$0 ………. Private Mortgage Insurance

$0 ………. Homeowners Association Fees

============================================

$3,361 ………. Monthly Cash Outlays

-$447 ………. Tax Savings (% of Interest and Property Tax)

-$674 ………. Equity Hidden in Payment (Amortization)

$223 ………. Lost Income to Down Payment (net of taxes)

$182 ………. Maintenance and Replacement Reserves

============================================

$2,647 ………. Monthly Cost of Ownership

Cash Acquisition Demands

——————————————————————————

$6,500 ………. Furnishing and Move In @1%

$6,500 ………. Closing Costs @1%

$5,200 ………… Interest Points @1% of Loan

$130,000 ………. Down Payment

============================================

$148,200 ………. Total Cash Costs

$40,500 ………… Emergency Cash Reserves

============================================

$188,700 ………. Total Savings Needed

Property Details for 53 CARVER Irvine, CA 92620

——————————————————————————

Beds: 6

Baths: 4

Sq. Ft.: 2770

$235/SF

Property Type: Residential, Single Family

Style: Two Level, Modern

Year Built: 1979

Community: 0

County: Orange

MLS#: P780607

Source: SoCalMLS

Status: Active

On Redfin: 4 days

——————————————————————————

Irvine home with a little work. Paint, carpet and misc repairs. .. .will go a long way with some TLC.

NAr: sales decline in 78% of markets and prices fall 4.5% nationwide

The spring selling season is sporting sales declines in 78% of MSAs surveyed, and the prices nationally have fallen 4.5% in the last year.

Irvine Home Address … 3101 SCHOLARSHIP Irvine, CA 92612

Resale Home Price …… $880,000

Rise up this mornin'; smiled with the risin' sun.

Three little birds pitch by my doorstep

Singin' sweet songs of melodies pure and true; saying,

“This is my message to you-ou-ou.”

Singin': “Don't worry about a thing,

‘cause ev-ry little thing gonna be all right.”

Bob Marley — Three Little Birds

Is everything going to be all right? Every press release from the National Association of realtors would lead you to believe so. Remember the post on how realtors spin data?

Data: Factual statements that present statistics or some measurable phenomenon. Presenting data is ostensibly the reason for a real estate press release. However, the real intention is to spin the data or otherwise manipulate the interpretation.

Spin: The offered interpretation of data that forwards the agenda of the organization issuing the press release. Spin is usually a plausible interpretation that is most often taken out of context, knowingly, by the authors.

Bullshit: An interpretation of data that is either not factual, or the data itself is not factual, or an interpretation that is not plausible based on the data. Bullshit is an obvious lie an organization passes off to a gullible public in hopes that nobody catches on.

The color coding of text above will be used to help decipher the nonsense that follows.

Because the current data is so bad, the NAr set the spin cycle on high for their first quarter report.

Existing-Home Sales Rise in Most States in First Quarter; Metro Area Prices Mixed

Washington, DC, May 10, 2011

Existing-home sales continued to recover in the first quarter with gains recorded in 49 states and the District of Columbia, while 22 percent of the available metropolitan areas saw prices rise from a year ago, according to the latest survey by the National Association of realtors®.

Home sales did not recover in the first quarter. In fact, they are off considerably. While it may be technically factual that gains were recorded in 49 states, it only takes one reporting location to make that statement true. Nearly every state and the nation as a whole saw declines in sales and in prices. Further, if only 22 percent of MSAs saw prices rise, then 78% saw prices go down. The NAr bullshit doesn't pass the giggle test.

Total state existing-home sales, including single-family and condo, rose 8.3 percent to a seasonally adjusted annual rate1 of 5.14 million in the first quarter from 4.75 million in the fourth quarter, and are only 0.8 percent below a 5.18 million pace during the same period in 2010.

Sales always rise from the 4th quarter to the 1st. Leading off with that spun data point leads them to the far more damaging reality that sales are down from last years anemic levels.

Also in the first quarter, the median existing single-family home price rose in 34 out of 153 metropolitan statistical areas (MSAs) from the first quarter of 2010, including four with double-digit increases; one was unchanged and 118 areas showed price declines.

That is one of the most egregious statements of bullshit I have seen the NAr put out. If prices are falling in 118 out of 153 MSAs, that is 78% of the market. Prices are falling in 78% of the markets surveyed. Read their statement again. Didn't is sound positive? The bullshit lead discusses how many MSAs where the prices are going up. Unbelievable… well, actually this is the NAr.

Now let's hear from the master bullshitter, Lawrence Yun.

Lawrence Yun, NAR chief economist, said home prices are all over the map. “The reading of quarterly price data can be volatile because they are based on the types of homes that are sold during the quarter. When buyers principally purchase distressed properties in a given market, the recorded prices will be very low, which is what we’re seeing now in much of the country,he said. “Annual price data provides a better guide about the direction of the market in those areas.

The national median existing single-family home price was $158,700 in the first quarter, down 4.6 percent from $166,400 in the first quarter of 2010.

I think Yun forgot to proofread his own press release. He was trying to spin the data by saying the annual price change is a better guide, but then he followed with the fact that house prices are down significantly from last year.

He's right about this one. The momentum from last years declines will likely carry forward to the foreseeable future.

The median is where half sold for more and half sold for less. Distressed homes, typically sold at a discount of about 20 percent, accounted for 39 percent of first quarter sales, up from 36 percent a year earlier.

That is some very bad data. How do you think he will spin it?

To clarify, Yun said lower priced homes have seen the best sales performance. The biggest sales increase has been in the lower price ranges, which are popular with investors and cash buyers,he said. “The preponderance of sales activity at the lower end is bringing down the median price, so what we’re seeing is the result of a change in the composition of home sales.

First he is spinning the data by discussing investors and cash buyers. The reality is sales are higher in lower price ranges because that is what people can afford. Affordability is driving sales away from bloated high-end properties toward affordable low-end ones.

He is suggesting in his bullshit that the median home price is artificially low due to a change in mix and things are not as bad as they seem. The fact is high-end prices are too high, credit availability is low, and the buyer pool is seriously depleted. High-end homes will continue to sell slowly until the prices are lowered to affordable levels.

Although sales are slightly below a year ago, the volume of homes sold for $100,000 or less in the first quarter was 8.9 percent higher than the first quarter of 2010, creating a downward skew on the overall median price. The share of all-cash home purchases rose to 33 percent in the first quarter from 27 percent in the first quarter of 2010.

Investors accounted for 21 percent of first quarter transactions, up from 18 percent a year ago, while first-time buyers purchased 32 percent of homes, down from 42 percent in the first quarter of 2010 when a tax credit was in place. Repeat buyers accounted for a 47 percent market share in the first quarter, up from 40 percent a year earlier.

The tax credit definitely pulled forward first-time homebuyer demand. The decline in sales to first-time buyers is not a good sign for a housing market that needs household formation and first-time buyers to mop up the REO inventory.

The rising sales trend in nearly all states is a part of the healing process to clear off inventory. Sales need to rise before prices can firm up,” Yun added.

Another damaging truth he forgot to spin. Sales do need to rise before prices can firm up. That's why declining sales during a period of the year when they should be increasing is worrying to market analysts.

NAR President Ron Phipps, broker-president of Phipps Realty in Warwick, R.I., said strong sales of distressed homes are exactly what the market needs. “The good news is foreclosures, which account for two-thirds of all distressed homes sold, are selling very quickly,” he said. “Short sales still take far too long to get lender approval, but it appears the inventory of distressed property is peaking and will be gradually declining next year. This means the market should slowly return to balance. We are encouraged that recent home buyers are having exceptionally low default rates.

If two-thirds of sales are distressed properties, prices are going to go down. He spins the data by saying these are selling quickly, but based on the data above, that is bullshit.

If the inventory of distressed homes won't peak until later this year and begin to decline next year, what is the urgency to buy?

Recent home buyers are not having exceptionally low default rates unless you are comparing their default rates to the garbage loans underwritten at much higher prices during the 00s. Current default rates are still elevated well above historic norms even for the newest vintage of loans because prices are still falling and most recent buyers with low down payments are already under water.

The rest of the report is data, so I will spare you the green text. I have highlighted the interesting facts to bring them to your attention.

According to Freddie Mac, the national commitment rate on a 30-year conventional fixed-rate mortgage averaged 4.85 percent in the first quarter, up from a record low 4.41 percent in the fourth quarter, but below the 5.00 percent average in the first quarter of 2010.

In the condo sector, metro area condominium and cooperative prices – covering changes in 53 metro areas – showed the national median existing-condo price was $152,900 in the first quarter, down 10.4 percent from the first quarter of 2010. Eleven metros showed increases in the median condo price from a year ago, one was unchanged and 41 areas had declines.

The condo market is a shambles. Prices are down more than 10% year-over-year, and prices have declined in 77% of the MSA polled. That is horrible.

Regionally, existing-home sales in the Northeast increased 0.8 percent in the first quarter to a level of 800,000 but are 7.3 percent below the first quarter of 2010. The median existing single-family home price in the Northeast declined 5.0 percent to $234,100 in the first quarter from a year ago.

Existing-home sales in the Midwest rose 7.9 percent in the first quarter to a pace of 1.09 million but are 5.0 percent below a year ago. The median existing single-family home price in the Midwest fell 5.3 percent to $124,400 in the first quarter from the same period in 2010.

In the South, existing-home sales increased 8.5 percent in the first quarter to an annual rate of 1.96 million and are 2.8 percent higher than the first quarter of 2010. The median existing single-family home price in the South slipped 0.6 percent to $141,800 in the first quarter from a year earlier.

Existing-home sales in the West jumped 13.5 percent in the first quarter to a level of 1.29 million and are 2.1 percent above a year ago. The median existing single-family home price in the West fell 4.7 percent to $197,400 in the first quarter from the first quarter of 2010.

Did you notice that in every region prices declined? Sales were mixed, but the price drops were uniform. Nothing in this press release was encouraging, and for an organization dedicated to creating false urgency in buyers, it's very difficult to spin to their advantage. Perhaps someday, they won't try? I'm not holding my breath.

$1,093 HOA dues

Today's featured property is a flip in Avenue One, an Irvine high rise that never should have been built. It's a standard flip from what I can tell. My data source does not have the purchase record on this property. I was surprised by this seller believing they could fetch a price that the previous seller could not get last year when prices were higher. Perhaps he believes the property is now more valuable because he owns it. Or perhaps he is a delusional fool who will either lose money or fail to sell the property.

Property History for 3101 SCHOLARSHIP

Date Event Price
May 04, 2011 Listed (Active) $880,000
Dec 30, 2010 Sold (MLS) (Closed) $700,000
Dec 23, 2010 Pending (Backup Offers Accepted)
Oct 22, 2010 Price Changed $798,500
Oct 20, 2010 Price Changed $799,500
Oct 06, 2010 Price Changed $829,500
Jul 15, 2010 Listed (Active) $849,500

The HOA dues in these towers are shocking. With monthly cash outlays exceeding $5,500 and a cost of ownership exceeding $4,300 per month, why would anyone buy one of these?

Oh yeah, prices are going back up…

Irvine House Address … 3101 SCHOLARSHIP Irvine, CA 92612

Resale House Price …… $880,000

House Purchase Price … $700,000

House Purchase Date …. 12/30/2010

Net Gain (Loss) ………. $127,200

Percent Change ………. 18.2%

Annual Appreciation … 56.2%

Cost of House Ownership

————————————————-

$880,000 ………. Asking Price

$176,000 ………. 20% Down Conventional

4.62% …………… Mortgage Interest Rate

$704,000 ………. 30-Year Mortgage

$155,033 ………. Income Requirement

$3,617 ………. Monthly Mortgage Payment

$763 ………. Property Tax (@1.04%)

$0 ………. Special Taxes and Levies (Mello Roos)

$183 ………. Homeowners Insurance (@ 0.25%)

$0 ………. Private Mortgage Insurance

$1093 ………. Homeowners Association Fees

============================================

$5,656 ………. Monthly Cash Outlays

-$868 ………. Tax Savings (% of Interest and Property Tax)

-$907 ………. Equity Hidden in Payment (Amortization)

$305 ………. Lost Income to Down Payment (net of taxes)

$130 ………. Maintenance and Replacement Reserves

============================================

$4,316 ………. Monthly Cost of Ownership

Cash Acquisition Demands

——————————————————————————

$8,800 ………. Furnishing and Move In @1%

$8,800 ………. Closing Costs @1%

$7,040 ………… Interest Points @1% of Loan

$176,000 ………. Down Payment

============================================

$200,640 ………. Total Cash Costs

$66,100 ………… Emergency Cash Reserves

============================================

$266,740 ………. Total Savings Needed

Property Details for 3101 SCHOLARSHIP Irvine, CA 92612

——————————————————————————

Beds: 2

Baths: 2

Sq. Ft.: 1715

$513/SF

Property Type: Residential, Condominium

Style: One Level, High or Mid-Rise Condo

View: City Lights, City, Faces West

Year Built: 2008

Community: Airport Area

County: Orange

MLS#: U11001952

Source: SoCalMLS

Status: Active

——————————————————————————

A perfect 10! Located in one of Irvine's most exclusive, prestigious and sought after communities, this 2 bedroom and a den stylish 10th floor, high-end luxury high-rise home boasts the picturesque city view during the day, and gorgeous city lights view at night; this home will absolutely take your breath away. A jaw dropping gourmet kitchen with granite counter tops, marble flooring and all built-in Viking appliances. Community ammenties include rooftop pool and firepit, a large oversized clubroom with full gourmet catering kitchen, outdoor bar-b-ques, indoor gym, and a wine room with private storage locker, 24 hour lobby attendant and concierge service. HOA dues includes: internet, TV, water, gas, trash, insurance, 2 parking spaces, storage space and numerous guest parking. With so many upgrades throught out this home, this hidden gem is a must see. Call for appointment today!

ammenties? throught?

Have a great weekend,

Irvine Renter

Strategic default rises as house prices fall, 28% now underwater

Falling house prices are pushing more loan owners underwater and into strategic default.

Irvine Home Address … 14 ROCKY Knl Irvine, CA 92612

Resale Home Price …… $799,900

i'm underwater

i feel the flood begin

we're flesh and bone

together and alone

and we're looking for a home

Delerium — Underwater

More than 28% of US homeowners underwater on their mortgage

by JASON PHILYAW — Monday, May 9th, 2011, 8:55 am

Home values in the first quarter fell 3% from the prior quarter and are now nearly 30% lower than the June 2006 peak.

Real estate data analytics firm Zillow said its home value index for the first three months of 2011 declined 8.2% from a year earlier to $169,600. The first-quarter decline was the steepest since 2008.

Zillow now doesn't expect home values to reach bottom before 2012, “at the earliest.”

“Home value declines are currently equal to those we experienced during the darkest days of the housing recession,” Zillow Chief Economist Stan Humphries said. “With accelerating declines during the first quarter, it is unreasonable to expect home values to return to stability by the end of 2011. We did expect substantial payback from the homebuyer tax credits, which buoyed the housing market last year, but underlying demand post-tax credit, as well as rising foreclosures and high negative equity rates, make it almost certain that we won't see a bottom in home values until 2012 or later.”

The level of single-family homeowners who owe more on their mortgage than the property is worth rose to a new high of 28.4% at March 31, up from 27% at the end of 2010, according to Zillow.

The percentage underwater is very important because strategic defaults go up significantly when home owners become loan owners as evidenced by the dismal cure rates on underwater loans.

As the author of our next article points out, the 28% figure above is misleading. The truth is more dire. These studies of underwater loan owners only considers the first mortgage. When you factor in the total debt on the property and include the second mortgages and HELOCs, the percentage who are underwater is much higher than 28%.

Strategic defaults could get very ugly

May 4, 2011, 2:01 p.m. EDT– By Keith Jurow

BRIDGEPORT, Conn. (MarketWatch) — In an article posted last September I discussed the growing threat that so-called “strategic defaults” posed to major metros which had experienced a housing bubble.

With home prices showing renewed weakness again, now is a good time to revisit this important issue. See Strategic defaults threaten all major U.S. housing markets

I define a strategic defaulter to be any borrower who goes from never having missed a payment directly into a 90-day default. A good graph, which I will discuss shortly, illustrates my definition.

For purposes of statistical analysis, his definition is useful because it is an easily identifiable trait which can only be explained by a sudden and conscious decision. However, it doesn't pick up the millions of strategic defaulters who struggle for a time juggling payments until they either give up or run out of resources. Many borrowers finally give up after missing some payments, getting behind, and realizing they can never dig out.

Who walks away from their mortgage?

When home prices were rising rapidly during the bubble years of 2003-2006, it was almost inconceivable that a homeowner would voluntarily stop making payments on the mortgage and lapse into default while having the financial means to remain current on the loan.

Then something happened which changed everything. Prices in most bubble metros leveled off in early 2006 before starting to decline. With certain exceptions, home prices have been falling quite steadily since then around the country. In recent memory, this was something totally new and it has radically altered how most homeowners view their house. In those major metros where prices soared the most during the housing bubble, homeowners who have strategically defaulted share three essential assumptions:

The value of their home would not recover to their original purchase price for quite a few years.

• They could rent a house similar to theirs for considerably less than what they were paying on the mortgage.

• They could sock away tens of thousands of dollars by stopping mortgage payments before the lender finally got around to foreclosing.

Put yourself into the mind and shoes of an underwater homeowner who held these three assumptions. Can you see how the temptation to default might be difficult to resist?

Those are the standard reasons for strategic default we have discussed at length on this blog. They are good reasons. Anyone facing those circumstances will benefit financially from walking away. That's why strategic default is so common and will become the norm before this crisis has past.

In fact, one of the primary reasons lenders should never loan money when the rental cashflow doesn't cover the loan payment is because it exposes them to strategic default risk. There is no amount of signatory assurance that will prevent strategic default. The only way lenders can limit their risk effectively is to make sure that the property can cover the payments even if the borrower cannot.

Who doesn’t walk away?

… Last year, two important studies were published which have tried to get a handle on strategic defaults. First came an April report by three Morgan Stanley analysts entitled “Understanding Strategic Defaults.”

The study analyzed 6.5 million anonymous credit reports from TransUnion’s enormous database while focusing on first lien mortgages taken out between 2004 and 2007.

The authors found that loans originated in 2007 had a significantly higher percentage of strategic defaults than those originated in 2004. The following chart clearly shows this difference.

Why are the 2007 borrowers strategically defaulting much more often than the 2004 borrowers? Prices were rising rapidly in 2004 whereas they were falling in nearly all markets by 2007. So the 2007 loans were considerably more underwater than the 2004 loans.

Note also that the strategic default rate rises very sharply at higher Vantage credit scores. (Vantage scoring was developed jointly by the three credit reporting agencies and now competes with FICO scoring.)

Another chart shows us that even for loans originated in 2007, the strategic default percentage climbs with higher credit scores.

Notice in this chart that although the percentage of all loans which defaulted declines as the Vantage score rises, the percentage of defaults which are strategic actually rises.

A safe conclusion to draw from these two charts is that homeowners with high credit scores have less to lose by walking away from their mortgage. The provider of these credit scores, VantageScore Solutions, has reported that the credit score of a homeowner who defaults and ends up in foreclosure falls by an average of 21%. This is probably acceptable for a borrower who can pocket perhaps $40,000 to $60,000 or more by stopping the mortgage payment.

Most people overestimate how damaging strategic default, short sale, or foreclosure are going to be on their credit score. This is a perception lenders foster because if everyone facing strategic default realized how light the punishments really are, nearly everyone would do it.

Further, some people facing strategic default see the light and realize their credit score doesn't matter at all if they simply abstain from using credit. If you have no desire to use credit, your FICO score could fall to zero, and it wouldn't impact your life.

Why do homeowners strategically default?

Is there a decisive factor that causes a strategic default? To answer this, we need to turn to the other recent study.

Last May, a very significant analysis of strategic defaults was published by the Federal Reserve Board. Entitled “The Depth of Negative Equity and Mortgage Default Decisions,” it was extremely focused in scope. The authors examined 133,000 non-prime first lien purchase mortgages originated in 2006 for single-family properties in the four bubble states where prices collapsed the most — California, Florida, Nevada, and Arizona. All of the mortgages provided 100% financing with no down payment.

By September 2009, an astounding 80% of all these homeowners had defaulted. Half of these defaults occurred less than 18 months from the origination date. During that time, prices had dropped by roughly 20%. By September 2009 when the study’s observation period ended, median prices had fallen by roughly another 20%.

People who stretched to buy at the peak were counting on mortgage equity withdrawal to afford their payments and their lifestyles. When it became obvious that money was not going to materialize, the borrowers bailed.

This study really zeroes in on the impact which negative equity has on the decision to walk away from the mortgage. Take a look at this first chart which shows strategic default percentages at different stages of being underwater.

Notice that the percentage of defaults which are strategic rises steadily as negative equity increases. For example, with FICO scores between 660 and 720, roughly 45% of defaults are strategic when the mortgage amount is 50% more than the value of the home. When the loan is 70% more than the house’s value, 60% of the defaults were strategic.

This last chart focuses on the impact which negative equity has on strategic defaults based upon whether or not the homeowner missed any mortgage payments prior to defaulting.

This chart shows what I consider to be the best measure of strategic defaulters. It separates defaulting homeowners by whether or not they missed any mortgage payments prior to defaulting. As I see it, a homeowner who suddenly goes from never missing a mortgage payment to defaulting has made a conscious decision to default.

The chart reveals that when the mortgage exceeds the home value by 60%, roughly 55% of the defaults are considered to be strategic. For those strategic defaulters who are this far underwater, the benefits of stopping the mortgage payment outweigh the drawbacks (or “costs” as the authors portray it) enough to overcome whatever reservations they might have about walking away.

Each borrower has a different tolerance for financial pain. Some bail as soon as they go underwater, and some wait until they are deeply submerged. In markets like Las Vegas where over 80% of loan owners are deeply underwater, even the most upstanding morally guided borrowers with firm beliefs about paying their mortgage will walk away.

Where do we go from here?

The implications of this FRB report are really grim. Keep in mind that 80% of the 133,000 no-down-payment loans examined had gone into default within three years. Clearly, homeowners with no skin in the game have little incentive to continue paying the loan when the property goes further and further underwater.

While the bulk of the zero-down-payment first liens originated in 2006 have already gone into default, there are millions of 80/20 piggy-back loans originated in 2004-2006 which have not.

We know from reports issued by LoanPerformance that roughly 33% of all the Alt A loans securitized in 2004-2006 were 80/20 no-down-payment deals. Also, more than 20% of all the subprime loans in these mortgage-backed security pools had no down payments.

Here is the most ominous statistic of them all. In my article on the looming home equity line of credit (HELOC) disaster posted here in early September Home Equity Lines of Credit: The Next Looming Disaster?, I pointed out that there were roughly 13 million HELOCs outstanding. This HELOC madness was concentrated in California where more than 2.3 million were originated in 2005-2006 alone.

Last April I reported that Banks refuse to recognize HELOC and second mortgage losses. Negotiations with these second lien holders is primarily what holds up short sales.

How many of these homes with HELOCs are underwater today? Roughly 98% of them, and maybe more. Equifax reported that in July 2009, the average HELOC balance nationwide for homeowners with prime first mortgages was nearly $125,000. Yet the studies which discuss how many homeowners are underwater have examined only first liens. It’s very difficult to get good data about second liens on a property.

So if you’ve read that roughly 25% of all homes with a mortgage are now underwater, forget that number. If you include all second liens, It could easily be 50%. This means that in many of those major metros that have experienced the worst price collapse, more than 50% of all mortgaged properties may be seriously underwater.

Realistically, the only thing that kept most of these people paying since early 2009 was the false bottom engineered by the federal reserve. Many more borrowers will strategically default now that prices are falling and hopes of a price recovery are flagging.

The Florida collapse

Nowhere is the impact of the collapse in home prices more evident than in Florida. The three counties with the highest percentage of first liens either seriously delinquent or in pre-foreclosure (default) are all located in Florida. According to CoreLogic, the worst county is Miami-Dade with an incredible 25% of all mortgages in serious distress and headed for either foreclosure or short sale.

An article posted on the Huffington Post in mid-January 2011 describes the Florida “mortgage meltdown” in grim detail. Written by Floridian Mark Sunshine, it begins by pointing out that 50% of all the residential mortgages currently sitting in private, non-GSE mortgage-backed securities (MBS) were more than 60 days delinquent — either seriously delinquent, in default, bankruptcy, or already foreclosed by the bank. I checked his source — the American Securitization Forum — and the percentage was correct.

for more details on mortgage delinquencies by product type, see the interactive graph at the Federal Reserve Bank of New York. Below is the graph for delinquent jumbo loans. Orange County, California has 8.3% delinquent. Apparently local wages don't support the jumbo loans underwritten here.

The author then goes on to discuss a strategic default situation among his friends in Florida. One of them had purchased a condo in early 2007 for $300,000. By mid-2010, it had plunged in value to less than $100,000 and he decided to stop paying the mortgage. When he expressed his concerns about the possible consequences to his buddies — including an attorney, an accountant, and a doctor — all expressed the same advice to him. They told him to walk away from the mortgage, save his money, and prepare to move to a rental unit. To them, it seemed like a no-brainer.

The author was a little surprised that no one thought there was anything wrong with strategically defaulting. The attorney actually suggested that the defaulter file for bankruptcy to prevent the bank from going after a deficiency judgment for the remaining loan balance after the repossessed property was sold.

The attorney was providing sound advice. After a strategic default or a foreclosure on a recourse loan, borrowers should declare bankruptcy. Lenders are merely laying in the weeds waiting for borrowers to become solvent again before pursuing collections. No lender has forgotten they are owed money.

The conclusion expressed by the author has far-reaching implications. As he saw it, “More and more Floridians who pay their mortgage feel like chumps compared to defaulters; they turn over their disposable income to the bank and know it will take most of their lifetimes to recover.

As prices slide to new lows in metro after metro, will this attitude toward defaulting spread from Florida to more and more of the nation? A May 2010 Money Magazine survey asked readers if they would ever consider walking away from their mortgage. The results were sobering indeed:

• Never: 42%

• Only if I had to: 38%

• Yes: 16%

• Already have: 4%

In late January of this year, a report on strategic defaults issued by the Nevada Association of Realtors seemed to confirm the findings of the two studies I’ve discussed. The telephone survey interviewed 1,000 Nevada homeowners. One question asked was this: “Some homeowners in Nevada have chosen to undergo a ‘strategic default’ and stop making mortgage payments despite having the ability to make the payments. Some refer to this as ‘walking away from a mortgage.’ Would you describe your current or recent situation as a ‘strategic default?’”

Of those surveyed, 23% said they would classify their own situation as a strategic default. Many of those surveyed said that trusted confidants had advised them that strategic default was their best option. One typical response was that the loan “was so upside down it would never have been okay.”

What seems fairly clear from this Nevada survey and the two reports I’ve reviewed is that as home values continue to decline and loan-to-value (LTV) ratios rise, the number of homeowners choosing to walk away from their mortgage obligation will relentlessly grow. That means growing trouble for nearly all major housing markets around the country.

Strategic default is the snowball increasing in size as it rolls down hill. Even Fannie Mae has noted that nearly twice as many borrowers think its okay to walk away from their mortgages than just on year ago (more on that later)

The momentum of this second leg down in pricing will likely pick up speed as more and more borrowers strategically default. The only option lenders have is to increase shadow inventory and allow more squatting, but that will in turn encourage more strategic default because borrowers know they get an extended period of free housing.

The herd is spooked, and the stampeded that follows will lead to Las Vegas style market capitulation in many other markets around the country.

He changed his mind

One change in the market I have noted this spring is the number of heavy-cash or all-cash buyers from the bear rally who are bailing out. After two years of negative cashflow and no appreciation to show for it, many FCBs are becoming impatient.

The owner of today's featured property paid $755,000 on 12/26/2008. He used a $417,000 first mortgage and a $338,000 down payment. Like many before him, he is pricing the property at breakeven in hopes a greater fool will come along.

I don't think that greater fool exists in this market. We will see.

Irvine House Address … 14 ROCKY Knl Irvine, CA 92612

Resale House Price …… $799,900

House Purchase Price … $755,000

House Purchase Date …. 12/26/2008

Net Gain (Loss) ………. ($3,094)

Percent Change ………. -0.4%

Annual Appreciation … 2.4%

Cost of House Ownership

————————————————-

$799,900 ………. Asking Price

$159,980 ………. 20% Down Conventional

4.62% …………… Mortgage Interest Rate

$639,920 ………. 30-Year Mortgage

$140,921 ………. Income Requirement

$3,288 ………. Monthly Mortgage Payment

$693 ………. Property Tax (@1.04%)

$0 ………. Special Taxes and Levies (Mello Roos)

$167 ………. Homeowners Insurance (@ 0.25%)

$0 ………. Private Mortgage Insurance

$380 ………. Homeowners Association Fees

============================================

$4,528 ………. Monthly Cash Outlays

-$789 ………. Tax Savings (% of Interest and Property Tax)

-$824 ………. Equity Hidden in Payment (Amortization)

$277 ………. Lost Income to Down Payment (net of taxes)

$120 ………. Maintenance and Replacement Reserves

============================================

$3,312 ………. Monthly Cost of Ownership

Cash Acquisition Demands

——————————————————————————

$7,999 ………. Furnishing and Move In @1%

$7,999 ………. Closing Costs @1%

$6,399 ………… Interest Points @1% of Loan

$159,980 ………. Down Payment

============================================

$182,377 ………. Total Cash Costs

$50,700 ………… Emergency Cash Reserves

============================================

$233,077 ………. Total Savings Needed

Property Details for 14 ROCKY Knl Irvine, CA 92612

——————————————————————————

Beds: 5

Baths: 3

Sq. Ft.: 3100

$258/SF

Property Type: Residential, Condominium

Style: 3+ Levels, Other

View: City Lights, City

Year Built: 1975

Community: Turtle Rock

County: Orange

MLS#: P779956

Source: SoCalMLS

Status: Active

——————————————————————————

The model E has been modified and the downstairs storage areas have been converted to a large bedroom and bathroom on the ground floor. Huge living spaces, two fireplaces and gorgeous hand scraped hard wood floors. 
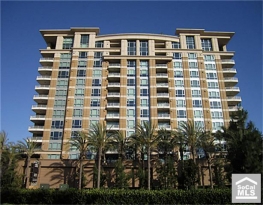
Large master bedroom with huge views over the city of Irvine and a spacious bathroom with separate shower and tub, double sinks and walk in closet. There is a separate laundry room, off the huge kitchen with gorgeous granite counter tops and new dishwasher and a private outside patio just right for BBQ's and a quiet morning coffee and paper reading! New upgraded carpet and padding throughout and Italian porcelain tile on the bathroom and kitchen floors. New fittings and fixtures in wetbar and bathrooms and kitchen, just move in!! What a FIND!

Are government house price supports working?

House price supports engineered by policy in Washington are successful in some markets and failures in others.

Irvine Home Address … 27 RESERVE Irvine, CA 92603

Resale Home Price …… $2,900,000

Oh, I get by with a little help from my friends,

Mmm, gonna try with a little help from my friends

Ooh, I get high with a little help from my friends

Beatles — A Little Help From My Friends

in a move to save our banking system, Ben Bernanke and friends took extraordinary efforts to prop up the housing market.

They failed.

The recent double dip in house prices makes it official: the 2009 bottom built on government props was not durable.

Clear Capital® Reports National Double Dip

U.S. home prices double dip as West, South and Northeast regions fall prey to the last grip of winter.

TRUCKEE, CA – May 5, 2011 – Clear Capital (www.clearcapital.com) today released its monthly Home Data Index™ (HDI) Market Report, and reports prices have double dipped nationally 0.7 percent below prior lows experienced in March 2009. This month’s HDI Market Report provides the most current (through April 2011) and relevant analysis of how local markets performed compared to the national trend in home prices.

Report highlights include:

  • National quarterly home prices changed -4.9%; while year-over-year national price changes reached -5.0%.
  • National home prices have fallen 11.5% over the previous nine-month period, a rate of decline not experienced since 2008.
  • In a sign of the continued volatility and fragility of home prices, all the major Metropolitan Statistical Areas (MSA) tracked in this month’s report showed quarter-over-quarter price declines.
  • National REO saturation rate reaches 34.5%.

“The latest data through April shows a continued increase in the proportion of distressed sales that are taking hold in markets nationwide,” said Dr. Alex Villacorta, director of research and analytics at Clear Capital. “With more than one-third of national home sales being REO, market prices are being weighed down as many markets have not regained enough footing to withstand the strain of the high proportion of REO sales.

One of the mantras of housing bears over the last four years has been the inventory is coming. Of course the bulls dismissed this argument because the banks withheld the inventory, and it didn't appear on the MLS. Many bulls even denied this inventory exists. The facts are that shadow inventory is real, and banks are attempting to meter out properties to the MLS at a rate that doesn't crash prices. However, they are a cartel, and with prices falling and time passing, the pressure to exit the market is growing, and the cartel is starting to fall apart.

In light of the compounding effects of winter’s seasonal slowdown and increased distressed sale activity, the market now faces the true test of whether prices can rebound in the historically active spring season,” added Villacorta.

As national home prices reached new lows this past winter, hopes remain for a spring revival. Markets have entered uncharted territory, however, as this current home buying season will be the first since 2008 without any tax credit incentive. A note of caution to those looking for a strong end to 2011: The last time no incentives were in place and distressed inventories were this high, home prices fell sharply.

The biggest surprise of this years spring selling season has been the lack of volume and continued price declines. Like most housing analysts, I expected some sort of spring rally. So far, no spring rally has materialized. If sales are weak and prices are dropping in a historically vibrant time of year, what is going to happen this fall?

Areas like Irvine could be particularly hard hit by the fall drop because jumbo loan limits are also falling. Less government support means higher interest costs, lower loan balances, and fewer qualified buyers. Who are the banks going to sell their overpriced houses to?

Home Price and REO Saturation Parallels to 2008

Past market reports have shown periods of stabilization. Movements of home prices certainly have been less dramatic than during the start of the downturn in 2006, and two years of mixed seasonal gains and losses have given the appearance that prices are stabilizing, or at least bouncing along a trough.

This assumption of stabilization also considers the last two years have marked a period of external stimulus in the form of tax credits. As an alternative and cautionary reference, below is a comparison between the housing market from spring 2008, through the end of the year; compared to the post tax credit period of late 2010 through April 2011.

National REO Saturation (2008 to 2011)

Last month's HDI Market Report (released April 7, 2011) noted the subtle but rather ominous trend that distressed sales activity in the West, as a percentage of total sales, had climbed after a prolonged 18-month period of general improvements. Nationally, a similar trend has formed with REO saturation climbing to a current level of 34.5 percent after it declined to near 20 percent in mid-2010. Strikingly similar, 2008 saw REO saturation grow from the near 20 percent early in the year to 32 percent by the end of 2008.

National Home Price Change (2008 to 2011)

Looking at home price trends during these same two periods ties together similarities, with a 15.6 percent price decline for the 2008 timeframe compared to the 11.5 percent decline for the mid-2010 through April 2011 period.

This comparison leads to concern over home price declines through the rest of 2011. The trends of 2008 were quickly reversed with the introduction of stimulus measures. However, home prices today are already down nearly 25 percent since the 2008 period, creating increasing home affordability, in addition to gradually improving employment measures. Unlike the 2008 period where the downward trend ended in the winter, we're now heading into the home buying seasons of spring and summer. Regardless, the housing market still faces many challenges that will only be solved through increased buying activity or a reduction in the distressed segment―neither of which is assured in 2011.

That is a very insightful analysis. Distressed inventory is what pushes prices lower. Banks know this, so they embarked on the amend-extend-pretend policy in 2008, they stopped foreclosing on delinquent borrowers, and they amassed a huge shadow inventory.

Amend-extend-pretend: a different kind of crash

One of the big unknowns of the housing bubble is whether or not the policies of the government designed to prop up house prices will be successful in propping up house prices (it's a flawed policy I hope will fail). To date, the policy has failed miserably in Las Vegas, and it has succeeded in Orange County — so far.

As you can see from the chart above, prices in Clark County, Nevada, where Las Vegas is, have fallen well below historic trendlines. This is the main reason I am very bullish on this market. When prices are 40% below where they should be, the cashflow is excellent.

Since prices fell below their historic trendlines, sales volumes have been up. In fact, sales in Las Vegas currently surpass the rate seen at the bubble peak in 2006.

In Orange County the story is very different.

Orange County house prices have not deflated from their bubble highs, and they are still overvalued by historic norms. Elevated prices and a depleted buyer pool have slowed Orange County sales to historic lows, more than 20% off the long term average and well below the sales rates at the bubble's peak.

The Orange County, California, home price premium over Clark County, Nevada

Orange County commands a house price premium over Clark County in direct proportion to the difference in household income. House prices are ultimately tethered to the incomes of the local population who buy houses, so an Orange County price premium around 2 is expected. It's the times when this ratio is out of whack that are instructive.

The housing bubble of the early 90s was experienced in California but not Nevada, so the premium was stretched to about 2.3. During the crash and foreclosure crisis that followed, Nevada house prices kept going up and California house prices went down. Relative to incomes, Orange County house prices were affordable in the mid 90s.

By 2002 house prices in California had recovered, and the state was busy inflating another housing bubble. In response to low affordability in California and other coastal areas, lenders came up with the Option ARM. This loan became very popular in Nevada and in California, and house prices in both states went to the moon.

When the amend-extend-pretend dance began in earnest, product was withheld from the Orange County market and prices temporarily stabilized, albeit at very low sales volumes. In Clark County, lenders were not successful in managing their inventories, and prices kept falling. As a result, the premium in Orange County has been stretched to extremes.

Realistically, what do you think is going to happen?

Will house prices go up in Las Vegas? Will house prices go down in Orange County? Will we embark on a new era where the Orange County premium is sustained at 3.5 where it's no longer supported by incomes?

Personally, I think we will see all of the above. When the foreclosure inventory is worked off, house prices in Las Vegas will stage a comeback to its historic trendline. Due to the foreclosure inventory, house prices in Orange County will continue to fall. It may be many years before the Orange County premium reverts to it's historic mean, but eventually house prices must equalize with income.

Perhaps Las Vegas will always remain a relative bargain. For local residents that would be a good thing.

All Cash buyers are bailing from the high end

Some small number of foreign cash buyers came to Irvine and bought the bear rally. These less-than savvy investors failed to recognize how inflated house prices were, and they overestimated the support other cash buyers would have on the market. Some of those buyers, like the sellers of today's featured property are bailing out and moving on.

It must be very disheartening to lose nearly $2 million because you bought a house in Irvine four years ago.

Irvine House Address … 27 RESERVE Irvine, CA 92603

Resale House Price …… $2,900,000

House Purchase Price … $4,508,000

House Purchase Date …. 4/27/2007

Net Gain (Loss) ………. ($1,782,000)

Percent Change ………. -39.5%

Annual Appreciation … -10.8%

Cost of House Ownership

————————————————-

$2,900,000 ………. Asking Price

$580,000 ………. 20% Down Conventional

4.62% …………… Mortgage Interest Rate

$2,320,000 ………. 30-Year Mortgage

$510,904 ………. Income Requirement

$11,921 ………. Monthly Mortgage Payment

$2513 ………. Property Tax (@1.04%)

$567 ………. Special Taxes and Levies (Mello Roos)

$604 ………. Homeowners Insurance (@ 0.25%)

$0 ………. Private Mortgage Insurance

$410 ………. Homeowners Association Fees

============================================

$16,015 ………. Monthly Cash Outlays

-$1782 ………. Tax Savings (% of Interest and Property Tax)

-$2989 ………. Equity Hidden in Payment (Amortization)

$1005 ………. Lost Income to Down Payment (net of taxes)

$382 ………. Maintenance and Replacement Reserves

============================================

$12,632 ………. Monthly Cost of Ownership

Cash Acquisition Demands

——————————————————————————

$29,000 ………. Furnishing and Move In @1%

$29,000 ………. Closing Costs @1%

$23,200 ………… Interest Points @1% of Loan

$580,000 ………. Down Payment

============================================

$661,200 ………. Total Cash Costs

$193,600 ………… Emergency Cash Reserves

============================================

$854,800 ………. Total Savings Needed

Property Details for 27 RESERVE Irvine, CA 92603

——————————————————————————

Beds: 6

Baths: 6

Sq. Ft.: 5600

$518/SF

Property Type: Residential, Single Family

Style: Two Level, Other

View: City, Ocean, Panoramic

Year Built: 2007

Community: Turtle Ridge

County: Orange

MLS#: S657320

Source: SoCalMLS

Status: Active

——————————————————————————

Exquisite La Cima estate w/ ocean & city light views. Exclusive guarded gated community. Completely designer upgraded(spent well over $800,000)property. Approx. 5600 sq. ft. 6 BR 6.5 Bath. residence crafted to combine magnificence of the indoors w/ the serenity of the outdoors. Additional master bedroom with bonus living room and kitchen equipped with finest appliances. Exposed sand blasted wood beams in ceilings. Central vaccum system. Elaborate laundry room with extra freezers, phone/internet connedctions. Form crown moldings throughout. Charming courtyard entrance, separate living suite(casita). Custom upgraded kitchen w/ large center island, formal dining room. Excellent surround sound throughout interior and exterior of house. Adjacent to Newport coast. Professional outdoor landscaping, w/ waterfalls & built in BBQ. Great amenities & more!

Why does someone need a freezer in a laundry room?

vaccum? connedctions?