The conditions which have the most immediate impact on house prices are the current price levels, housing demand, and available supply. If prices are too high, if demand is too low, and if available supply is too high, prices will move lower as the market seeks a new equilibrium.
The banks have been working to manipulate the market through constricting supply. Lenders have convinced the government and the shoeple that building an enormous shadow inventory is a good thing as long as it temporarily keeps prices elevated. Few loan owners disagree, but those looking for affordable housing find the situation untenable, and many of those potential buyers choose not to buy while potentially deflationary conditions persist.
Prices are too high
So are prices really too high? What is the evidence?
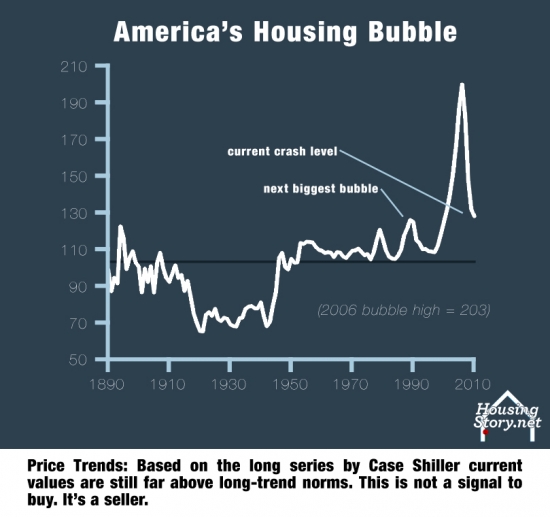
House prices historically have only kept pace with inflation.
Another look at similar data…
We are closer to the bottom than to the top, but based on historic trends both inflation adjusted (top chart) and in nominal terms (bottom chart) prices are simply too high.
Demand is low
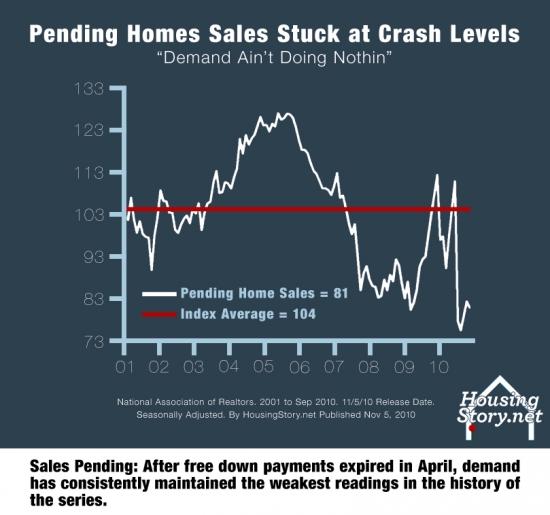
It has been a while since realtors have blathered on about "pent up demand," but as a reminder, Desire is not Demand:
Most people want a house. About 65% of Orange County residents own their homes, but probably 95% of residents wish they did. The desire for housing always exceeds the supply because there is always some segment of the market who is unable to obtain home ownership due to the cost of housing and a lack of available credit. True demand is the amount of money those with the desire for housing can raise to put toward the purchase of real estate. If those with the desire for real estate do not have savings and if they cannot qualify for a loan, they create no measurable demand. When realtors make the assertion that there is pent up demand, they are correctly surmising that there is an increasing number of people who want real estate who cannot obtain it, they are totally incorrect in their idea that this demand is merely sitting on the fence waiting to enter the market at a time of their choosing.
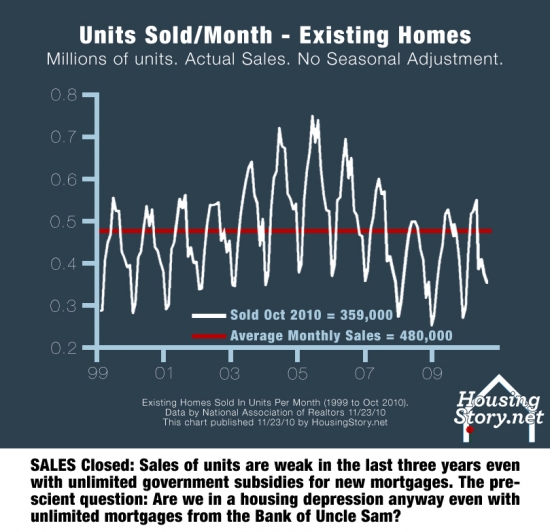
So when I say demand is low, I mean the ability of people to put forth sufficient dollars to purchase properties at today's prices is lower than historic norms. Is there any data to back this claim?
The government and the banking cartel has injected the housing market with excessive stimulation through low interest rates and tax subsidies, yet demand is at historic lows.
The above charts are national numbers, but the local numbers are not any better….
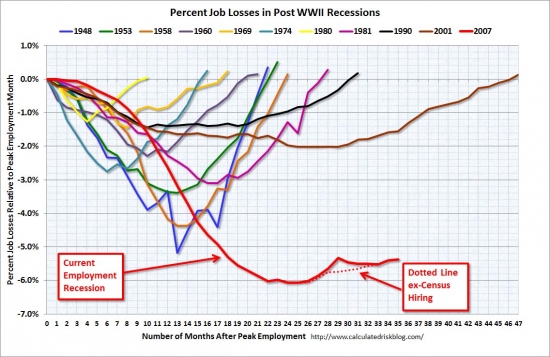
So why is demand so low? Two reasons: (1) unemployment is very high and it isn't projected to get much better any time soon, and (2) the large number of foreclosures has tainted the potential buyer pool with bad credit.
Without a dramatic economic recovery, demand is not going to increase, and few economists are predicting a vigorous economic recovery.
High levels of supply
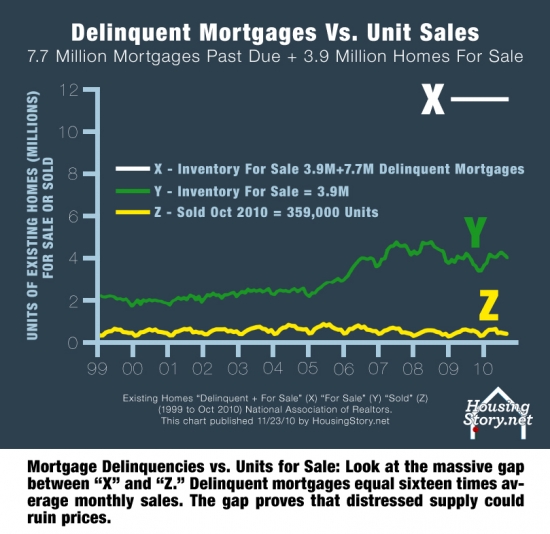
What evidence do we have that supply is high?
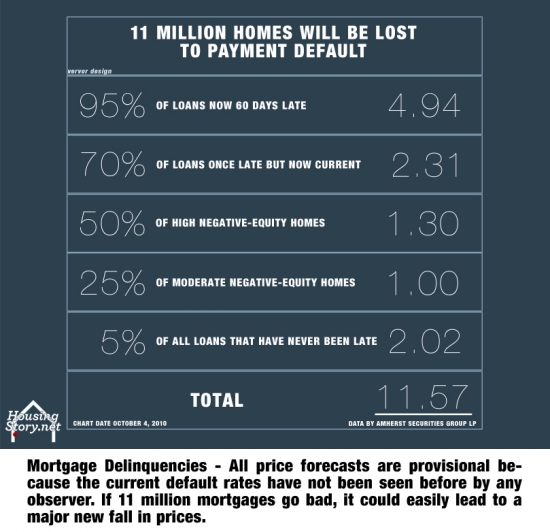
The most troubling part of the elevated inventories is the accumulation of shadow inventory. In order to hold current price levels, banks slowed their foreclosure rates, embarked on amend-extend-pretend, and allowed a great deal of squatting by delinquent borrowers. The above chart is a conservative estimate from First American Core Logic. Other estimates are not so rosy.
When you compare the above chart with the one from First American Core Logic, the most obvious difference is the measure of shadow inventory. The chart above assumes very few of the currently delinquent mortgages will be cured whereas the First American data assumes a healthy cure rate brought about by an improving economy. The real answer is probably somewhere in between, but the situation is probably much worse than First American Core Logic would lead you to believe.
So why are the banks building this huge shadow inventory? They don't have much choice if they wish to remain solvent.
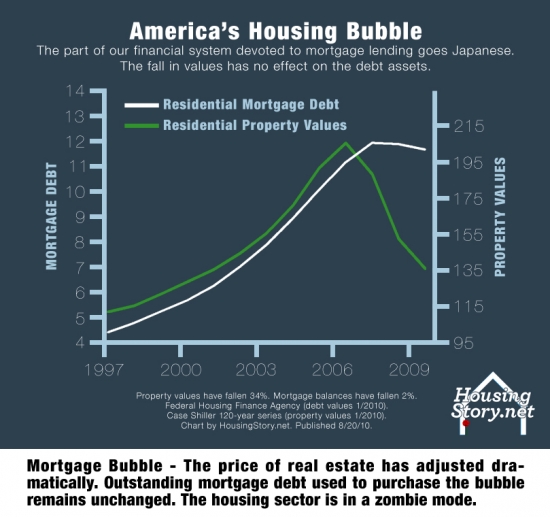
Banks will eventually need to write down this bad debt because prices will not recover as long as the debt overhang exists. If banks had to write down their debt to current values today, they would likely be insolvent, and many would be bankrupt.
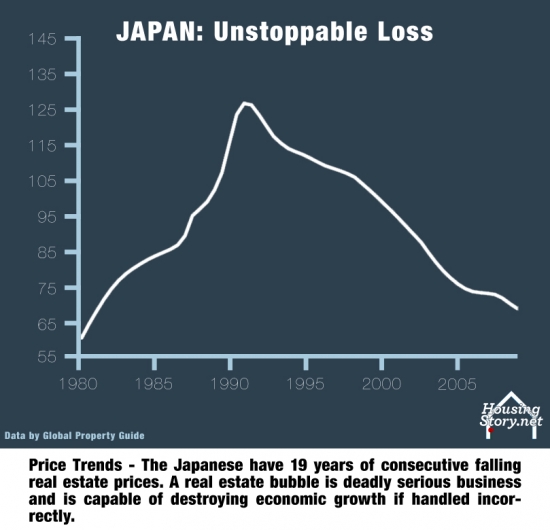
Japan had a similar set of circumstances when their real estate bubble burst in 1989. It didn't turn out well for them either.
Months of supply points to lower prices ahead
The statistic most cited when examining the balance between supply and demand is the months of supply, the number of months it would take to clear the inventory as current sales rates.
Months of supply has been elevated all year, and back in August it hit the highest level ever recorded. When this indicator exceeds six months, prices generally fall. It first broke above six months in mid 2006 as the market peaked. The months of supply fell off quickly in 2009 as banks stopped foreclosing and began their policy of amend-extend-pretend, but the indicated spiked again with the expiration of the tax credits and it has remained elevated as prices have rolled over in a second leg down.
If the asking price is high enough, it isn't a short sale.
I often giggle to myself when I see a WTF asking price followed by a statement that a property is a standard sale. Well, sure it is a standard sale if the seller asks enough to pay off the Ponzi loans they took out.
Today's featured Ponzi bought this house on 9/30/1998 for $215,000. She used a $171,600 first mortgage and a $43,400 down payment.
On 5/17/2001 she obtained a $50,000 HELOC.
On 9/3/20003 she refinanced with a $223,300 first mortgage.
On 5/14/2004 she obtained a $100,000 HELOC.
On 11/10/2005 she refinanced with a $375,000 first mortgage.
On 12/18/2006 she refinanced with a $392,500 first mortgage.
On 10/31/2007 she obtained a stand-alone second for $50,000.
Total property debt is $442,500, so this is a standard sale, assuming she doesn't have to drop her WTF asking price much.
Total mortgage equity withdrawal is $270,900 including her down payment.
Do you want to pay $468/SF for this tiny house to pay off this lady's debts?
Charming detached cottage home in Northwood Pointe. This is the LOWEST PRICED DETACHED HOME that's a STANDARD SALE in Northwood Pointe. Beautifully maintained with laminate wood floors & upgraded neutral carpet & paint. Gourmet kitchen with sparkling white tile counters & white cabinetry opens to living room & dining area. Living room features a cozy gas fireplace, & built-in media unit. French doors open to a secluded front porch area. The dining nook features built-in seating & shelves. From the kitchen, enter a serene garden w/patio area, & wrap around yard- great for relaxing & entertaining. Custom window coverings accent the home. Located on a quiet interior cul de sac street, with one of the larger lots for this floorplan. Association amenities include heated pool, lighted tennis courts, sport courts, playground areas, BBQ's. Walking distance to award winning schools-Canyon View Elem., Northwood High. Close to Tustin & Irvine Marketplace for dining, shopping, entertainment.
Would you spend your fire insurance settlement to fix an underwater house?
When you take out a loan, the lender makes the borrower carry homeowners insurance including protection against loss from a fire. According to the description, today's featured property was damaged by fire and only partially reconstructed.
I am not an expert on fire insurance claims, but if it is like other forms of insurance, the claim is paid to the policy owner — the underwater loan owner. If you were hundreds of thousands of dollars underwater, and if your house burned to the ground and you received an insurance claim, would you repay the bank or bother to rebuild? After a fire seems like a good time to quit paying the mortgage.
This property was purchased for $489,000 on 11/25/2003. The owner used a $391,200 first mortgage, a $97,200 second mortgage, and a $0 down payment. I don't see many of the 100% financing deals anymore. I think most of those loan owners walked in 2007 and 2008.
On 1/4/2005 the loan owner felt the house needed to give him some free spending money, so he refinanced the first mortgage for $495,500 and obtained $6,500.
The kool aid must have tasted good because he obtained a $125,000 HELOC on 2/9/2005.
On 8/30/2005 he refinanced with a $544,000 first mortgage and a $136,000 stand-alone second.
Total property debt was $680,000.
Total mortgage equity withdrawal is $191,000. Not a bad take for two years of ownership and no money down.
He quit paying in late 2009, and the foreclosure went quickly.
Foreclosure Record
Recording Date: 06/10/2010
Document Type: Notice of Sale
Foreclosure Record
Recording Date: 03/09/2010
Document Type: Notice of Default
The lender hoped someone would take this headache off their hands, so they only bid $382,757 at auction. There we no takers. US Bank National Association is now the proud owner of this shell of a house.
California home buyers live in a fairytale world where house prices go up forever and provide them with endless spending money. It's a seductive tale, and many people put their heads in the clouds (or is it up their a$$), live the fairytale and borrow and spend themselves into oblivion. It doesn't matter how much you pay as long as someone else has to pay the bills.
December 1st, 2010, 1:00 am — posted by Jon Lansner
Despite horrific drops in the values of Orange County housing, a local home still practically costs what three typical American homes go for. Yes, one home here or three somewhere near Main Street U.S.A.
That’s one measure of local affordability, on a national scale. Just ponder fresh National Association of Realtors’ home price data for metropolitan areas: A typical Orange County house sold in the third quarter (median selling price: $508,400), cost 2.86 times the median-priced American home (cost: $177,900 in the third quarter!)
It’s equally troubling in a historic context: This Orange County premium remains higher now that it was in 1989 — the peak of the previous run-up in local housing prices.
Let's be clear about what is not happening here: There is not premium for a premium. There is a premium for Orange County real estate compared to the rest of the nation because Orange County residents have higher incomes. However, the premium on the premium paid by Orange County loan owners is causesd by people foolishly over-extending themselves to capture appreciation caused by people foolishly over-extending themselves. It is a self-reinforcing delusion punctuated by periods of steep declines when reality becomes unavoidable.
To be fair, this “Orange County premium” peaked at 3.42 American homes for one Orange County house in 2004. A 19% drop in local prices vs. a 3% drop nationally in the ensuing six years help narrow the local-vs.-national pricing gap.
So, the big question: Is the premium “worth it?” The math suggests that O.C.’s weather, culture and usually above-average salaries — and usually a good job market — supports pricier local housing.
Yes, local imcomes support higher prices, but only to the degree that incomes are higher than other areas. The rest is foolishness and kool aid intoxication.
And since 1982, local housing on average has costs double — eh, 2.38 times to be exact — to buy here compared to that mythical median-price American house.
Current economic weakness, no less some major challenges and the local and state level, bring the size of the premium deserved by Orange County housing into question for the future. Remember, one way to increase demand for housing is to be an attractive draw for out-of-towners seeking new employment of lifestyle.
Who is going to come to Orange County and pay these bloated prices? What high-paying business is going to expand here given the high home prices, high commercial rents, high state taxes, and dysfunctional state government that continually enacts business-unfriendly legislation? And what high wage earners are going to come here so they can pay more taxes and spend 40% or more of their income to live in a house half as nice as what they left behind?
Despite claims to the contrary put forth in the comments, house prices here are not justified by local incomes….
November 22nd, 2010, 9:30 am — posted by Jon Lansner
The price of entry to Orange County remains high.
Metro
Price
Income
Ratio
Honolulu
$621,000
$83,600
7.4
San Francisco
$725,000
$101,000
7.2
New York-NJ
$420,000
$64,700
6.5
O.C.
$530,000
$83,600
6.3
Santa Cruz
$502,000
$84,000
6.0
Los Angeles
$353,000
$61,200
5.8
San Jose
$575,000
$100,400
5.7
San Luis Obispo
$380,000
$69,800
5.4
San Diego
$390,000
$74,100
5.3
Oxnard
$413,000
$86,300
4.8
Nation
Price
Income
Ratio
U.S.
$177,000
$62,000
2.9
Metro
Price
Income
Ratio
Springfield, IL
$116,000
$74,100
1.6
Utica-Rome, NY
$90,000
$57,800
1.6
Grand Rapids, MI
$91,000
$58,900
1.5
Elmira, NY
$85,000
$58,600
1.5
Battle Creek, MI
$81,000
$56,900
1.4
South Bend, IN
$70,000
$53,600
1.3
Decatur, IL
$73,000
$57,600
1.3
Saginaw, MI
$61,000
$49,500
1.2
Detroit
$52,000
$52,000
1.0
Monroe, MI
$63,000
$63,900
1.0
Here’s another measure showing that despite steep price declines, Orange County homes are still costly compared to the rest of the nation — especially when local incomes are figured in!
FiServ’s recent home-price outlook contained intriguing stats on 212 markets and the relationship between the median selling price of homes (for second quarter 2010) in major metropolitan areas across the nation and the local household median incomes from 2009.
What did FiServ find?
In Orange County homes sold for 6.3 times the median family income.
That’s a little more than double the nationwide median of 2.9 years worth of income vs. median home prices.
Orange County ranks as the fourth-highest cost ratio of the 212 markets tracked.
California dominated the 10 costliest list with 8; only Honolulu (No. 1) and New York (No. 3) were from outside the Golden State.
Where’s the “cheapest” housing by this measure? Five of the 10 at the bottom are from Michigan — including Detroit at one year’s salary for a home!
Orange County residents put twice as much of their wage income toward housing than do people living in the rest of the country. Why is that? They do because they think they will get rich owning California real estate. It is foolishness on a grand scale.
Some have argued that housing is scarce, therefore, people are bidding up prices to get whatever is available. If that were true, rents would be correspondingly high. Rents do not support local pricing.
December 2nd, 2010, 4:48 pm — posted by Jon Lansner
Orange County homes are far pricier than most of the housing in Southern California when compared to respective rents in the 7-county area.
County
Ratio
Year Change
O.C.
302
+6%
Santa Barbara
297
+19%
Ventura
259
-2%
San Diego
235
+3%
L.A.
210
+5%
Riverside
183
+15%
San Bernardino
141
+13%
All SoCal
212
+8%
That’s the conclusion of fresh statistics from the Real Estate Research Council of Southern California that involved the age-old buy-or-rent debate.
The council’s math compared median selling prices by county from DataQuick and average asking rents from RealFacts. For the third quarter, Orange County home-sale prices were 302 times local monthly rents — a cost ratio 42% higher than the regional average and the highest of the seven SoCal counties tracked.
Orange County has been the region’s priciest place to own a home by this math since the first quarter of 2008 when Santa Barbara County was tops. In the third quarter, Santa Barbara was second priciest by this measure, with its median sale prices 297 times typical monthly rents.
By this math, renting looked a bit better in the third quarter vs. the previosu three months as the ownehsip cost index rose 6% in Oraneg County and 8% regionwide.
Yet, clearly, tumbling home-sale prices has helped narrow the buy-to-rent gap in recent years. Since the cyclical peak for this ownership-cost ratio five years ago, the Orange County buy-to-rent ratio has fallen 34% while the regional ratio is off 41%.
So Orange County loan owners pay far more for housing as a percentage of their incomes, and they pay far more than is justified by the local rents. So what happens when reality catches up the fantasies of appreciation?
December 1st, 2010, 12:36 pm — posted by Jon Lansner
Sellers of Orange County’s upper-crust properties are doing the deepest discounting.
Recent stats from HousingTracker.net — which tracks prices of homes listing for sale in brokers’ MLS system — show:
At the 75th percentile — the midpoint by price of the upper half of homes listed – Orange County’s asking price in November ran $694,833 – that is down 2.9% vs. the previous month and off 9.8% vs. the year earlier. This marker for Orange County’s higher-priced homes has fallen on a year-over-year basis for eight consecutive months.
At the 25th percentile — the midpoint of the lower half of homes listed – the asking price in November ran $299,940 – that is -2.2% vs. the previous month and 0.1% vs. the year earlier. This marker for Orange County’s cheaper homes has risen on a year-over-year basis for a year. (Arguably, an 0.1% gain isn’t much of an advance!)
The changing fortunes of these two niches puts the pricing gap between top and bottom at 122% — or $365,840 — the thinnest difference in listing prices between high and low ends since April 2008.
This gap was at its peak at 167% — or $500,000 — as recently as August 2009. Since then the “bottom” pricing — the 25th percentile — has been flat while the top’s asking prices — the 75th percentile — dropped 16%!
By the way, the actual median listing price — the 50th percentile — for November was $432,600, down 3.2% in a month and down 3.8% in a year.
The downward trend in asking prices for high-end properties is unmistakable. It will also continue for the foreseeable future because prices are way, way too high. Once the banks get around to foreclosing on the squatters in more expensive homes, inventory will swell further and prices will continue their descent.
Condo values and volatility
One of the more obvious signs that real estate was in a bubble was the price change and price levels of condominiums. Condo values are historically the most volatile. These are typically undesirable or semi-desirable properties, but once kool aid intoxication takes over and lenders fuel the flames with cheap debt, prices really catch fire.
All real estate is valuable in a housing bubble because appreciation rewards everyone. Since condos are relatively inexpensive, it is an easy way for the small-time specuvestor to play the game. The demand for these assets rises to the limit of lender folly during the boom, and it falls to its utilitarian value during a bust. Since people prefer larger detached properties, condos have limited utility, and prices fall precipitously.
It is truly astonishing what people were willing to pay for old, fee-laden, and cramped condos in Irvine. Today's featured property was purchased for $410,000 on 3/23/2006. It was probably a bargain at the time considering it has two bedrooms. There were some one-bedroom units that sold for over $400,000 in Irvine at the peak. The owners used a $328,000 first mortgage, a $82,000 HELOC, and a $0 down payment.
They quit paying the mortgage sometime in early 2009.
Foreclosure Record
Recording Date: 08/20/2009
Document Type: Notice of Default
Since this property is empty, the bank is in no hurry to foreclose. Instead after almost 500 days on the market, it dances to the tune of amend-extend-pretend.
According to the listing agent, this listing may be a pre-foreclosure or short sale.
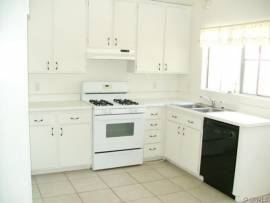
SHORT SALE APPROVED FOR $295,000 BUT 2ND LIEN HOLDER IS STILL CRUNCHING NUMBERS ON WHAT THEY WILL ACCEPT TO RELEASE LIEN. MOTIVATED SELLER. Beautiful, bright and airy 2- bed / 1.5 Ba COndo, Upper-Corner unit. Great Location, walking distance to Irvine Valley Community College. SUBMIT ALL REASONABLE OFFERS. SELLER WILL GIVE EACH OFFER SERIOUS CONSIDERATION.
2ND LIEN HOLDER IS STILL CRUNCHING NUMBERS ON WHAT THEY WILL ACCEPT TO RELEASE LIEN — That is the story will all short sales. Short sales are primarily a negotiation between the delinquent borrower and the second lien holder. It's the main reason short sales take forever and rarely transact.
I hope you have enjoyed this week, and thank you for reading the Irvine Housing Blog: astutely observing the Irvine home market and combating California Kool-Aid since 2006.
In September, home prices continued to slip, and the declines were very widespread. The Case-Schiller Composite 10 City index (C-10) fell 0.67% on a seasonally adjusted basis, and is up just 1.52% from a year ago. The broader Composite 20 City index (which includes the cities in the C-10) fell by 0.80% on the month and is up 0.55% from a year ago.
In August, the year-over-year gains were 2.50% for the C-10 and 1.61% for the C-20, so it looks like the year-over-year gains are rolling over. Of the 20 cities, only one (Washington DC, and it was only up 0.05%) posted a gain on the month, while 19 saw prices fall. Year over year, five metro areas saw gains and 15 suffered losses.
In August, there were also 19 down and just one up. It thus looks like a new downtrend in housing prices is under way.
It is difficult to argue with data. Prices are falling again — and not simply because they always drop a little bit at the end of the year — prices are falling all over the country on a seasonally adjusted basis.
Consider Seasonal Adjustments to Prices There is a seasonal pattern to home prices, and thus it is better to look at the seasonally adjusted numbers than the unadjusted numbers. Most of the press makes the mistake of focusing on the unadjusted numbers.
While the 0.55% rise in the C-20 year over year in isolation is not the end of the world, it hardly makes up for the damage that was done in the popping of the housing bubble, and it is also unlikely to last. From the April 2006 peak of the housing market, the C-10 is down 29.83%, while the C-20 is off by 29.56%.
Calculated Risk has created a great chart compiling house prices calculated by the Case-Shiller method back to the mid 1970s. It clearly illustrates the two previous bubbles largely concentrated on the coasts as well as the Great Housing Bubble.
As you can see from the chart, the Federal Reserve attempted to halt the house price decline before it reached its natural bottom. Perhaps they prevented an overshoot to the downside and saved many banks from going under. If they did, it was at an enormous cost that will ultimately be borne by taxpayers.
The Case-Schiller data is the gold standard for housing price information, but it comes with a very significant lag. This is September data we are talking about, after all, and it is actually a three-month moving average, so it still includes data from July and August.
Existing home sales have been weak since the home buyer tax credit expired (see "Used Home Sales Fall"). In the process, the inventory-to-sales ratio has been extremely high, at 10 months, although that is down from the June peak of 12.5 months. That is what we saw during the implosion of housing prices that took place in 2007 or 2008. Housing prices are going to fall again in the coming months.
It is hard to find much of a silver lining in the month to month data. Only Washington DC posted an increase, and that was anemic at just 0.05%. Only three other cities kept the decline to less than 0.5%: Las Vegas down 0.21%, Denver down 0.30% and L.A. down 0.43%.
On the other hand, there were five cities that posted month-to-month declines of over 1.5%. The Twin Cities were the hardest hit, plunging 2.21%, followed by Cleveland with a 2.00% decline. Portland was down 1.72%, Detroit fell 1.61% and Phoenix fell 1.55%. Those are similar in magnitude to the monthly declines we were seeing three years ago during the first wave of the housing price implosion.
I doubt the upcoming price declines will approach the depth of the previous drop, but it interesting that the decline is picking up speed and it now rivals the rate of decline from three years ago.
Results by Region
On a year-over-year basis, the strongest cities are in California, which was an early poster child for the housing bust. However, even there the year-over-year gains are starting to erode. San Francisco leads the way with a 5.43% rise, followed by San Diego, up 4.94%. LA was in fourth place with a 4.32% year-over-year increase.
DC was in third place with a 4.40% gain. Boston was the only other city with a year-over-year gain, and it was up just 0.39%. As recently as July, the year-over-year gains in California were 11.06% in SF, 9.26% in SD and 7.5% in LA.
There were nine metropolitan areas where the year over year declines were more than 2.5%. Chicago fared the worst with a 5.63% decline, followed by 4.36% in Tampa. It is not going to take global warming to put that entire city underwater — the housing market has already accomplished that.
Charlotte, which early on seemed relatively immune from the housing bust, is down 3.72% year over year. Portland is down 3.63%, and Detroit is off 3.15%. In other words, significant year-over-year declines are happening in just about every corner of the country.
Declines in the areas which did not rally during the bubble are most likely the result of deteriorating employment in the local economies in those areas. Without the bubble rally to facilitate over-borrowing and to create distressed loan owners, other factors must be driving the declines.
The graph below tracks the cumulative declines for each city over time. If the red bar is shorter to the downside than the yellow bar for a city, it indicates that prices in that city have risen since the start of this year.
In every city prices are below where they were in April 2006, but there is a huge variation. Las Vegas is the hardest hit, with prices down 57.57% from the peak, followed by Phoenix down 53.65%. Three more cities are down more than 40%, Miami (down 47.92%), Detroit (off 45.19%) and Tampa (with a 43.53% decline).
At the other end of the spectrum are Dallas (down only 6.26%), Charlotte (off 8.13%) and Denver (down 10.25%). (Note: the percentage declines I am quoting are from when the national peak was hit, the numbers in the graph are relative to that city’s individual peak, so there is a little bit of difference.)
No Support for Home Prices
The homebuyer tax credit was propping up home prices, but now with that support gone, prices are resuming their downtrend. People had until June 30 to close on their houses, and they had to agree to the transaction by April 30. That pulled sales into those months that might otherwise have happened in July or August. The credit was up to $8,000, so almost nobody would want to close their deal in early July and simply leave that money on the table.
The tax credit is a textbook example of a third party subsidizing a transaction. When that happens, both the buyer and the seller will get some of the benefit. The buyer gets his when he files his tax return next year, the seller gets hers in the form of a higher price for the house.
Since the tax credit is now over, that artificial prop to housing prices has been taken away. Sales of existing houses simply collapsed in July, after the credit expired, and have remained depressed ever since. The extremely high ratio of homes for sale to the current selling pace is sure to put significant downward pressure on prices.
There is still quite a bit of “shadow inventory” out there, as well. That is, homes where the owner is extremely delinquent in his mortgage payments and unlikely ever to make up the difference, but that the bank has not yet foreclosed on or foreclosed houses that have not yet been listed for sale.
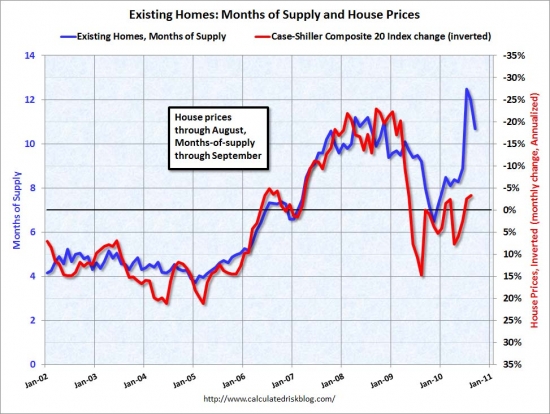
Take a good hard look at the second graph (also from this source) and tell me what you think is going to happen to housing prices over the next few months. A normal market has about six months of supply available. During the bubble, the months of supply generally ran closer to four months, and prices were soaring. It was not until inventories climbed above the six month mark that prices started to fall.
The really collapsed as the months of supply moved into the double digits. The extensive government support for the housing market — including the tax credit, but also the Fed buying up $1.25 Trillion in mortgage paper to artificially depress mortgage rates — helped boost sales and bring the months of supply back down. Now that support is over, and the months of supply far exceed the worst we saw during the heart of the bust (Note: the graph is not updated to include the September data).
Calculated Risk created another interesting chart showing the relationship between months of supply and the monthly price change in the Case-Shiller. He inverted the price change data so the correlation is more obvious.
As you can see, when months of inventory goes up, prices go down. The only way prices hold up is if sales rates remain very low. If banks continue to hold out for top dollar, the inventory will never clear out.
The tax credit was not a very effective means of stimulus, but it did help prop up prices, and that is a pretty important accomplishment, even if it proves to be ephemeral.
Was it really? Why was it so important to temporarily prop up prices? Let's recap what was really accomplished:
create false hope among debtors,
prevent prices from bottoming,
delay the recovery of prices and the economy,
keep homebuilding in the doldrums,
keep a few zombie banks in business,
keep prices artificially high to price out would-be buyers,
and add billions to the bill for taxpayers.
What about that list is positive?
The credit cost the government about $30 billion. A large part of that money went to people who would have bought anyway, but perhaps would have done so in July or August rather than May or June. To the extent it rewarded people for doing what they would have done anyway, it did nothing to stimulate the economy.
Also, turnover of existing houses really does not do a lot to improve the economy. It is the building of new houses that generates economic activity. And it is not just about the profits of D.R. Horton. A used house being sold does not generate more sales of lumber by International Paper or any of the building products produced by Berkshire Hathaway or Masco. It does not put carpenters and roofers to work. New homes do.
While housing prices are important to the economy, the level of turnover in used houses is not. Home equity is, or at least was, the most important store of wealth for the vast majority of families. Houses are generally a very leveraged asset, much more so than stocks. Using your full margin in the stock market still means you are putting 50% down. In housing, putting 20% down is considered conservative, and during the bubble was considered hopelessly old fashioned.
As a result, as housing prices declined, wealth declined by a lot more. For the most part, we are not talking vast fortunes here, but rather the sort of wealth that was going to finance kids' college educations and a comfortable retirement. With that wealth gone, people have to put away more of their income to rebuild their savings if they still want to be able to send the kids to college or to retire.
The decline in housing wealth is a very big reason why retail sales have been so weak. With everyone trying to save, aggregate demand from the private sector is way down. If customers are not going to spend and buy products, employers have no reason to invest to expand capacity. They have no reason to hire more workers.
The cycle of deflation is difficult to stop once it gets started. Bernanke is right to be concerned. However, he is foolishly optimistic in his belief that he can do something about it. He can print a lot of money — which he is doing right now — but he will have to print a lot more to get consumers to change their behavior.
Underwater Mortgages Lead to Foreclosures
Also, as housing prices fell, millions of homeowners found themselves owing more on their houses than the houses were worth. That greatly increases the risk of foreclosure. If the house is worth more than the mortgage, the rate of foreclosure should be zero. Regardless of how bad your cash flow situation is — due to job loss, divorce or health problems for example — you would always be better off selling the house and getting something, even if it is less than you paid for the house, then letting the bank take it and get nothing.
By propping up the price of houses, the tax credit did help slow the increase in the rate of foreclosures.
Still, 23% of all houses with mortgages are worth less than the value of the mortgage today. Another five percent or so are worth less than five percent more than the value of the mortgage. If prices start to fall again, those folks well be pushed underwater as well.
On the other hand, it is not obvious that propping up the prices of an asset class is really something that the government should be doing. After all, it is hurting those who don’t have homes and would like to buy one.
It pisses me off every day to see my government working against my best interest with my tax dollars, particularly in a blatant giveaway to greedy and stupid bankers and greedy and stupid loan owners.
Support for housing goes far beyond just the tax credit. The biggest single support is the deductibility of mortgage interest from taxes. Since homeowners are generally wealthier and have higher incomes than those that rent, this is a case of the lower middle class subsidizing the upper middle class. Also, even if they are homeowners, people with lower incomes are more likely to take the standard deduction rather than itemize their taxes. The mortgage interest deduction only applies if you itemize.
It is also worth keeping in mind in the current debate over extending the Bush tax cuts for just 97% of the population as Obama has proposed, or for 100% of the population as the GOP insists on, that the $250,000 per couple threshold is for adjusted gross income, not the top-line income. Thus, a couple with income of $274,000 (in wages) but who pay $2000 a month in mortgage interest, would not see an increase in their taxes at all.
Housing Prices to Find a Lower Floor
The real problem though is that, now that the tax credit is over, prices will find their more natural level. Fortunately, relative to the level of incomes and to the level of rents, housing prices are now in line with their long-term historical averages, not way above them as they were last year.
In other words, houses are fairly priced — not exactly cheap by historical standards, but not way overvalued, either. That will probably limit how much price fall over the next six months to a year to the 5 to 10% range, rather than the 30% decline we saw from the top of the bubble. That, however, is more than enough of a decline to do some serious damage.
This authors assessment is a good one. I concur with what he wrote above.
The Case-Schiller report was weaker than the consensus expected. The second leg down in housing prices is underway, but fortunately will probably be a much shorter leg than the first one.
Still, that is bad news for the economy. Used homes make very good substitutes for new homes, and with a massive glut of used homes on the market, there is little or no reason to build any new ones.
Residential investment is normally the main locomotive that pulls the economy out of recessions. It is derailed this time around, and there seems to be little the government can do to get it back on track.
There is nothing the government can do to increase residential investment, and they shouldn't try. If they simply let the market work without continuing manipulation, the problem will fix itself, and the economy will improve.
Unfortunately for California, what our economy needs is a huge home price rally and lenders stupid enough to give out HELOCs like drugs at a rave. The California Economy Is Dependent Upon Ponzi Borrowers like the one I am featuring today. How will we make up for the loss of hundreds of thousands of dollars in consumer spending per household?
High end Ponzi borrowing
HELOC abuse is not restricted to social class or income level. It is a common misconception that only the poor and subprime borrowers don't know how to manage their money. High wage earners are equally likely to go Ponzi, particularly if they are trying to keep up with the other Ponzis in the neighborhood or in their social circles. Since high end homes are more expensive, the Ponzi borrowing was more extreme there. No matter how much people make, if they are offered free money, they will take all they are given — even if it costs them their house.
Today's featured property was purchased on 4/29/1999 for $528,000. The owners used a $422,000 first mortgage, a $52,750 second mortgage, and a $53,250 down payment.
On 5/15/2000, after about 1 year of ownership, these owners refinanced with a $540,000 first mortgage, withdrew their $53,250 down payment, and got an extra $12,000 in spending money.
On 3/2/2001 they got a private-party loan for $35,000.
On 3/18/2003 they refinanced with a $650,000 first mortgage and obtained a $32,000 HELOC.
On 8/31/2003 they refinanced with a $738,750 first mortgage.
On 3/19/2004 they obtained a $150,000 HELOC.
On 5/31/2005 they refinanced with a $847,000 Option ARM with a 1% teaser rate.
On 5/31/2005 they obtained a $121,000 HELOC.
On 10/25/2006 they got their final HELOC for $250,000.
Total property debt is $1,097,000 plus negative amortization assuming they maxed out the HELOC.
Total mortgage equity withdrawal is $622,250.
They spent the house, and now they are likely to be a short sale.
According to the listing agent, this listing may be a pre-foreclosure or short sale.
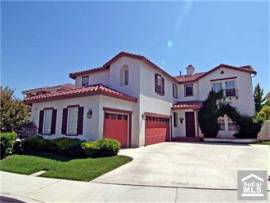
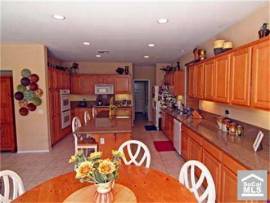
Gorgeous open concept luxury home nestled on quiet cul de sac in highly sought-after gated community. Huge kitchen opens to family room. Spacious master suite. Upstairs bonus/loft area. WOW!
The era of sprawling McMansions is over. The beast is extinct. Austerity is the newest fashion in real estate. Welcome to the dawning of the age of the tiny house.
There is a simple truth that underlies our overly complex existence. The clutter of our daily lives weighs on us like layers of heavy emotion and pressing attachments.
There is a purity to living simply: daily exercise and meditation and surroundings free from clutter and distraction. Monastics have known this for centuries.
Now, with the collapse of the housing bubble and the upheaval to families caused by foreclosure, many are seeking an alternate way of life. A life with a much cozier house….
GRATON, Calif. (AP) — As Americans downsize in the aftermath of a colossal real estate bust, at least one tiny corner of the housing market appears to be thriving.
To save money or simplify their lives, a small but growing number of Americans are buying or building homes that could fit inside many people's living rooms, according to entrepreneurs in the small house industry.
Some put these wheeled homes in their backyards to use as offices, studios or extra bedrooms. Others use them as mobile vacation homes they can park in the woods. But the most intrepid of the tiny house owners live in them full-time, paring down their possessions and often living off the grid.
"It's very un-American in the sense that living small means consuming less," said Jay Shafer, 46, co-founder of the Small House Society, sitting on the porch of his wooden cabin in California wine country. "Living in a small house like this really entails knowing what you need to be happy and getting rid of everything else."
Why Do Buddhists Avoid Attachment? "In nonattachment, on the other hand, there’s unity. There’s unity because there’s nothing to attach to. If you have unified with the whole universe, there’s nothing outside of you, so the notion of attachment becomes absurd. Who will attach to what?"
Because we think we have intrinsic existence within our skin, and what's outside our skin is "everything else," that we go through life grabbing for one thing after another to make us feel safe, or to make us happy."
Shafer, author of "The Small House Book," built the 89-square-foot house himself a decade ago and lived in it full-time until his son was born last year. Inside a space the size of an ice cream truck, he has a kitchen with gas stove and sink, bathroom with shower, two-seater porch, bedroom loft and a "great room" where he can work and entertain — as long as he doesn't invite more than a couple guests.
He and his family now live in relatively sprawling 500-square foot home next to the tiny one.
Shafer, co-owner of the Tumbleweed Tiny House Company, designs and builds miniature homes with a minimalist style that prizes quality over quantity and makes sure no cubic inch goes to waste. Most can be hooked up to public utilities. The houses, which pack a range of amenities in spaces smaller than some people's closets, are sold for $40,000 to $50,000 ready-made, but cost half as much if you build it yourself.
It sounds like a cross between a mobile home, a motor home, and a log cabin.
Tumbleweed's business has grown significantly since the housing crisis began, Shafer said. He now sells about 50 blueprints, which cost $400 to $1,000 each, a year, up from 10 five years ago. The eight workshops he teaches around the country each year attract 40 participants on average, he said.
"People's reasons for living small vary a lot, but there seems to be a common thread of sustainability," Shafer said. "A lot of people don't want to use many more resources or put out more emissions than they have to."
Compared to trailers, these little houses are built with higher-quality materials, better insulation and eye-catching design. But they still have wheels that make them portable — and allow owners to get around housing regulations for stationary homes.
Since the housing crisis and recession began, interest in tiny homes has grown dramatically among young people and retiring Baby Boomers, said Kent Griswold, who runs the Tiny House Blog, which attracts 5,000 to 7,000 visitors a day.
"In the last couple years, the idea's really taken off," Griswold said. "There's been a huge interest in people downsizing and there are a lot of young people who don't want to be tied down with a huge mortgage and want to build their own space."
Everyone here in Irvine still wants to be tied down to a huge mortgage.
Gregory Johnson, who co-founded the Small House Society with Shafer, said the online community now has about 1,800 subscribers, up from about 300 five years ago. Most of them live in their small houses full-time and swap tips on living simple and small.
Johnson, 46, who works as a computer consultant at the University of Iowa, said dozens of companies specializing small houses have popped up around the country over the past few years.
Austerity is one thing, but I think these people take it a bit too far.
"You start to peel away the things that are unnecessary," said Johnson, who now lives in a studio apartment with his wife. "It helps you define your priorities with regard to your material things."
Northern California's Sonoma County has become a mini-mecca for the tiny house industry, with an assortment of new businesses launching over the last few years.
Stephen Marshall, 63, worked as a building contractor for three decades before the real estate market tanked three years ago. That's when he jumped into the tiny house business, starting Petaluma-based Little House On The Trailer.
I enjoy reading about entrepreneurs who found a way to make a new living in real estate. Kudos to Mr. Marshall.
His company builds and sells small houses that can serve as stand-alone homes equipped with bathrooms and kitchens, and others he calls "A Room of One's Own" that can be used as a home office or extra bedroom. Many of his customers are looking for extra space to accommodate an aging parent or adult children who are returning home, he said.
The adult children coming home to a 150 SF detached house ought to motivate them to get a job and rent a nicer place. It must be quite a fall from entitlement to downsize that much.
He said his small houses, which sell for $20,000 to $50,000, are much cheaper than building a home addition and can be resold when the extra space is no longer needed. His company has sold 16 houses this year and aims to sell 20 next year.
"The business is growing as the public becomes aware of this possibility," Marshall said. "A lot of families are moving in with one another. A lot of young people can't afford to move out. There's just a lot of economic pressure to find an alternative way to provide for people's housing needs."
A couple of months ago Terence Chea from the Associated Press contacted me wanting to do a story about the tiny house movement. Terence wanted some local examples of tiny house builders so I put him in contact with Jay Shafer and Stephen Marshall. I also gave him Gregory Johnson of Small House Society contact information. Terence than arranged to come out and interview and video tape us at different locations.
Yesterday the Associated Press published the story with Jay Shafer and Tumbleweed as the top story. He than went on to quote Gregory and myself and closed with Stephen Marshall and Little House on the Trailer. The article went live yesterday and than spread almost virally across the web. Below you will see the story highlighted on Yahoo.com.
The good news is that there has been a huge spike in interest and traffic to our websites and blogs. I had triple the traffic yesterday and if you tried to get to the blog you found it extremely slow. Many more people have discovered the idea of tiny houses. I have been asked to be interviewed on two radio broadcasts and more requests are coming in. You can read the Associated Press article here.
Congratulations, Kent, on your 15 minutes of fame. If you write well about something people find compelling, the word gets out. Nice job.
Demand for McMansions is eternal
Despite the high hopes of tree huggers everywhere, there will always be a demand for McMansions. If they become scarce, demand will be more intense and prices will be higher as the highest wage earners bid up prices with available financing terms.
The simple truth is that people want to live in big detached homes. I want to live in a big detached home. I will settle for whatever I can afford, but I will always prefer a big detached home to a small condo at a transit stop. And so does everyone else. The green movement can't change human nature.
For those who are looking for the simple life in Irvine, today's featured property is about as close as you can get.
Zero down equity surfer
Once the housing market became a blatant and obvious Ponzi Scheme, many posers bought properties with no money down and extracted and spent appreciation as it appeared. Why not? Banks were giving out free money — actually they were more than giving it away, they pushing money on people. All the neighbors were taking it — as illustrated here daily — so it shouldn't be surprising that taking free money became a component of their lifestyle spending. Today we have one such equity surfer. He got as much equity as he could, and now he is discarding the empty shell.
This property was purchased on 5/15/2003 for $240,000. The owner used a $192,000 first mortgage, a $48,000 second mortgage, and a $0 down payment.
On 3/15/2004 he obtained a $25,000 HELOC.
On 4/1/2004 he refinanced with a $243,500 first mortgage.
On 4/29/2005 he obtained a $40,000 HELOC.
On 7/12/2005 he refinanced with a $285,639 first mortgage.
On 8/6/2006 he obtained a $122,000 HELOC.
Total property debt (assuming maxed out HELOC) is $407,639.
Total mortgage equity withdrawal was $167,639.
The return on investment is infinite when there is no investment.
According to the listing agent, this listing may be a pre-foreclosure or short sale.
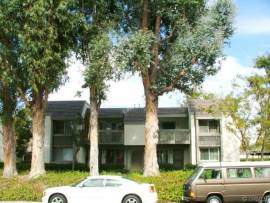
WHAT A DEAL, WOW!!!! NICE LOCATION!!!!ONLY ONE LENDER TO WORK WITH, BANK SAYS BRING YOUR OFFER! BEAUTIFUL AND SPACIOUS UPSTAIRS UNIT CONDO WITH LARGE BALCONY. THIS CONDO OFFERS 2 SPACIOUS BEDROOMS AND 1 BATH. LARGE SIZE KITCHEN WITH FORMAL DINING AREA AND FORMAL LIVING ROOM. LOTS OF CABINETS AND STORAGE THROUGHOUT THE CONDO, LARGE LINEN CLOSET NEXT TO LANDUARY AND STORAGE CLOSET IN BALCONY. THIS WONDERFUL CONDO IS IN PRIME LOCATION, CLOSER TO ALL WOODBRIDE AMENITIES AROUND THE CORNER. VERY CLOSE TO ALL THE MAJOR FREEWAYS 405/I-5/55/241. IF YOU LOVE TO SHOP AND ENJOY WEEKEND AT THE PARK WITH FRIENDS AND FAMILY, THEN YOU'LL LOVE TO LIVE HERE. THIS CONDO IS SURROUNDED BY PARKS, LAKES, AND SHOPPING CENTERS, ALSO AROUND THE CORNER YOU WILL FIND, "IRVINE VALLEY COLLEGE" AND IF YOU LOVE TO GOLF THEN YOU ARE NOT TOO FAR FROM "OAK CREEK GOLF CLUB." THIS CONDO IS VERY CLEAN AND READY TO MOVE IN CONDITION. HURRY BEFORE IT'S TOO LATE!!


 Beautifully maintained with laminate wood floors & upgraded neutral carpet & paint. Gourmet kitchen with sparkling white tile counters & white cabinetry opens to living room & dining area. Living room features a cozy gas fireplace, & built-in media unit. French doors open to a secluded front porch area. The dining nook features built-in seating & shelves. From the kitchen, enter a serene garden w/patio area, & wrap around yard- great for relaxing & entertaining. Custom window coverings accent the home. Located on a quiet interior cul de sac street, with one of the larger lots for this floorplan. Association amenities include heated pool, lighted tennis courts, sport courts, playground areas, BBQ's. Walking distance to award winning schools-Canyon View Elem., Northwood High. Close to Tustin & Irvine Marketplace for dining, shopping, entertainment.
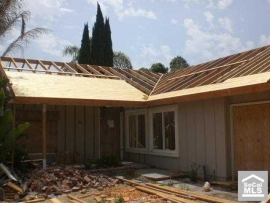
.jpg)


.jpg)


.jpg)


