Foreclosure's economic impact and the Great Recession

The academic paper i am reviewing today attempts — and fails — to accurately define and describe a relationship between foreclosures and the economy.

Irvine Home Address … 12 SANTA RIDA Irvine, CA 92606

Resale Home Price …… $859,000

Brain damage, ever since the day I was born

Drugs is what they used to say I was on

They say I never knew which way I was goin

But everywhere I go they keep playin my song

Eminem — Brain Damage

Academic writing is the only endeavor that you can take common sense, mathematically measure it, statistically analyze it, pompously write about it, and still get it completely wrong. The academic article featured today attempts to take a common sense idea — foreclosures impact house prices and the economy — and try to find some relationships that may have predictive power. They failed. They failed because they didn't properly identify causation.

Correlation is not causation

Have you heard the term post hoc ergo propter hoc? It means that just because something follows an event doesn't mean the first event caused the other. The error the authors make today is rooted in the same problem.

These authors have identified foreclosures as a causal event or circumstance which leads to other economic woes. In fact, foreclosures are another symptom of the same underlying problems — excessive debt, toxic mortgages and borrower insolvency. Foreclosures do not cause indebtedness. But excessive indebtedness is the cause of all our economic problems including foreclosures.

The bubonic plague analogy

Let's say we are doctors examining the circumstances and conditions surrounding bubonic plague, also known as the black death. Doctors noticed bulbous lesions called buboes patients often displayed before becoming very ill and dying. It would be reasonable to postulate that the buboes were the cause of death. They weren't. The nasty black buboes are merely another symptom of the disease.

in the same way, foreclosures aren't the cause of anything. People taking on excessive debts under terms with onerous and sometimes escalating payments is the root cause of all the woes in the housing market. Lenders created more debt than current incomes can support under stable terms. When the system collapsed, many borrowers became financially distressed and stopped making their mortgage payments. Mortgage delinquency is at the core of our economic problems.

Mortgage delinquency can be caused by excessive debt or borrower distress. The excessive debts of the Ponzis would have taken out the housing market even if the collapse didn't spill over into other areas of the economy. However, the implosion of the Ponzis did cause widespread economic pain because the loss of consumer spending and the dramatic decline in the demand for real estate. Therefore, the excessive debt distressed an entire class of borrowers who may or may not have been as irresponsible as the Ponzis.

Mortgage delinquency may or may not cause a foreclosure. A certain amount of mortgage distress is always present in the market. Usually, when people get into financial trouble, they simply sell their house, pocket the equity, and go on with their lives. No foreclosure. However, once prices start to fall, people submerge beneath the surface of their debts, and they can no longer sell into a rising market. With resale not being an option, many more foreclosures occur.

Since mortgage delinquency is the real problem, and since foreclosures are an incidental byproduct that only occurs when market conditions are bad, foreclosures are not the direct cause of anything. Also, not all delinquent borrowers have become foreclosures as lenders are building a huge shadow inventory of delinquent mortgage squatters, and not all foreclosures make their way onto the MLS immediately as lenders often take their REO off the market hoping for better days.

Distressed resales lower prices, and foreclosures often become distressed resales. This relationship is direct. Lenders know this, so they are withholding inventory from the market to prevent prices from going any lower. Further, lower prices prompts more of the marginally distressed loan owners into default creating an indirect impact and a self-reinforcing downward spiral.

Notice that foreclosures, though a big part of the story, are not a direct causal factor for much of anything. Keep the plague analogy in mind as you sift through the academic formalities.

Foreclosures, house prices, and the real economy

Atif Mian, Amir Sufi, Francesco Trebbi

10 February 2011

Several academics, policymakers, and regulators emphasize the role of foreclosures in the Great Recession and subsequent global crisis. This column provides one of the first attempts to show this empirically. Using micro-level data from all US states, it shows that foreclosures had a significant negative effect on house prices, residential investment, durable consumption – and consequently the real economy.

How does a negative shock to the economy get amplified into a severe and long-lasting economic slump? The answer may be found in your house. An extensive body of theoretical research shows that the forced sale of durable goods – in many cases a house – can have two undesirable consequences. First, the price of these goods is driven down. Second, these negative price effects can lead to a significant decline in real economic activity (see for example Shleifer and Vishny 1992, Kiyotaki and Moore 1997, Krishnamurthy 2009, Lorenzoni 2008, and Shleifer and Vishny 2010 for a recent discussion). Indeed, many academics, policymakers, and regulators have emphasized these models in building an understanding of the recession of 2007 to 2009.

To the first point i say, “duh!” forced sale of any good means taking the highest offer no matter how low that offer is. Of course that pushes prices down.

To the second point, if an entire industry is geared toward the production of the asset crashing in price, it stands to reason that a significant economic decline will ensue.

These two points are not where i differ with their findings. It's when we dive into the details of causation that a disagreement arises.

Unprecedented foreclosures

In recent research (Mian et al. 2011), we examine this idea in the context of the recent rise in foreclosures in the US. We ask to what extent this has been responsible for the recent collapse in house prices and the fall in durable consumption and residential investment – important factors in determining major macroeconomic fluctuations (Leamer 2007).

The stylised facts suggest a correlation at the very least. The top left panel of Figure 1 shows that aggregate foreclosure filings in the US increased from 750,000 in 2006 to almost 2.5 million in 2009. While we do not have data on foreclosures before 2006, the mortgage default rate increased above 10% in 2009, which is more than twice as high as any year since 1991. By any standard, the recent US mortgage default and foreclosure crisis is of unprecedented historical magnitude.

This sharp rise in foreclosures has been accompanied by large drops in house prices, residential investment, and durable consumption. As the top right panel of Figure 1 shows, nominal house prices fell 35% from 2005 to 2009. The drop in residential investment from 2005 to 2009 shown in the bottom left was larger than any drop experienced in the post World War II era. The drop in durable consumption is also large, but more comparable to recent recessions.

Figure 1.

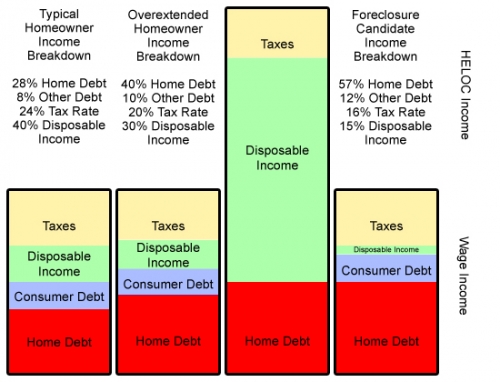
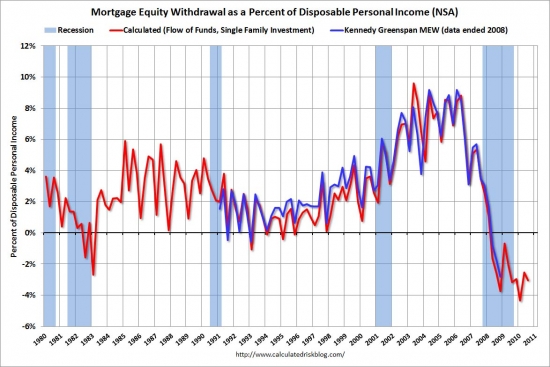
These authors don't mention the effect of HELOC abuse — because they probably don't realize how important or widespread it really was. People spending their homes is where the action was at. The lack of mortgage equity withdrawal is also why the economy is in the doldrums.

Empirical strategy

A glance at the aggregate data may lead to the conclusion that foreclosures have an obvious negative causal effect on house prices and therefore real economic activity. But isolating a causal effect of foreclosures on house prices is a significant challenge because house price declines or other negative economic shocks will lead to a rise in foreclosures. Or in other words, how do we know that foreclosures are the cause of declining house prices and economic weakness rather than an effect?

You don't because they aren't.

Our empirical strategy is designed to isolate as accurately as possible the causal effect of foreclosures on house prices and the broader economy.

No, what they are really doing is looking for correlations and hoping they find some causal link. In this instance, they picked the wrong causal factor.

We start with a micro-level data set covering the entire US from 2006 to end 2009 with information on house prices, residential investment, auto sales, mortgage delinquencies, and foreclosures. We have all of these variables at the zip code-year level, with the exception of residential investment and auto sales which are at the county-year level.

I would love to see a study on mortgage delinquency as the casual factor. Of course, with amend-extend-pretend and shadow inventory, the direct relationship which exists probably breaks down in early 2008. However, mortgage delinquency started the chain of events the caused this national catastrophe.

Our strategy to isolate the effect of foreclosures on outcomes relies on variation in foreclosures that is driven by state rules on whether a foreclosure must take place through the courts (a judicial foreclosure). In states that require a judicial foreclosure, a lender must sue a borrower in court before conducting an auction to sell the property. In states without this requirement, lenders have the right to sell the house after providing only a notice of sale to the borrower (a non-judicial foreclosure). Figure 2 maps out those states with different rules. As first highlighted in the economics literature by Pence (2006), the 21 states that require judicial foreclosure impose substantial costs and time on lenders seeking to foreclose on a house.

Figure 2.

Nice map of the judicial versus non-judicial states. It may tells us something about how long it takes a property to go through foreclosure, but it provides little else of value.

Foreclosures and house

Using this instrumental variable approach, we find that foreclosures have a substantial effect on house prices. Our state-level baseline estimate suggests that a one standard deviation increase in foreclosures in 2008 and 2009 leads house price growth to be two-thirds of a standard deviation lower over the same period.

What they have found is a correlation without direct causation.

Our estimate of the effect of foreclosures on house price growth is robust to extensive controls for demographics and income differences across states. All specifications explicitly control for the effect of mortgage delinquencies on house prices. In other words, our estimate captures the incremental price effect of foreclosures above and beyond delinquencies. In addition, the effect is robust to the use of either the Fiserv Case Shiller Weiss or Zillow.com house price indices.

I wish I were smart enough to understand how their study manages to isolate the impact of foreclosures above and beyond the delinquency that caused the foreclosure. I don't think it can be done because the causation does not exist.

We also employ a zip code-level border regression discontinuity specification that is similar to the specification that Pence (2006) uses for credit. This specification allows us to compare zip codes that are very close to each other in geographical distance and observable characteristics. Consistent with the state level correlations, there is a sharp increase in the foreclosure rate as one crosses the border from a judicial requirement state into a state with no judicial requirement. However, there is no similar jump in other observable variables as one crosses the border. Focusing only on zip codes that are very close to the border between two states that differ in judicial foreclosure requirement laws, we find similar two-stage least squares estimates of the effect of foreclosures on house prices. The similarity of the results using the zip code-level design mitigates omitted variable concerns in our other regressions.

That paragraph as loaded with some serious jargon (and bullshit). It would be interesting to see a study of judicial versus non-judicial foreclosure in a market where the substitution effect across boundaries came into play, perhaps Alexandria, Virginia versus some nearby Maryland zip codes.

Our results confirm that foreclosures have a strong negative effect on house prices that goes beyond a simple correlation.

Again, their results are wrong because they have identified the wrong causal factor.

Foreclosures, investment, and consumption

We then turn to residential investment and durable consumption. Employing a similar two stage least squares estimation strategy, we find that a one standard deviation increase in foreclosures per homeowner leads to a two-thirds of a standard deviation decrease in permits for new residential construction. Further, a one standard deviation increase in foreclosures leads to a two-thirds of a standard deviation decline in auto sales. Our estimates are robust to controls for demographics and income.

We use our microeconomic estimates to quantify the aggregate effects of foreclosure on the macroeconomy. Our estimates suggest that foreclosures were responsible for 15% to 30% of the decline in residential investment from 2007 to 2009 and 20% to 40% of the decline in auto sales over the same period.

Think about what they are saying logically. Wouldn't it make more sense that residential investment would decline when prices crashed? How are homebuilders supposed to run their businesses when the sale price of their product was in freefall? Who were they going to sell those homes to? The foreclosures didn't cause the homebuilders to pull back on new construction. A lack of sales did that.

Mortgage delinquencies and distressed sales — many of which were foreclosures — did cause prices to go down which in turn created the circumstances where builders were not incentivized to spend on residential investment. The decisions of homebuilders lowered residential investment. Foreclosures were only part of the mix that occurred in the same time period — correlation without causation.

One advantage of our study relative to the existing literature is comprehensiveness. Our analysis covers the entire US as opposed to one state or one city and we examine foreclosures all the way through the to the end of 2009. We are also the first to use state laws on judicial requirement for foreclosure to identify the effect of foreclosures on house prices – the importance of an instrument for foreclosures has been highlighted throughout the in the literature. Further, to the best of our knowledge, we are the first to examine the effect of foreclosures on real economic activity.

Foreclosures and the Great Recession

It is important to emphasise that we do not take a stand on whether foreclosures help to bring house prices, durable consumption, or residential investment closer to or further from their long-run socially efficient levels.

That is a shame. This is the main reason foreclosures are a good thing. If the market were allowed to follow its natural course, we would have seen a violent drop in prices followed by a sustained recovery. As it stands, we abbreviated the fall and now we will endure a longer and slower drop.

For example, in the absence of foreclosures, house prices may display downward rigidity given loss aversion (Genesove and Mayer 2001). Alternatively, house prices may be kept above their socially efficient level by government support.

I think we have seen plenty of government support.

Further, it is conceivable that the declines we document would occur in the long run even in the absence of foreclosures;

Yes, since mortgage delinquency is the real root cause, the foreclosures are not necessary to make prices go down. In fact, with the amend-extend-pretend policy at the banks, we have not seen near as many foreclosures as we should have given the high level of mortgage delinquency.

it is also conceivable that states where foreclosure is relatively easy will experience a faster housing recovery.

IMO, due to the extensive shadow inventory, the speed of judicial processing is not a big deal. Lenders don't want to process foreclosures quickly. They want to bury their heads in the sand.

But our estimates suggest that foreclosures lead to more abrupt declines in these outcomes than would be observed in the absence of foreclosures, and these declines are likely to be more painful in the midst of a severe recession. This is consistent with the amplification mechanisms emphasized in Kiyotaki and Moore (1997) and Krishnamurthy (2003). We believe that these results demonstrate a direct connection between a financial friction – forced sales induced by foreclosures – and a reduction in residential investment and durable consumption during and after the recession of 2007 to 2009.

Our estimates of the effect of foreclosures on residential investment and auto sales can partially explain both the magnitude and length of the recession of 2007 to 2009. For example, the sharp rise in foreclosures began relatively late in the recession and continues into 2010. If we combine this fact with the finding in Leamer (2007) that residential investment is among the most powerful components leading the US out of recession, it is possible to argue that foreclosures have likely contributed to the length of the recession and sluggishness of the recovery. Similar arguments apply to our findings on auto sales.

Leamer (2007) identifies durables as the part of consumer spending with the strongest negative affect on economic growth during recessions . Under the assumption that our results on auto sales extend to the entire durable goods share of the economy (23.6 % of GDP in 2008), foreclosures can explain the relatively sluggish growth in durables well into 2010. Given that the 2007 to 2009 recession and its aftermath have been closely related to depressed levels of durable consumption and residential investment, our results thus highlight an important role for foreclosures and house prices in understanding weakness in the economy.

Foreclosures one of the symptoms of our national mortgage debt disease. This debt needs to be reduced, and foreclosure is a superior form of principal reduction. Far from being the cause of our ills, foreclosures are essential to the economic recovery.

The fix is in

Whenever I see a property priced under market go pending in a single day, I am suspicious. Did the seller really get the highest and best price? Or did a shady listing agent steer the sale to a favored buyer in exchange for a kickback? I have no idea if anything nefarious happened with this property, but the transaction does look rather strange.

The owner of today's featured property paid $978,000 back on 6/1/2004. The owner used a $782,400 first mortgage, a $100,000 second mortgage, and a $95,600 down payment. On 9/30/2005 he opened a $176,100 HELOC. Since this HELOC matches the loss on the sale after commissions, the negotiations between the second mortgage holder and the borrower are at the forefront of this transaction.

Fast forward nearly seven years, and this house is now selling for a 15% loss. Not to worry, the owner hasn't make a payment in nearly two years, and the bank doesn't seem to be in a hurry to foreclose. Realistically, even if the deal is shady, the bank is probably better off than going through foreclosure and recovering even less.

Foreclosure Record

Recording Date: 03/23/2010

Document Type: Notice of Sale

Foreclosure Record

Recording Date: 06/24/2009

Document Type: Notice of Default

Irvine Home Address … 12 SANTA RIDA Irvine, CA 92606

Resale Home Price … $859,000

Home Purchase Price … $978,000

Home Purchase Date …. 6/1/04

Net Gain (Loss) ………. $(170,540)

Percent Change ………. -17.4%

Annual Appreciation … -1.9%

Cost of Ownership

————————————————-

$859,000 ………. Asking Price

$171,800 ………. 20% Down Conventional

5.02% …………… Mortgage Interest Rate

$687,200 ………. 30-Year Mortgage

$178,270 ………. Income Requirement

$3,697 ………. Monthly Mortgage Payment

$744 ………. Property Tax

$278 ………. Special Taxes and Levies (Mello Roos)

$143 ………. Homeowners Insurance

$50 ………. Homeowners Association Fees

============================================

$4,913 ………. Monthly Cash Outlays

-$905 ………. Tax Savings (% of Interest and Property Tax)

-$823 ………. Equity Hidden in Payment

$336 ………. Lost Income to Down Payment (net of taxes)

$107 ………. Maintenance and Replacement Reserves

============================================

$3,629 ………. Monthly Cost of Ownership

Cash Acquisition Demands

——————————————————————————

$8,590 ………. Furnishing and Move In @1%

$8,590 ………. Closing Costs @1%

$6,872 ………… Interest Points @1% of Loan

$171,800 ………. Down Payment

============================================

$195,852 ………. Total Cash Costs

$55,600 ………… Emergency Cash Reserves

============================================

$251,452 ………. Total Savings Needed

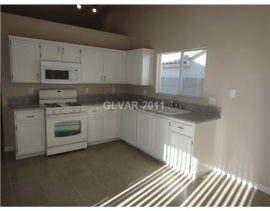
Property Details for 12 SANTA RIDA Irvine, CA 92606

——————————————————————————

Beds: 4

Baths: 3

Sq. Ft.: 2535

$339/SF

Lot Size: 5,504 Sq. Ft.

Property Type: Residential, Single Family

Style: Two Level, Other

Year Built: 1997

Community: Westpark

County: Orange

MLS#: S646668

Source: SoCalMLS

Status: Backup Offers Accepted

On Redfin: 12 days

—————————————————————————–

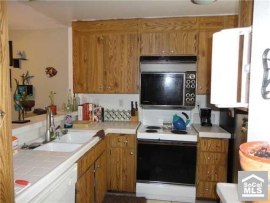
Great Corner Lot location and bright Single Family Residence. First floor bedroom. 3 Car Garage with long drive way. Walking distance to schools and shopping centers. Close to I-405, I-5, John Wayne Airport, Irvine Spectrum and South Coast Plaza.

realtors and mortgage brokers left homeless while housing market molders

Workers in the real estate industrial complex are succumbing to the difficult market environment. Those who aren't squatting are often left homeless with their renting brethren.

Irvine Home Address … 162 PINEVIEW Irvine, CA 92620

Resale Home Price …… $189,900

Yes, how many times can a man turn his head

Pretending he just doesn't see?

The answer my friend is blowin' in the wind

The answer is blowin' in the wind.

Bob Dylan — Blowin' In The Wind

Have you thought about what you would do if you became unemployed? Has that nagging question been draining your energy throughout the recession? Sometimes the consequences are as a bad as you imagine.

Homeless ex-mortgage broker Susan Schneider shows housing bust hit agents hard

Annie Gowen, Washington Post Staff Writer, Saturday, February 19, 2011; 9:15 PM

Before the real estate bust, Rob Paxton and Susan Schneider might have met at a networking event or through their home-buyer clients. Instead, they first crossed paths at a day shelter for the homeless in Falls Church.

Schneider, once a mortgage broker with plenty of disposable income, arrived one cold winter morning with her possessions in tow, looking for a hot meal.

In the kitchen, Paxton stirred a bubbling pot on the stove. He once pulled in more than $200,000 a year in Northern Virginia, but he had taken the part-time job as the shelter's director when his commissions dwindled to almost nothing.

Paxton, 55, noticed Schneider right away. Wearing a knit cap and a slightly dazed expression, hers was one of the few female faces in a sea of mostly Latino men awaiting the noon meal. He said hello, and soon they'd swapped stories.

“We have a lot of common ground,” Paxton says. “Same business: trying to get people into homes.”

The carnage among people who try to make a living from real estate related professions has been remarkable. As I noted yesterday, OC homebuilding is 62% off its historic norms. With demand for new homes is less than half of what it normally is, less than half the money that normally flows into real estate is available to support the industry.

Now it is Schneider who needs a home. And over the past six weeks, Paxton has tried to help her – shepherding her to different shelters to find an open bed, giving her food and calmly taking her calls when her perilous situation frays her emotions past the breaking point.

Although Schneider, 43, is grateful for the help, their alliance is shaky at times. She doesn't hide her bitterness that the man trying to help her – a colleague, really – still has his charming gray-and-white colonial in Fairfax Station, while she lost it all.

“Don't get me wrong – Rob is a nice guy,” she says. “But you really have to live it to know what it's like.”

I wonder if the colleague is making his mortgage payment or if he is struggling with little or no income and squatting in his McMansion?

… She used to love to cook, back when she had an apartment in Alexandria, a new Honda Accord and her own mortgage business. She wasn't rich, but she was comfortable, able to afford dinners out – grilled salmon and a nice pinot grigio – and $100 salon treatments for her hair. In her spare time, she organized community bike rides along the George Washington Parkway.

She'd worked in the mortgage business in Northern Virginia since 1998. Then, in 2005, searching for a change of scenery, she moved to Texas and took a job as a loan officer at Countrywide Financial, the home-loan behemoth now owned by Bank of America, whose lax lending practices made it the poster child of boom excess.

She was named a top rookie – and has the little plastic paperweight to prove it – but began to feel claustrophobic in her cubicle as she and her fellow loan officers were driven to make more and ever riskier loans.

“It was a sweatshop,” she says. “People were refinancing just to save one monthly payment – or $10 a month.”

She left Countrywide in 2006 and ended up back in Northern Virginia, launching her own mortgage business, Mortgage Made Simple, just as the real estate market here began to tank.

She recognized borrowers were not benefitting from the sweatshop work, but she participated eagerly for the financial rewards. Apparently the morality of what she was facilitating was not an issue. In her mind, she was living the American dream until 2006. Too bad it was an illusion projected by a Ponzi scheme.

In the ensuing months, she tried everything she could to keep the business afloat, even delving into the murky subprime mortgage market and doling out loans to customers with bad credit and insufficient incomes. She thinks many of those customers have likely lost those homes by now. Then, in 2008, she was evicted.

“I lost everything, and I [didn't] have anywhere to go,” she says. “I was depressed, angry – all these emotions. . . . Who wouldn't be?”

At first, she slept on the office floor of another mortgage broker who eventually kicked her out. Then – like the homeless character Will Smith played in “The Pursuit of Happyness” – she spent a week holed up in a bathroom of a hotel in Alexandria. She lived on a friend's boat, then at a campsite in Lake Fairfax Park, surviving on a string of low-wage jobs. She waitressed, washed towels at a gym and now waves signs outside a Liberty Tax office in a Statue of Liberty costume.

By December, though, she hit what she calls “rock bottom.” The cold weather drove her inside to hypothermia shelters in local churches at night – and to Safe Haven.

In their shoes

Paxton became the shelter's director in July, the latest in a string of part-time jobs – including a county position teaching financial education to low-income residents – to supplement his Realtor's income, which took a big hit in the down market.

“It's not a matter of working harder – the business just wasn't there,” says Paxton, who grew up in Arlington County. He and his wife, Mary, an IT manager for Fairfax County, have three daughters and face mounting college tuition expenses. One daughter is a student at Clemson, another is applying to some private institutions.

Although Paxton took the job as a way to pay his bills, he has thrown himself into the work with increasing zeal. He went dumpster diving with one Safe Haven regular to observe how it was done. He posed as a homeless man to check out the food at a nearby church.

Now that the real estate market is recovering, Paxton sometimes goes from a million-dollar listing for Long & Foster to tying an apron around his pressed chinos and Ralph Lauren sweater to serve in the chow line.

Colleagues and family members say he has always had a humanitarian streak, but he's developed a much greater sense of empathy for people in Schneider's situation.

One frigid evening, he took her to three shelters to find a place where she could sleep that night, waiting with her in a long line in the cold.

“That was my first taste of, 'Wow, that's what it's really like,' ” he says.

But his efforts to help Schneider have not always gone smoothly.

Although she admits to being depressed and angry since she lost her home, she does not want to seek counseling or other support. One volunteer's efforts to get her a spare room with an older woman went nowhere. She says she has a strained relationship with her relatives, who live overseas and are unaware of her plight.

“Everybody loves happy endings,” Paxton says. “With Susan, it may be a happy ending. I don't know at this point. I'm having my doubts, but I'm hopeful.”

A former life

Schneider says her game plan is simple: “Get a better job and get out of this mess.” She knows it won't be easy.

After lunch, she goes over to a storage facility in Alexandria where she has been keeping her remaining possessions. She tries to swipe her access card, but it fails. A clerk behind the counter delivers the bad news: She needs to pay $360 by March 11 or the contents of the locker will be sold.

Eventually, she is allowed upstairs to retrieve personal papers from the locker. Inside is the detritus of her formerly middle-class life – kitchenware, a black Wilsons leather jacket, the gold dancing shoes she used to wear to Glen Echo Park, outdoor gear and her beloved bike – a pricey Roubaix that she bought when she was flush.

“Somebody is going to get some really good stuff,” she said, her voice cracking.

She barely blinks when she replaces the lock on door, but once outside, she sighs heavily.

“I miss my bike,” she says, like it's already gone.

It's easy to make fun of some of the losers who where flushed out of the system in the crash of the Great Housing Bubble, particularly the Ponizis who carried on foolishly as if the good times were going to last forever. However, there comes a point when the crisis has dragged on long enough that good people get punished — people who did not participate in the excesses of the bubble. It's hard to say if the people in today's story are good or bad or worthy of compassion or ridicule. This woman's story was sympathetic. Though some may consider her response degrading, I think her spirit of self-reliance is noble. I would dress up in a ridiculous costume to support myself and my family. I'm thankful I don't have to.

I still giggle about some of the other characters in real estate who are getting what they deserve

Total loss on a 2004 investment

The owner of today's featured property paid $290,000 on 11/22/2004. He used a $203,000 first mortgage, a $58,000 second mortgage, and a $29,000 down payment.

You have to imagine when he bought the place he figured that California real estate went up 7% to 10% per year every year, so if he held this property for 6 years, he should be selling it for between $420,000 and $520,000 depending on the appreciation rate. He probably figured the $420,000 was conservative.

The reality is he is now selling this property for $190,000. He has lost his down payment, the second mortgage holder is looking for money, and the first mortgage holder is wondering how they will be made whole.

This is one Irvine investor who didn't acheive his financial projections.

Irvine Home Address … 162 PINEVIEW Irvine, CA 92620

Resale Home Price … $189,900

Home Purchase Price … $290,000

Home Purchase Date …. 11/22/2004

Net Gain (Loss) ………. $(111,494)

Percent Change ………. -38.4%

Annual Appreciation … -6.7%

Cost of Ownership

————————————————-

$189,900 ………. Asking Price

$6,647 ………. 3.5% Down FHA Financing

5.02% …………… Mortgage Interest Rate

$183,254 ………. 30-Year Mortgage

$39,410 ………. Income Requirement

$0,986 ………. Monthly Mortgage Payment

$165 ………. Property Tax

$0 ………. Special Taxes and Levies (Mello Roos)

$32 ………. Homeowners Insurance

$295 ………. Homeowners Association Fees

============================================

$1,477 ………. Monthly Cash Outlays

-$93 ………. Tax Savings (% of Interest and Property Tax)

-$219 ………. Equity Hidden in Payment

$13 ………. Lost Income to Down Payment (net of taxes)

$24 ………. Maintenance and Replacement Reserves

============================================

$1,201 ………. Monthly Cost of Ownership

Cash Acquisition Demands

——————————————————————————

$1,899 ………. Furnishing and Move In @1%

$1,899 ………. Closing Costs @1%

$1,833 ………… Interest Points @1% of Loan

$6,647 ………. Down Payment

============================================

$12,277 ………. Total Cash Costs

$18,400 ………… Emergency Cash Reserves

============================================

$30,677 ………. Total Savings Needed

Property Details for 162 PINEVIEW Irvine, CA 92620

——————————————————————————

Beds: 1

Baths: 1

Sq. Ft.: 932

$204/SF

Lot Size: 763 Sq. Ft.

Property Type: Residential, Condominium

Style: Two Level, Other

Year Built: 1977

Community: Northwood

County: Orange

MLS#: P764582Source: SoCalMLS

Status: Active This listing is for sale and the sellers are accepting offers.

On Redfin: 41 days

——————————————————————————

Cozy townhouse features 1BD+Loft & 1BR. Large livingroom, comfortable dining area, roomy bedroom with walk in closet. Great location in complex, back to the lake, beautiful view, a short walk to pool area. Short Sale done by experienced Realtor.

Irvine Company opens two new developments with 2,600 houses

The Irvine company sold less than 100 homes per month in 2010, but they are opening two new developments in 2011, the Villages of Stonegate and Laguna Altura.

North Korea at Night Marquee at Park Place at Night

Irvine Home Address … 3131 MICHELSON #405 Irvine, CA 92612

Resale Home Price …… $300,000

And I wanna believe you,

When you tell me that it'll be ok,

yeah I try to believe you,

But I don't

Avril Lavigne — Tomorrow

I don't talk about what the Irvine Company does much, mostly because they spend so much money putting out the word that my coverage isn't necessary or important. Plus, everything they write is marinated with cool aid, and reading hype gets old quickly. I try to believe them, but i don't. However, since everyone is interested in what the behemoth is up to, I thought I should report on their latest activities.

Irvine Co. reports sale of 1,200 homes

February 17th, 2011, 5:47 pm — posted by Jeff Collins

Just over a year ago, the Irvine Co. tested the waters with a tentative homebuilding project in its Woodbury developments, setting a modest goal of selling 700 units in two years.

But demand for the homes — featuring revamped designs for homes in the highly rated Irvine school district — went wildly beyond the company’s expectations.

This week, the Irvine Co. reported that it has signed 1,234 buyers since the debut of the 2010 New Home Collection 13 months ago. That includes units both in the original seven-project New Home Collection and in an additional five programs in Woodbury and nearby Stonegate East that were added later.

“Although the housing market may not have turned nationally, it has unquestionably returned in Irvine,” said Dan Young, president of Irvine Co. Community Development, the Irvine Co.’s homebuilding arm.

Studying historical trends, Irvine Co. officials determined that the “inventory” of homes for sale had hit a low, meaning that Irvine was poised for a rebound. But they were careful from the start to say that conclusion didn’t necessarily apply to other parts of the housing market.

About 10,000 people turned out for the project’s grand opening in January 2010, with homes selling more than twice as fast as originally expected.

Fortunately, they set low expectations.

“The incredible sales and rising prices at Woodbury in Irvine were the national new home story of the year,” Irvine-based housing consultant John Burns told the Register.

Consultant Mark Boud of Real Estate Economics, quoted in an Irvine Co. news release, agreed:

“In terms of price and absorption, the Irvine Co. introduced the most successful new home developments in the United States last year. Access to major employment, shopping and service centers … and access to some of the highest quality schools in California draw a wide market audience.”

Mark must have signed a big new contract.

596 new homes coming to Laguna Canyon Road

February 20th, 2011, 1:00 am by Jeff Collins

The Irvine Co. has broken ground on the first of 596 homes it plans to build in a gated housing development on hillsides overlooking Laguna Canyon Road, the company has announced.

The sales office and model homes for the new Laguna Altura project — formerly called Laguna Crossing — are scheduled to open on May 14, said Dan Young, the Irvine Co.’s homebuilding chief.

Along with Stonegate in north Irvine, Laguna Altura is part of the developer’s 1,250-home “Irvine Pacific Collection.”

Unlike the majority of Irvine Co. homes built last year, this latest initiative will be built entirely by the Irvine Co.’s revived homebuilding brand, Irvine Pacific Homes.

The project will consist entirely of single-family homes, with prices ranging from the low $600,000s to more than $1 million. The development includes:

  • Siena: Homes from 1,618 to 1,788 square feet, with prices starting in the low $600,000s.
  • San Remo: Homes from 1,881 to 2,094 square feet, with prices starting in the low $700,000s.
  • Cortona: Homes from 2,380 to 2,962 square feet, with prices starting in the low $900,000s.
  • Toscana: Homes from 2,806 to 3,133 square feet, with prices starting at more than $1 million.

Young said that all the homes in the Irvine Pacific Collection have new designs that incorporate innovations used in the 2010 models, such as replacing formal dining rooms with “great rooms,” and providing plenty of storage for items purchased from big-box stores like Costco or Wal-Mart.

However, four of the projects — San Mateo and San Marcos in Stonegate, and Siena and San Remo in Laguna Altura — are detached versions of attached homes that the Irvine Co. is building in a separate ongoing development called Stonegate East.

“People loved them, but said they would be willing to pay more if they were detached,” Young said.

As with the new Stonegate development, buyers will be able to pick out options for their home such as carpeting, cabinets and countertops at a new design center in Woodbury. And lenders will be embedded from Wells Fargo and Bank of America to help buyers apply for loans if they choose.

Irvine Co. plans to build 2,600 new homes

The real estate firm is opening two new developments in the spring.

By Kristen Schott — Published: February 18, 2011 11:03 AM

The Irvine Co. is moving forward with plans for two new developments that, when complete, will boast nearly 2,600 properties and could create some 8,000 jobs. Stonegate in north Irvine and Laguna Altura, off Laguna Canyon Road, are being developed by the company's Irvine Pacific affiliate and are touted as the two largest villages to come to O.C. since Portola Springs opened in July 2006.

The project capitalizes on the success the Irvine Co. has seen in recent months; the firm's New Home Collection has sold 1,234 homes since it debuted in January of last year – landing it among the most successful developments in the U.S. in 2010, in terms of price and absorption, said Mark Boud, principal of Real Estate Economics.

“Access to major employment, shopping and service centers, combined with outstanding community design and recreational amenities, and access to some of the highest quality schools in California draw a wide market audience,” said Boud. “The Villages of Irvine are ideally situated to take advantage of strong new-home demand and little competitive supply in Central Orange County.”

Part of the Irvine Pacific Collection, the Village of Stonegate is located on Irvine Boulevard between Sand Canyon and Jeffrey Road. The project will feature 2,000 homes in four neighborhoods – Santa Clara, San Mateo, San Marcos and Maricopa. Prices will range from the mid-$300,000s to the high-$700,000s. Laguna Altura will feature 596 homes in four communities – Siena, San Remo, Cortona and Toscana. These residences will start in the low-$600,000s up to the low-$1 millions.

“The Irvine Pacific Collection provides homebuyers with an array of new-home opportunities, whether they are looking to purchase their first home or take advantage of the opportunity to move up to a larger residence,” said Daniel Young, president of Irvine Co. Community Development.

Much like the New Home Collection, Stonegate and Laguna Altura will feature designs aimed at representing a “'way of life' that is uniquely attuned to the hopes, dreams, needs and goals of today's homebuyer in Irvine,” he said.

The properties, which include a mix of townhomes and single-family residences, will include designs such as a large central area – known as the Great Room – that blends the family and dining rooms and opens to the kitchen, as well as an indoor-outdoor space dubbed the California Room. In addition, the homes will be designed and built with materials, appliances and energy systems that exceed California building requirements, according to the Irvine Co.

“The Villages of Stonegate and Laguna Altura are just the latest examples of the bold leadership demonstrated by the Irvine Co.,” said Lucy Dunn, president and CEO of the Orange County Business Council. “Last year they truly implemented their own ‘local stimulus package’ and literally jump-started our construction economy by bringing much-needed jobs to our county. Their leadership and unprecedented success convinced other developers to get off the sidelines and restart construction in our county and that means more jobs too. The Irvine Co. ignored the naysayers a year ago, and the results have been simply astounding.”

O.C. homebuilding to run 62% below average

February 18th, 2011, 10:58 am — posted by Jon Lansner

The latest economic outlook from Los Angeles Economic Development Corp. sees Orange County homebuilding rising 13% this year to 3,600 units — then notes the building uptick is “still a very low number.”

SOCAL HOUSING PERMITS
Year LA OC Inland Empire Ventura SoCal
1990 25,045 11,979 28,840 2,612 68,476
1991 16,195 6,569 16,191 2,194 41,149
1992 11,907 5,943 15,444 1,720 35,014
1993 7,259 6,410 13,151 1,372 28,192
1994 7,621 12,544 13,016 2,464 35,645
1995 8,405 8,300 10,899 2,166 29,770
1996 8,607 10,207 12,513 2,353 33,680
1997 10,424 12,251 15,377 2,316 40,368
1998 11,692 10,101 18,606 3,182 43,581
1999 14,383 12,348 21,651 4,442 52,824
2000 17,071 12,367 21,990 3,971 55,399
2001 18,253 8,646 27,541 3,446 57,886
2002 19,364 12,020 33,280 2,507 67,171
2003 21,313 9,311 43,001 3,635 77,260
2004 26,935 9,322 52,696 2,603 91,556
2005 25,647 7,206 50,818 4,516 88,187
2006 26,348 8,371 39,083 2,461 76,263
2007 20,363 7,072 20,457 1,847 49,739
1990-2007 average 16,491 9,498 25,253 2,767 55,528
2008 13,704 3,159 9,101 842 26,806
2009 5,653 2,200 6,685 404 14,942
2010 estimate 7,465 3,180 6,269 592 17,506
2011 forecast 8,490 3,600 6,900 660 19,650
2011 outlook vs. ’90-07 average -49% -62% -73% -76% -65%
2012 forecast 13,055 5,600 11,025 1,000 30,680

How low? As you can see in the chart at right, that 2011 estimate for Orange County residential building permits to be filed by local developers may run 62% below the 1990-2007 average pace of Orange County home construction! (We’re not alone. If LAEDC is correct with its outlook, the 5-county SoCal region’s housing construction will run 65% below average this year.)

As part of the real estate and homebuilding industry, I am thrilled that the Irvine Company is building homes. However, as I have stated on many occasions, the shills who trumpet the blistering sales rates are talking nonsense. We are emerging of historic lows, and the year-over-year percentage increases sound great, but building 62% less homes in 2011 than we have on average for the last 30 years is hardly a runaway bull rally or a new construction boom.

At least the Irvine Company didn't embrace the mid-rise residential tower idea. That product isn't living up to its expectations.

North Korea Towers

Prices in the North Korea Towers are in the bottoming process. Clearing prices are generally in the $300,000s.

Closest homes similar to 3131 MICHELSON #405, which sold within the past six months:

As you will see with today's featured property, the cost of financing and the price itself has finally dropped enough to put these units at rental parity. Of course, prices would need to drop another 30% to entice a cashflow investor. As it stands, these units are being purchased by cash investors who are speculating these prices will rise in the future. I think the investment is foolish.

These units used to have a $1,100 per month HOA, almost nobody in these buildings are paying their mortgages or their HOA dues. The HOA is likely severely underfunded and facing future assessments. I could be wrong, but I would need to see detailed financials on the HOA before considering buying here.

These units never made any sense. This is not a walkable area. You won't walk out your front door and frolic about the neighborhood. These towers have nothing to attract an urbanite.

Did you see that last property that sold for $285,900? Ouch!

Irvine Home Address … 3131 MICHELSON #405 Irvine, CA 92612

Resale Home Price … $300,000

Home Purchase Price … $685,500

Home Purchase Date …. 1/19/2006

Net Gain (Loss) ………. $(403,500)

Percent Change ………. -58.9%

Annual Appreciation … -15.4%

Cost of Ownership

————————————————-

$300,000 ………. Asking Price

$10,500 ………. 3.5% Down FHA Financing

5.02% …………… Mortgage Interest Rate

$289,500 ………. 30-Year Mortgage

$62,259 ………. Income Requirement

$1,558 ………. Monthly Mortgage Payment

$260 ………. Property Tax

$0 ………. Special Taxes and Levies (Mello Roos)

$50 ………. Homeowners Insurance

$860 ………. Homeowners Association Fees

============================================

$2,728 ………. Monthly Cash Outlays

-$147 ………. Tax Savings (% of Interest and Property Tax)

-$347 ………. Equity Hidden in Payment

$21 ………. Lost Income to Down Payment (net of taxes)

$38 ………. Maintenance and Replacement Reserves

============================================

$2,292 ………. Monthly Cost of Ownership

Cash Acquisition Demands

——————————————————————————

$3,000 ………. Furnishing and Move In @1%

$3,000 ………. Closing Costs @1%

$2,895 ………… Interest Points @1% of Loan

$10,500 ………. Down Payment

============================================

$19,395 ………. Total Cash Costs

$35,100 ………… Emergency Cash Reserves

============================================

$54,495 ………. Total Savings Needed

Property Details for 3131 MICHELSON #405 Irvine, CA 92612

——————————————————————————

Beds: 2

Baths: 2

Sq. Ft.: 1367

$219/SF

Property Type: Residential, Condominium

Style: One Level, Contemporary, Modern, High or Mid-Rise Condo

View: Faces West

Year Built: 2006

Community: Airport Area

County: Orange

MLS#: S609111

Source: SoCalMLS

Status: Backup Offers Accepted

On Redfin: 344 days

——————————————————————————

Best Value Available at the Marquee! Adorable condo on the 2nd residence level with garden views. Located in Park Place Center with loads of great restaurants, coffee shops, market and easy access to the 405 freeway. This condo doesn't have a view, but is located in the West tower away from the freeway. This condo has finest in modern appointments including wall-to-wall floor to ceiling windows, hardwood floors, granite counters, european cabinetry, travertine tile, built in closets, stainless steel appliances & more. This is a great value and one of the lowest prices in this community.

Cash buyers are saving the Las Vegas housing market

Cash buyers are stabilizing the Las Vegas housing market. Whether they are saving it or exploiting it depends on your point of view.

Home Address … 622 WOOD ROSE CT, HENDERSON, 89015

Resale Home Price …… $124,900

if the illusion is real

let them give you a ride

if they got thunder appeal

let them be on your side

The Cars — Let the Good Times Roll

The bottom of the cycle is always dominated by cash buyers. Cash is king. Cash buyers stabilize a market when lenders are unwilling to loan. The cost of cash is higher than the cost of debt, so prices must fall to attract cash investors. As today's featured property shows, if you lower prices to the mid 90s levels, cash buyers are enticed to the strong cashflow and potential for appreciation when the market reverts back to the mean.

Cash Buyers Now Rule Vegas Housing Market

Foreclosures, Short Sales Account For Most Transactions

POSTED: 1:34 pm PST February 8, 2011

UPDATED: 12:04 am PST February 9, 2011

LAS VEGAS — Thanks to tighter lending standards, coupled with a massive inventory of foreclosures and short sales, the majority of homes sold in southern Nevada are being purchased with cash, according to the Greater Las Vegas Association of Realtors.

The agency reported that 51 percent of transactions involved cash buyers in January, as investors sought to take advantage of low prices.

“It's a combination of things,” corporate broker Forrest Barbee said. “We've got a lot of foreign investors. Foreign investors can't get loans. Canadian investors, Asian investors. A lot of cash coming in from there.”

Barbee contends that even though half of the homes being sold are to investors, it's a good thing.

“These are real investors putting good tenants in properties,” Barbee said. “They're also putting money in the property and spending money on appliances, drywall, paint or whatever.”

I know i am doing my part to employ construction workers and buy housing related products.

According to the GLVAR, the median price of a single-family house sold last month was $125,000, down 5.3 percent from $132,000 in December. The average listed price was $157,081. The median price of condominiums that sold last month was $64,900, up 4.7 percent from the month before.

The total number of homes sold dropped 19.7 percent in January. Last month 3,214 houses were sold, down from 4,007 in December.

Bank-owned homes continued to dominate sales, representing 48.8 percent of transactions, while 26.6 percent were short sales, the GLVAR said.

Lenders control 75% of the transactions in Las Vegas, and they indirectly control most of the other 25% as most of the equity sales are flippers like me who got their property at an auction called by a lender.

While both figures are proof that families still struggle to pay their mortgages, the agency claimed the increase in cash buyers is a positive sign.

“Cash buyers are still purchasing thousands of local homes that might otherwise sit vacant,” said GLVAR President Paul Bell.

A house with no occupant is a completely wasting asset. It produces no benefit and deteriorates with disuse.

But some homeowners disagree, saying that their neighborhoods are becoming more transient.

Dawn Lane, owner of the Professional Realty Group, said people who want to buy a home in Las Vegas to live in are getting priced out of the market.

“They have an opportunity to buy a home and when they go to put an offer in, you've got investors purchasing the home for cash,” Lane said. “What's a better deal for the bank? Let's take the cash and run.”

And although Lane said it's great homes are being sold, the investors could end up hurting Las Vegas in the end.

“If we're trying to build neighborhoods up again, don't we want solid families or people invested in our community who wants an opportunity to live in Las Vegas and grow?”

But Barbee, the broker, said homeowners can still buy a home through restricted government programs.

And for your amusement…

Poll: Do You Plan To Buy A Home In The Next Year?

A property purchased by a cash investor

Below is a property purchased by a cash investor in Henderson just southeast of Las Vegas. As you can see, it is selling for just over its 1996 purchase price. If houses double in price every 15-20 years, this property should be selling for $180,000 to $200,000. That's how far these properties have overshot to the downside.

Home Address … 622 WOOD ROSE CT, HENDERSON, 89015

Resale Home Price … $124,900

Home Purchase Price … $110,000

Home Purchase Date …. 7/9/1996

Net Gain (Loss) ………. $7,406

Percent Change ………. 6.7%

Annual Appreciation … 0.9%

Cost of Ownership

————————————————-

$121,900 ………. Asking Price

$4,267 ………. 3.5% Down FHA Financing

5.00% …………… Mortgage Interest Rate

$117,634 ………. 30-Year Mortgage

$25,241 ………. Income Requirement

$631 ………. Monthly Mortgage Payment

$106 ………. Property Tax

$10 ………. Homeowners Insurance

$280 ………. Homeowners Association Fees

============================================

$1,027 ………. Monthly Cash Outlays

-$60 ………. Tax Savings (% of Interest and Property Tax)

-$141 ………. Equity Hidden in Payment

$8 ………. Lost Income to Down Payment (net of taxes)

$15 ………. Maintenance and Replacement Reserves

============================================

$850 ………. Monthly Cost of Ownership

Cash Acquisition Demands

——————————————————————————

$1,219 ………. Furnishing and Move In @1%

$1,219 ………. Closing Costs @1%

$1,176 ………… Interest Points @1% of Loan

$4,267 ………. Down Payment

============================================

$7,881 ………. Total Cash Costs

$13,000 ………… Emergency Cash Reserves

============================================

$20,881 ………. Total Savings Needed

Property Details for 622 WOOD ROSE CT, HENDERSON, 89015

——————————————————————————

Beds: 3

Baths: 2 F

Home size: 1299

Lot Size: 00.13

Year Built: 1996

——————————————————————————

MOVE IN READY – NOT a Short Sale or REO! Seller responds quickly. Newly rehabbed 1-Story home with 3 bedrooms and 2 bathrooms. Kitchen has white cabinets with a breakfast nook. Back-yard is fully landscaped with desert landscaping. Home is not far from schools, shopping and freeway access.

This property was a complete cosmetic do over. We replaced or repainted everything in this house. Unfortunately, we don't have any of the before pictures. It was a mess.

Jacki has been working on her artistic architectural photography. This master bath shot turned out well.

Rental property investment performance

Asking Price $118,900
All Cash Purchase Financial Analysis
Net Income $7,185
Capitalization Rate = Net Income / Total Cost 6.0%
Mortgage Purchase Financial Analysis 15-Year 30-Year
Mortgage Interest Rate 4.3% 5.0%
Actual Monthly Cashflow $0 $88
Cashflow after Financing $3,774 $3,486
Initial Capital Investment (down payment) $39,577 $23,780
Cash-On-Cash Return = Cashflow / Investment 9.5% 14.7%

Rental Income Terms Calculations
Gross Rent $1,150
Vacancy and Collection Loss 5.0% $58
Monthly Rental Income $1,093
Operating Expenses Terms Calculations
Property Tax 2.67% $264
Homeowners Insurance 0.50% $50
Maintenance and Replacement Reserves 0.50% $50
Homeowners Association Fees $15 $15
Property Management Fees (% of Gross Rent) 10.0% $115
Monthly Cash Expenses $494
Net Operating Income $599
Monthly Payment (based on maximum loan) $511
Actual Monthly Cashflow (assuming impounds) $88
Interest Expense $396
Total P&L After Expenses and Debt (loan amortization plus excess) $202
Financing Terms Calculations
Comparable Value Full Asking Price (buy it now) $118,900
Maximum Allowable Loan (with available terms) 80.0% $95,120
Maximum Cashflow-Positive Loan (30-year amort.) 93.8% $111,534
Maximum Loan (lesser of two limits) $95,120
Investor Capital (remaining after cash-out loan) $23,780
Comparable Resales Resale Date Amount
910 DODEE CT — 3 bed 3 bath 1623 SF — 1996 List: $122000 8/9/10 $126,000
628 HOLLY BUSH CT — 3 bed 2 bath 1540 SF — 1997 List: $119900 7/1/10 $115,000
882 COZY VALLEY ST — 3 bed 2 bath 1389 SF — 1997 List: $105000 5/6/10 $105,000
884 COZY VALLEY ST — 3 bed 2 bath 1299 SF — 1997 List: $124900 8/31/10 $123,000
620 E WOOD ROSE CT — 3 bed 2 bath 1299 SF — 1996 List: $109000 4/27/10 $109,000
Lease Date Amount
501 GARDENIA BLOSSOM ST — 2 bed 3 bath 1179 SF — 1997 List: $1050 10/21/10 $1,050
500 FRAGRANT ORCHARD ST — 2 bed 3 bath 1179 SF — 1997 List: $1000 9/3/10 $1,000
593 FOX CHASE ST — 3 bed 2 bath 1547 SF — 1998 List: $1250 10/6/10 $1,250
969 MEDINA DE LEON AV — 3 bed 3 bath 1485 SF — 2005 List: $1150 10/21/10 $1,150
643 BONSAI TREE LN — 3 bed 2 bath 1303 SF — 1998 List: $1195 10/5/10 $1,195
1036 STEPPE EAGLE AV — 3 bed 3 bath 1370 SF — 2003 List: $1099 7/19/10 $1,099
531 SCENIC TERRA DR — 3 bed 2 bath 1425 SF — 1997 List: $995 7/16/10 $995

If you are interested in this property contact nancylicata@ppglasvegas.com or Jackie@ffglasvegas.com.

Beyond personal greed, house price inflation is bad

Houses are the one commodity everyone wants to go up in price. Far from being a benefit, house price inflation is a drag on economic growth.

Irvine Home Address … 14 CARTIER AISLE Irvine, CA 92620

Resale Home Price …… $350,000

In every possible way.

And oh, my dreams, it's never quite as it seems,

Never quite as it seems.

Cranberries — Dreams

For readers of this blog, the editorial that follows will not cover new ground. For the wider readership in California, what follows is pure sacrilege.

Bursting our bubble

Why do we continue to think that rising home prices are a good thing?

By Michael Kinsley — February 15, 2011

If President Obama could ask for one gift from the economy — one statistic that turns unexpectedly rosy — what would it be? If Americans in general could choose one change in their financial situation, what would they choose?

I suppose Obama would choose a decline in the unemployment rate. But a close second for Obama, and quite possibly first on the list of other Americans, would be a rebound in house prices. Although we all recognize now that real estate was a classic bubble, bubbles are wonderful fun. It's the burst that hurts. In the good old days — before 2007 — following the prices for which houses in your neighborhood were selling and then recalculating your own net worth was a national sport. Even the experts who correctly predicted a price decline or collapse generally delivered that prediction as bad news.

The first eighteen months of writing for this blog, I needed to do it anonymously for fear of repercussion for delivering my good news that house prices were going to go down.

The assumption is that ever-rising house prices are good, and that a decline in house prices is bad. Ordinarily we cheer when the price of an essential (product goes down, and complain when it goes up. Take oil, for example. We like it when the price of gasoline goes down and are unhappy when it goes up. But with homeownership, it's the other way around.

I wouldn't attempt to argue that the current mess of the real estate market — the irresponsible lending, the home loans underwater, the brutal foreclosures, the ramification for the economy in general — add up to a good thing. But before we start dreaming of a return to the days when ever-rising real estate prices were considered a constitutional right, let's think this through a bit. Why do we want home prices to go up?

I remember when I first started writing for the blog, some of the bulls accused me of talking down the market so i could profit from its demise. When I replied that I wanted prices to go down and stay down because it's better to spend less on housing, people responded to me as if I were insane.

The simple fact is people want higher house prices because they want the financial gain of owning an appreciating asset. Nothing more.

In very general terms (with plenty of exceptions and variations) the housing market affects three different groups. There are those trying to break in — generally young people searching for their first home. There are those in the middle, who want to trade up from a smaller house to a bigger one. And there are longtime homeowners, “empty nesters” who are approaching or already enjoying retirement and want to downsize or get out of the market completely.

How are each of these groups affected by rising house prices? The first group surely doesn't benefit. During the big housing bubble, stories about young couples watching helplessly as the American dream of homeownership passed out of their reach were a newspaper staple. As prices come down, more people can afford to buy a house. That's a good thing, isn't it?

I used to be surprised at how affordable housing advocates went silent when house prices started to go down. They should have been cheering, but I wonder if the loss of their cause or their livelihood prompted them to think high house prices aren't so bad after all. It does create a need for affordable housing advocates.

Then there are the people who want to trade one house for another. Mostly they are hoping to trade up — to a larger house for an expanding family, or a nicer neighborhood. These people are in the same situation as the first-time buyers. Obviously all house prices don't go up and down in unison. They are affected by neighborhood, by region of the country, and by changing fashions and tastes in home design. But on average the house you want to buy should have gone up or down in price by something like the same percentage as the house you want to sell. And if you're trading up, that means rising prices should hurt you just as they hurt the first-time home buyer.

The move up market is an illusion. Unless a homeowner gets a raise, saves prodigiously, or obtains a non-real estate windfall, there isn't any opportunity to move up. Gaining $100,000 in appreciation doesn't get a homeowner any closer to buying the move-up house that also went up $100,000 or more in value.

The only people who clearly benefit from rising home prices are those who are selling their last house or downsizing. This is the same group that benefited most from the previous run-up in prices — that is, typically, older people who have lived in the same house for years. Most of these people enjoyed the enormous past run-up in prices. In 1970, the median price of a house was $25,000. In 2006, at the top of the bubble, it was about $240,000. Even adjusted for inflation, that means home prices more than doubled during the period.

Do We Owe Baby Boomers Their Imagined Home Equity for Retirement? They seem to think so.

These homeowners are mostly not underwater. That is, the value of their houses is more than the remaining balance on their mortgages. In fact, they could still sell their houses at a profit even in the current market.

I don't think Mr. Kinsley realizes how many of these long-term homeowners spent their houses.

Whatever figure you may have stored in your head about the “value” of your house (removing this figure to polish and admire it when home prices are rising; leaving it to gather dust in some dresser drawer of your unconscious when they aren't), a house is worth only what someone will pay for it. That number has two components: one is the value of occupancy — that is, the privilege of living in the house, mowing the lawn, calling the plumber and so on. This should roughly equal what the house would rent for. The other component is the investment value — how much you think the price of the house will go up when you sell it.

Do you think he reads IHB? Rental parity was not a concept people wrote or talked about much prior to the housing bubble. He probably reads Dean Baker, an economist who writes frequently about rental parity and called the housing bubble.

Any investment value greater than zero (or zero plus inflation) is suspicious because it depends on the greater-fool theory.

Yes, that is a Ponzi scheme.

There is no physical reason why a house should become more valuable at all. It is not growing like a crop. It is not producing anything that you can turn around and sell, like a factory. It just sits there.

One of the many reasons our economy is suffering right now is because we diverted resources to housing that gained us nothing. If we had overbuilt factories, at least we could get some productive use from the factory. Houses are pure consumption. They produce nothing once built, except perhaps for the need for more stuff for the house.

It becomes more valuable because people believe that it will become more valuable. Worse, since the general assumption that it will become more valuable is already reflected in the price you paid, you need a buyer who believes that it will become more valuable even faster than the general consensus.

The larger issue in all this is the wisdom of encouraging homeownership — even if you don't get carried away with it as we did in 2007 to 2009, practically forcing mortgages on people at gunpoint. About two-thirds of Americans do live in homes that they own (along with the bank). There is no way all of them could cash out and collect that number in their heads — how much is their house worth? — even now that it's 30% or 40% lower than it was before. And it's hard to see why people should want that number to resume its relentless rise back up and beyond.

The fact that people are underwater is exactly why so many need and want house prices to go up.

Housing has been identified by an entire generation as a fountain of free money. Many people in California are going to consume hundreds of thousands of dollars more than they earned due to owning HELOC producing California real estate. It is so embedded in our culture that only a multi-decade housing recession would purge the kool aid. That won't happen as long as the kool aid intoxicated have anything to say about the matter.

A little too much Ponzi

The owner of today's featured property paid $207,500 back on 5/30/1990 near the peak of the previous housing bubble. He held on through the previous decline, and he only had a $158,400 first mortgage on 5/20/1999.

On 4/18/2003 he refinanced with a $276,000 first mortgage he is now delinquent on. On 2/25/2004 he borrows $120,000 from someone with the same surname. The shortfall on the delinquency on the first mortgage will come out of proceeds available to pay the second; therefore, this is a short sale.

Foreclosure Record

Recording Date: 10/08/2010

Document Type: Notice of Sale

Foreclosure Record

Recording Date: 07/07/2010

Document Type: Notice of Default

If this is a relative holding the second mortgage, the short sale process is as easy or as complicated as that mortgage holder makes it. They should be motivated to settle. The servicer on the first mortgage in default is adding about 1.5% to principal balance each month which eats into the second mortgage recovery.

Irvine Home Address … 14 CARTIER AISLE Irvine, CA 92620

Resale Home Price … $350,000

Home Purchase Price … $207,500

Home Purchase Date …. 5/30/1990

Net Gain (Loss) ………. $121,500

Percent Change ………. 58.6%

Annual Appreciation … 2.5%

Cost of Ownership

————————————————-

$350,000 ………. Asking Price

$12,250 ………. 3.5% Down FHA Financing

5.02% …………… Mortgage Interest Rate

$337,750 ………. 30-Year Mortgage

$72,636 ………. Income Requirement

$1,817 ………. Monthly Mortgage Payment

$303 ………. Property Tax

$0 ………. Special Taxes and Levies (Mello Roos)

$58 ………. Homeowners Insurance

$140 ………. Homeowners Association Fees

============================================

$2,319 ………. Monthly Cash Outlays

-$300 ………. Tax Savings (% of Interest and Property Tax)

-$404 ………. Equity Hidden in Payment

$24 ………. Lost Income to Down Payment (net of taxes)

$44 ………. Maintenance and Replacement Reserves

============================================

$1,682 ………. Monthly Cost of Ownership

Cash Acquisition Demands

——————————————————————————

$3,500 ………. Furnishing and Move In @1%

$3,500 ………. Closing Costs @1%

$3,378 ………… Interest Points @1% of Loan

$12,250 ………. Down Payment

============================================

$22,628 ………. Total Cash Costs

$25,700 ………… Emergency Cash Reserves

============================================

$48,328 ………. Total Savings Needed

Property Details for 14 CARTIER AISLE Irvine, CA 92620

——————————————————————————

Beds: 3

Baths: 2

Sq. Ft.: 1424

$246/SF

Lot Size: –

Property Type: Residential, Condominium

Style: One Level, Mediterranean

Year Built: 1989

Community: Northwood

County: Orange

MLS#: P769891

Source: SoCalMLS

Status: ActiveThis listing is for sale and the sellers are accepting offers.

On Redfin: 1 day

——————————————————————————

The Lowest price in Northwood Villa community! No Mello Roos! Conviniently located near Trabuco Grove shopping center, Heritage Library, and Heritage Park. Private small backyard with wood deck. Direct 1 car garage plus extra 1 deattached cover car garage that can be used as storage. Located in award winning Irvine Unified School District. Great location and investment potential.

Conviniently? deattached?

Thank you for reading the Irvine Housing Blog.

Astutely observing the housing market and combating California Kool-Aid since 2006.

Have a great weekend,

Irvine Renter