Most people during the bubble bought a house as an investment. The fantasy was perfect: the better and more expensive the house, the more free money the house provides as it goes up in value forever. Just by purchasing real estate and using the largest loan available, everyone was enabled to be or do whatever they desired with abundant debt.
Much of the wealth created during the bubble was an accounting trick. Prices were temporarily and unsustainably elevated, and the wealth created was ephemeral and illusory.
People can't lose what they never had. Only the lingering attachment to an old dream remains to torment the kool aid intoxicated.
In California and other Western states, 67.5% of households saw their net worth fall, compared with 62.5% in the U.S. overall. The median decline in the West was 27%, well above the 18.1% national median.
March 24, 2011 — By Jim Puzzanghera, Los Angeles Times
The federal government has for the first time detailed the sharp drop in wealth that the Great Recession caused American households — and it shows that families in California and other Western states took the biggest and broadest hits by far.
The average net worth of U.S. households — the value of their homes, stocks and all other assets — fell 20% to $481,000 by mid-2009 from $598,000 in mid-2007, according to a Federal Reserve survey released Thursday.
In the Western states, 67.5% of households saw their wealth drop, compared with 62.5% for the nation overall. The median decline in wealth for households in the West was 27.7%, well above the 18.1% national median and nearly triple the 9.5% decrease for families in the Northeast.
While it's widely known that the recession slammed household wealth and that the housing market in the West took some of the hardest hits, the unusual Fed survey attempted to quantify the damage.
The central bank does a broad consumer finance survey of about 4,000 households every three years. But to gauge the effect of the recession, the Fed in mid-2009 began re-interviewing the same households it had surveyed in 2007.
The new data compare the state of those households just before the recession officially hit in December 2007 with how they were faring in the second half of 2009, after the recession technically ended and the economy began growing again.
Although about two-thirds of households saw their wealth fall, “a sizable fraction of households experienced gains in wealth, while some families' financial situation changed little,” the Fed said in its 37-page report, titled “Surveying the Aftermath of the Storm: Changes in Family Finances from 2007 to 2009.”
The banksters and above median home price squatters have done well as everyone else's wealth went negative.
Although overall wealth declined nationally, well-off families — those in the top quarter of net worth — saw their overall wealth increase by about 27%.
Still, the recession hit most households hard, leading to families in all income brackets to cut back spending so they would have “greater precautionary savings.“
That decline in spending “may act in some ways as a brake on reviving the economy in the short run,” the report said.
jim.puzzanghera@latimes.com
Frugality and savings accompany every recession. Some economists complain as if savings is a problem. Recessions end when people save, and that savings is loaned by banks into the economy. There is always a lag between when the money is saved and when it permeates the economy. The federal reserve seems to exist only to prevent the natural healing mechanisms of the market from working properly.
The credit bubble, the housing bubble, and illusions of wealth
The chart below illustrates the credit bubble that took our already burgeoning housing bubble and made it into an uber-bubble. For a more detailed analysis, please read the weekend post, Are large down payments supporting high-end home pricing?
Prices have stabilized along with aggregate loan balances at a level manipulated by government policy and federal reserve policy.
Note the average loan balance at the peak is very near current pricing. Banks are eager to hold prices at this level because any significant price decline would trigger strategic default as more and more owners submerge beneath their mortgage obligations. The loan balances are so large here that a cascade of strategic default similar to Las Vegas would cost lenders billions of dollars.
The false bottom of 2009 is most durable at the bottom of the market. Irvine has already double-dipped, and other premium communities in Orange County are facing similar circumstances.
What does the housing recession really look like?
At the peak, most cities in Orange County were trading at more than $400/SF. The Irvine premium was low by historic standards relative to surrounding cities. The crash has witnessed significant expansion of premiums between the highest value cities and the lowest value ones.
The current resale 311/SF is the lowest in seven and a half years. Anyone who bought since late 2003 and still owns is financially behind anyone who rented instead. When you factor in transaction costs, the additional cost of ownership (they paid more than rental parity in 2003), and the loss of buying power due to monetary inflation, and the money-pit of home ownership becomes apparent.
This spreading out of values could be attributed to savvy buyers recognizing a premium. I imagine the savvy buyers of the bear rally would embrace that idea.
In reality, the high end simply hasn't deflated yet. The distressed inventory is being withheld from the market, and the few buyers who are active are being forced to come up with huge down payments in order to transact.
Any way you slice it, the local housing market is facing significant headwinds, and with maximum foreclosure rates and a huge overhead supply, things will get worse before they get better.
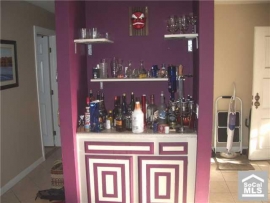
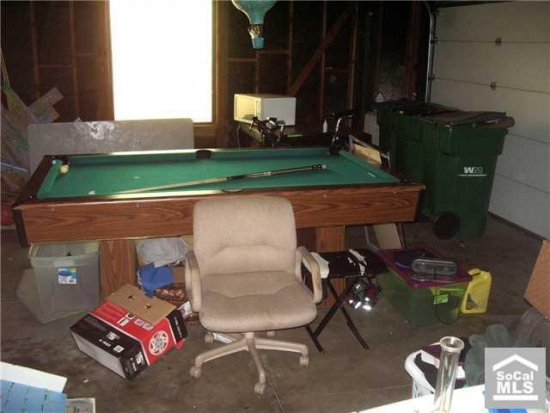
Anyone want to guess where the HELOC money went?
The decor and staging are rather unique. Did you notice they didn't bother to hide the bong above?
Actually, it looks like this is a college rental. The owner is listed as having an Idaho address.
The property was purchased on 10/21/1997 for $190,000. The owner used a $133,000 first mortgage and a $57,000 down payment.
On 7/9/2001 they refinanced with a $310,000 first mortgage. Perhaps they took the $170,000 of mortgage equity withdrawal and bought the property in Idaho cash? I don't have a clue.
On 6/28/2004 they returned to the ATM and obtained a $382,525 first mortgage. They were just issued a NOD.
Foreclosure Record
Recording Date: 02/28/2011
Document Type: Notice of Default
They may not have paid the mortgage in a while considering this is listed as a short sale at $419,000. With renters in this place, it produces some income that could have gone toward making payments. Do you think they stopped charging the renters when they stopped paying the mortgage?
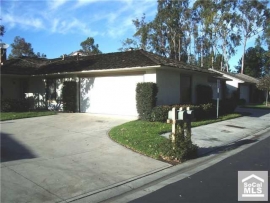
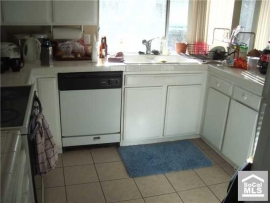
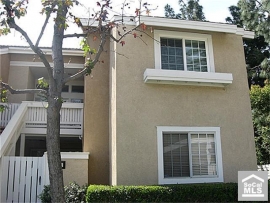
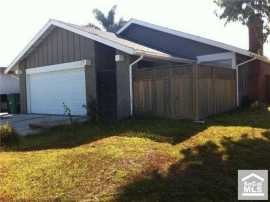
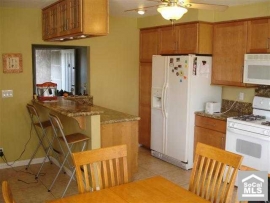
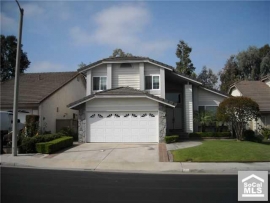
Single level home with no one above or below. Home is at the end of a cul de sac with an oversized driveway and a two car attached garage with direct access to the house. There are three large bedrooms and one has a secluded small patio/atrium. There is a large patio off the living area with plenty of room to entertain. The kitchen has an eat-in area and plenty of counter and cabinet space. This lovely home is surrounded by greenbelts and this family community has two pools, a club house, lots of walking trails and tot lots for the little ones to play in. Walking distance to Irvines award winning schools (Uni High is also very close), stores and parks. Also close to the 405 and 5 and toll roads.
This weekend's post is a detailed look at the median price, median loan, and median down payment in Irvine and nearby cities in Orange County, California.
All-cash home buying is surging across the United States, including in Orange County, as lenders tighten mortgage standards, middle-class buyers are sidelined and investors see opportunity.
Nationwide, cash buyers grabbed 33 percent of all used homes sold in February, the National Association of Realtors reported March 21. The figures, based on agent reporting, do not include foreclosure auctions on courthouse steps, which are usually cash-only.
In Orange County and California real estate, DataQuick Information Systems reports similar trends based on county recordings that do not show any purchase loan.
Cash-only sales have more than doubled in Orange County, from a monthly average of 10.4 percent in the past 23 years to a monthly average of 24 percent in the past 12 months, DataQuick statistics show. In January, all-cash sales hit 28.3 percent in the county – the highest for any month since DataQuick started tracking the figure in 1988.
That is a very large percentage of homes. It would be interesting to see the breakdown of that by cost. I know from what I witness in Las Vegas that most of the all-cash transactions are investors buying properties for less than $100,000. I suspect the bulk of the all-cash sales in Orange County are also at the very bottom of the price ladder.
In Irvine, 31.6 percent of the 393 homes sold so far this year were paid for in cash, real estate broker Cathy Haney said. The average sales price of the all-cash deals this year was $657,854, while the median price for all the Irvine homes sold was $535,000, she said.
That sounds like a lot, but historically about a third of all homes are owned with no mortgage anyway. What would be really interesting would be to see the total number of all-cash purchases and percentages over time. Unfortunately, I don't have that data. I have heard anecdotally from someone inside TIC that they did sell nearly 1/3 of their product to all-cash buyers. That amounts to about 200 closed sales last year.
Across California, mortgage-less home purchases have doubled from an average 14.7 percent in the past 23 years to 28.3 percent in the past 12 months, according to DataQuick. Cash deals hit 32.9 percent in February, the highest for any month since at least 1988.
“You're seeing an increase in cash deals at both ends of the price distribution curve,” said Sam Khater, chief economist for CoreLogic Inc., a real estate information company. “You're seeing it in the hardest hit areas, where investors are coming in and picking up low-priced properties. And you're seeing higher cash activity at the upper end as well.”
The “lion's share” of all-cash purchases nationwide are from investors, according to Walter Molony, a spokesman for National Association of Realtors. Real estate investors seek rental income, long-term appreciation or a quick profit.
Vito Antoci, a full-time real estate investor from Newport Beach, recently bought an ocean view home at 1006 White Sail Way in Corona del Mar for $1.45 million in cash. He is spending another $500,000 in cash to expand and renovate the house, and said he will sell the home within six months for $2.5 million to $2.89 million to earn at least a half-million dollars in profit.
Kudos to him if he can pull that off. I'm glad it's not my deal. He may find selling that one is harder than he thinks.
“When you buy with cash, you get the best deals,” Antoci said. “Sellers don't want to deal with the bureaucracy of banks.”
Antoci, who owns Varm Development, saw a nonlocal realtor putting the for-sale sign into the ground as he drove the streets looking for homes to buy. The sellers were asking $1.8 million. He made an offer and it was accepted that same day. It never hit the market, and escrow closed in a week.
“It was a quick, intriguing cash offer, and they took it,” he said.
Cash is always king.
Carl Alford, a retiring owner of a dry-cleaning product business, recently paid cash for two homes in Irvine that he is renting out for income.
“Stocks and bonds are a gamble, and banks certainly aren't paying anything on money,” he said. “You can earn more in real state, and I like something you can touch, feel and correct.”
He has cash earning about 4% in Irvine real estate, and that is better than the stock market that nearly doubled in the last two years? I like cashflow properties, but there are places where you get more bang for the buck.
Alford recently sold a home in Fontana and carried the mortgage note himself, he said, meaning the buyers are paying him monthly payments.
Investors are also using cash – either their own or from alternative resources – to gain an advantage over buyers using a mortgage in nabbing bank-owned properties, which are plentiful these days and usually less expensive than other homes. Foreclosures in January accounted for 37 percent of all home sales nationwide, 25 percent in Orange County and 54 percent in California.
Traditional lenders often reject mortgage applications for foreclosed properties because the homes need a lot of work, appraisals come in below the accepted price or deals just take too long to close, said Thomas Popik, research director for Campbell Communications Inc., which conducts national surveys of real estate brokers.
Some flippers don't even have to improve a foreclosure.
“You buy the house at a discount with cash, then you flip it almost immediately to the first-time homebuyer who's using a mortgage, simply because they were not able to buy at the foreclosure sale,” said Oliver Chang, a housing-market analyst with investment bank Morgan Stanley.
About half of all home purchases were paid for in cash in Miami, Las Vegas and Phoenix, Chang said.
HIGH-END MARKET
In the local, million-dollar-plus home market, buyers are choosing to use their own money to purchase their principal residence, says Chris Valli of luxury real estate brokerage Surterre Properties.
Why? Banks are asking intrusive, exhaustive questions of anyone trying to get financing for a home above $729,000, Valli said. Fannie Mae and Freddie Mac won't insure mortgages over $729,750. Buyers feel it is just less of a hassle to pay for the home with their own money, Valli said. The buyers also want to negotiate a better deal on the property by showing they can close escrow without a third party lender, he added.
All those advantages are real if you have the cash. This guy makes it sound like every buyer has that freedom, and they don't. He does paint an accurate and sobering picture of the jumbo market.
“It puts the seller more at ease and gives them a little more assurance,” Valli said. He recently sold an estate in the $7 million range in Irvine's Shady Canyon community for all cash. Another home in Shady Canyon recently sold for $4.3 million in cash.
Chris Crocker, a Coldwell Banker broker in Corona del Mar, says the wealthy are looking at waterfront dream homes priced 40 percent below the peak as a safe venue to out their money in for the next few years while also having some fun. The cash buyers he or his colleagues have worked with are looking to buy second or third homes as a place to dock their yachts and their money on the West Coast.
There's a general perception that the market has bottomed out on prices, Crocker said.
There is a general perceptions that realtors will call the bottom at every opportunity.
CREDIT CRUNCH
Tighter underwriting in general for mortgage loans is also a factor in the percentage increase of cash-only deals among all sales.
Lenders are requiring higher down payments and higher credit scores.
The median down payment for all home purchases with a mortgage rose to 22 percent last year in at least nine major U.S. cities, according to a survey by Zillow.com. That's up from 4 percent in late 2006, when the housing bubble began to burst. During the housing boom, buyers could purchase a home with little or no money down.
The weighted average FICO score for a home purchased with a Fannie Mae mortgage was 762 last year, up from 716 in 2006, the mortgage finance company reported.
The tighter underwriting is sidelining many would-be middle-class buyers, especially first-time buyers, from purchasing a home – even though prices are relatively low because of all the foreclosures.
“The average Joe can't take advantage because he simply cannot get the credit to buy,” said Paul Dales, senior U.S. economist for consulting firm Capital Economics.
People became spoiled by an era of cheap credit and unfettered access. Those days are gone.
The banks who fueled the housing bubble with lax mortgage underwriting are now being too restrictive, said Molony, the realtor association spokesman.
“Lenders have only been willing to lend to the cream of the crop in terms of credit scores,” he said. “As a result, you're seeing a depressed level of traditional buyers.”
Bloomberg News and The Associated Press contributed to this report.
When I first graphed the data on median loan amount, I was shocked by the obvious credit bubble that emerged from the data.
The current median loan amount has been steady at around $400,000 since late 2007. This line of support is about what a median income family could support with 5% interest rates. With the lack of jumbo financing, and with loan qualification being based on real incomes and amortizing loans, there isn't much upward pressure on loan balances. Lenders are providing enough air for support, but not enough to reinflate the bubble.
Their strategy to date has been to withhold inventory from the market and sell small numbers of high-end properties to the few buyers with cash. They are trying to drain a large reservoir with a tiny hose. At the current rate of liquidation, prices won't go down, but banks will own high-end properties for decades.
One of the ways this disparity shows up is in down payments. In areas where liquidations are proceeding at full speed, prices have been pushed down to the point that FHA buyers with 3.5% down become nearly half the housing market, hence the down payment percentages near 3.5% in Santa Ana and most of California.
Is this a sign of heavy cash buyers recognizing value and bidding up precious high-end properties? Perhaps, but there is an alternate explanation.
There are only so many frugal savers who have accumulated two or three years salary as liquid savings. Once those few people buy, buyers with smaller and smaller down payments get their opportunities. If there is limited supply, many buyers are left unsatisfied because they can't get property. These buyers are unable to increase their bids because they must qualify for a loan, and supplement with a down payment. Borrowers can't lie and make stuff up anymore to get around affordability.
Lenders know they have a problem, but they believe people will start making enough money to support the pricing on their books from 2006. It isn't going to happen. For now, they are content to withhold inventory from high-end markets and see what happens. As a result, there is very limited product that actually sells, and those go to the few buyers with lots of cash.
If we were seeing large down payments and normal to high transaction volumes, then the increased down payments would be indicative of increased buyer interest among those with cash. But since the transaction volumes are more than 30% below normal and near all-time lows, what we are seeing is the few available buyers paying what is asked with what resources they have. That isn't buying pressure that pushes up prices, that is restricted supply that forces the few buyers to reach for the sky.
The future of large down payment markets
The surest sign of liquidation of inventory is diminishing down payments. Low down payments characterize both market rallies and market bottoms. Moderate to high down payments are common to stable markets. Down payments where the highest after the credit crunch that signaled the collapse of the housing bubble.
To increase transaction volumes properties must be pushed down to buyers with smaller and smaller down payments. The buyer pool with 3.5% saved is much larger than the buyer pool with 20% down.
During the liquidation of high-end shadow inventory, if down payments are likely to compress, then either loan balances need to get larger, or prices are going to fall.
Orange County Asking Prices
I still think prices are going down, particularly at the high end. Here in Irvine, with loan balances holding at $400,000, the median will probably drop below $500,000, but unless loan balances decrease due to higher interest rates, the down payment compression won't get so severe as to push the median below $480,000.
More Ponzis flushed from loan ownership
Today's featured Ponzis put in $8,000 and took out $192,000. Not a bad ratio. They will want to own again.
The owners of this weekend's featured property paid $240,000 on 6/21/2001. They used a $232,703 first mortgage, and a $7,297 down payment.
On 10/22/2002 they refinanced with a $250,750 first mortgage. At least they waited a little over a year before getting their first nearly $20,000.
On 7/16/2003 they obtained a $27,000 HELOC.
On 3/24/2004 they refinanced with a $348,500 first mortgage.
On 12/28/2004 they obtained a $40,000 HELOC.
On 7/20/2005 they refinanced with a $384,000 Option ARM and got a $48,000 HELOC.
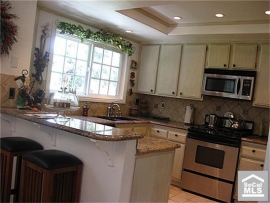
Gorgeous conner upper unit. 3bed/2bath, cozy fireplace. Recessed lighting, granite countertops in kitchen. Master bedroom is separaed from other 2 bedrooms and inside laundry room. Newly done in bathrooms, master bath has double sink. Travertine flooring in kitchen, dining room and master bathroom. Double pane windows and custom paint. Home is close to pool, lake shopping and schools.
Was I right, wrong, or somewhere in between. Let's review the data, and I will let you decide.
Irvine Home Address … 184 PINEVIEW Irvine, CA 92620
Resale Home Price …… $196,000
I believe I can see the future
Because I repeat the same routine
I think I used to have a purpose
Then again, that might have been a dream
Nine Inch Nails — Every Day is Exactly the Same
Groundhog Day is one of my favorite movies. Every day is exactly the same. One of the reasons I enjoy Southern California so much is because I rarely change my outdoor plans due to the weather. Every day is beautiful. Yesterday was, and tomorrow will be as well.
It will feel like groundhog day here over the next few years as we work through the inventory issues. I will offer the same advice: don't buy unless you plan a long-term hold. I will say that until the number of foreclosures gets down near zero, and the backlog of unprocessed bad loans is complete. I don't know how these bad loans will be resolved. I believe foreclosure will resolve most of them, but we may see some form of principal forgiveness become more common before this crisis is truly behind us. I hope not.
My beginning at the IHB
Many of you may not remember that I was not an original writer at the IHB. Zovall and IrvineSingleMom were the two first writers. When they asked me to write, I just started, and I haven't stopped. I don't know where the energy or inspiration comes from, but I do enjoy exploring this artform… or is it a news media…
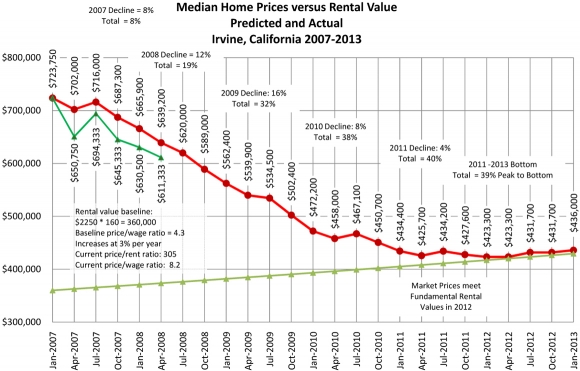
Back on February 27, 2007, I loudly proclaimed we were at the top of the market and that prices were going to crash. I wasn't offering a weak warning that prices might go down a little bit, I was boldly stating prices were going to crash — hard. It was going to be a catastrophe. It was important news.
Of course, when i made these proclamations, I was roundly criticized as a fool who didn't know what he was talking about (read some of the old comments). In order to provide some credibility to my assertions, I wrote a series of analysis posts:
In that post, I went on to list the main factors that will influence the timing and the depth of the decline:
Percentage of Income Put Toward Housing Payments
Interest Rates
Foreclosures
Adjustable Rate Mortgage Time Bombs
Government Intervention
I wrote that back in early 2007 before we had any of the following:
loan modifications which focus on DTI ratios,
federal reserve buying mortgage paper to influence interest rates,
foreclosures that reached maximum market absorption levels,
ARM resets contributing to delinquencies which are now in shadow inventory, and
The federal government nationalizing the housing market by taking the GSEs into conservatorship.
On August 25, 2008, I revisited my prediction in I Was Wrong, It’s Worse… It had the updated results through April of 2008.
The initial stages of the crash were surprising in the rapidity of the declines. Irvine's real estate market had experienced patches of weakness, but it avoided most of the 18% statewide decline in the early 90s. Predicting any decline ran the risk of stubborn sellers and sticky prices preventing a decline. By mid 2008, even the most stubborn bulls realized they had no idea what they were talking about back in 2006. They weren't just a little wrong, they were debt-up-to-their-eyes wrong about the direction of house prices.
How wrong was I?
I just obtained the updated median home sales prices for Irvine to see how my predictions compared to what really happened.
Prices did not fall as much as I predicted, not because my reasoning was flawed, but because unforeseeable and unprecedented efforts by bankers and the government delayed the drop, and may have averted a much deeper drop.
I say these events were unforeseeable and unprecedented, but some may argue that such extremes were inevitable. I have no way to counter that point. However, I can say that few predicted those events in advance of when the rumors became news. Any forecaster out there who foresaw those events and accurately gaged their impacts is far better than I am.
What happened in 2008 to slow the drop in prices?
Two events in 2008 marked important turning points for the market. First, in early 2008 nearly every housing market in the country reached and exceeded its capacity to absorb foreclosures without pushing prices lower. And second, in late 2008, the Treasury department went against 40 years of government statements and took over the GSEs and backstopped the GSEs bad debts. The public was absorbing the losses of private enterprise just like with AIG.
In the last housing bubble on the late 80s-early 90s, lenders foreclosed on delinquent borrowers without delay. There was no shadow inventory. The number of foreclosures did push prices lower, but they were not so overwhelming that prices crashed. In early 2008, the number of foreclosures simply overwhelmed the number of buyers, and prices plummeted. Banks had a decision to make: 1. keep foreclosing and push prices back to the 90s, or stop foreclosing and accumulate a shadow inventory of delinquent mortgage squatters. They chose the latter.
In late 2008, in response to a balance sheet in tatters and mounting losses, the Treasury Department took over the GSEs. by the end of the year, between the FHA and the GSEs, the federal government controlled about 98% of the mortgage market.
Once the government controlled the delivery mechanism for home loans, the only thing they needed was someone willing to buy those loans at high prices, and they could support prices at levels higher than a free market would bear. The patsy to buy home loans in a depreciating market turned out to be the Federal Reserve.
What happened in 2009 to slow the drop in prices?
When the Federal Reserve began its program to buy $1.2 trillion in mortgage-backed securities, it knew it was buying toxic crap, but the with an infinite balance sheet from the ability to print money, they are uniquely suited to absorb these losses — losses their member banks cannot afford to take. In essence, they printed enough money to paper over what was destroyed through lender losses.
Since 2009, the government has been in total control of the housing market. They remain in control to this day. There is talk in Washington about reform, but since any subsidy removal will lower prices and increase bank losses, any transition will happen slowly.
I was wrong: It's better
I was clearly wrong. Prices did not fall as far as I said they would. But how wrong was I?
If prices only fell 2/3 of the amount I projected, was I 1/3 wrong? If prices are 50% below expectations, how wrong am I. Was I at least 66% right?
46% off at the low end
Whatever becomes of the median, it is clear that prices of low-end properties have fallen dramatically. The owner who paid $342,000 for this property in 2006 certainly didn't think it would be worth less than $200,000 in 2011. He was wrong too. However wrong I am, it isn't as painful for me as it is for this former owner.
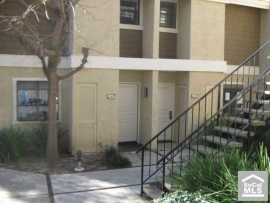
Irvine Single Family Attached Home. 2 Story with large living room, tile flooring, new wall paint, new kitchen appliances, new furnace, new carpet, and more. TURNKEY! Upstairs Bedroom and Bathroom. Rear Patio and laundry closet for full sized washer and dryer. Close to restaurants, shopping, schools, and more. HOA dues include trash and water. Carport # 199.
this is the one of the worst catastrophes in the world.
[indecipherable] its flames…
Crashing, oh!
Four- or five-hundred feet into the sky and it…
it's a terrific crash, ladies and gentlemen.
It's smoke, and it's in flames now;
and the frame is crashing to the ground,
not quite to the mooring mast.
Oh, the humanity!
Herbert Morrison — WLS radio
Housing bubbles are catastrophes. Like the Hindenburg or the Titanic, house prices had an aura of invincibility that came crashing down and sunk to an (under)watery grave.
If a mortgage product were to inflate a housing bubble, the pump and hose that primes the first stages are adjustable rate mortgages. These risky products give the market ability to weather interest rate shocks, but they also provide the air that inflates prices 10% to 15% above stable prices set by using fixed-rate mortgages.
Californians pay too much for their houses because many get trapped into adjustable-rate mortgages to borrow as much as possible. It becomes a rite-of-passage that your first purchase requires you to take on a risky loan and stretch to the max so your bank can extract as much money as possible from your working life.
Some wise up to the adjustable-rate mortgage trap, and they either refinance or move to a different home when their financial situation changes. They take with them the equity built up from the frightened masses that came after and inflated neighborhood values.
Adjustable rate mortgages are not a product I like because it forces borrowers to assume interest rate risk. Many people who use adjustable rate mortgages claim they understand interest rate risk, but in the last 30 years, interest rates have done nothing but go down. There has been no consumer risk in holding adjustable-rate paper.
That changes when interest rates hit the bottom of the cycle and begin to rise.
Each adjustment in rate going forward represents a larger cost to the borrower. Everyone stretching today to get into real estate using an adjustable rate mortgage will face an increasing payment without obtaining any appreciation to compensate. It's a lose – lose. Those using fixed rate mortgages with affordable payments can weather any storm.
Adjustable rate mortgages will burn most who use them over the next decade. Those with assumable fixed rate mortgages will fare the best.
Also, for those awaiting the return of HELOC riches, how much of that equity are you going to borrow at 7% when your primary mortgage is 4.5%?
The article that follows is a bit wonkish, but it provides a detailed explanation of how adjustable rate mortgages impact the California real estate market.
This article discusses how the ratio of adjustable rate mortgages (ARMs) to all loans originated in California can be used to determine the health and direction of California’s near-term real estate market.
Data Courtesy of MDA Dataquick, the US Federal Reserve, and Standard and Poor’s
The above charts present two real estate market perspectives on adjustable rate mortgage loan (ARM) volume in California. Both charts track ARM loans as a percentage of all mortgages recorded in California (the blue line), called the arms-to-loans (ATL) ratio. The first chart juxtaposes California’s ATL ratio with the fixed rate mortgage (FRM) rate for the Western Census Region (the green line), while the second chart joins the ATL ratio with the combined monthly tri-city average of low-tier home pricing in San Diego, Los Angeles and San Francisco (the red line).
The ATL ratio is a crucial measure of the relationship between ARMs and FRMs, and can be used to determine probable sales volume and price movements for 12 and 24 months forward (respectively). [For a more detailed look at home pricing in California, see the first tuesday Market Chart, California Tiered Home Pricing.]
In the top chart, notice the collapse of ARM lending after 2006. ARMs went from nearly 80% of the market down to 2%.
ARMs depend on FRM Rates
The availability of purchase-assist money is the single most powerful engine driving price movement in California real estate transactions, as shown by the boom in sales volume and pricing caused by excess funding in the mid-2000s; a phenomenon called the financial accelerator effect. Purchase-assist money is delivered almost exclusively by either ARMs or FRMs (except for the very few buyers who pay cash). [For more information about the financial accelerator, see the May 2010 first tuesday article, Cleaning up after the ruptured housing bubble.]
Because mortgage financing is so dominant in sales transactions, the friction in the movement between the 30-year FRM Rate and the ATL ratio is essential to the understanding of brokers who wish to hazard a prediction of what lies ahead for their real estate market.
Combined in analysis, these two factors – the FRM rate and the ATL ratio – have the power to predict California’s future home sales volume and price movement. Local market conditions, on the other hand, seem to have little influence on sales volume and pricing, since both are controlled by financing trends, which are moved only by the bond market and federal monetary policies. [For a more global review and critique of ARMs, see the March 2010 first tuesday article, The Danger of an ARMs Buildup.]
The FRM-ATL Connection
30-year FRMs are the most basic and essential form of financing for homebuyers in the real estate market. If FRMs are available at comparatively low rates, and the homebuyer is well-informed (and somewhat rational), the homebuyer will almost always choose the FRM over the much riskier ARM loan.
When ARMs became 80% of the market in 2006, nearly everyone forgot the common sense idea that fixed-rate debt is better. Now that ARMs are nearly extinct, some are lemanting their demise. Good bye and good riddance.
In a normally functioning purchase-assist and refinancing mortgage market, the percentage of ARMs – the ATL ratio – rises and falls only in direct response to changes in FRM rates, in sympathy until friction develops and leads to a deviation in movement between the ATL ratio and FRM rates. Such a deviation is a clear warning of an impending distortion in real estate sales volume and pricing.
As the top chart vividly indicates, observed rises in FRM rates tend to lead to increases in ARM volume, the normal situation. The reasons are intuitive, since ARMs allow borrowers to obtain more funding when the FRM rate increases (sellers refuse to lower their prices in response to FRM rates, so buyers are forced to either lower their standard of living or obtain a higher amount of funding).
Note that this normal dynamic is not present in a market laden with distressed properties. If affordability declines in a normal market, buyers often foolishly adjust by taking out ARM loans since sellers rarely come down on price. However, since so much of our current inventory is distressed, for this inventory to clear, prices must come down to whatever price level borrowers can obtain. In other words, it is different this time.
For instance, the number of ARMs jumped dramatically when FRM rates were raised in 1988, 1994 and 1999. Prices never moved down, as the ARM supported sellers’ demands by delivering more money than the buyers would otherwise be qualified to borrow.
It is useful to think of ARMs as bridge loans, spanning gaps in the availability of purchase money when FRM rates rise. Any rise in FRM rates immediately reduces the buyer’s purchasing power, since lenders do not permit buyers to make loan payments higher than 31% of their income. Higher interest rates always mean lower principal amounts are available to borrow. [For more on the influence of rates upon the buyer’s ability to get financing, see the first tuesday Market Chart, Buyer Purchasing Power.]
This is the point I have been making for months now. Lower borrowing amounts when coupled with excessive must-sell inventor leads to lower prices.
When FRM rates rise, ARMs tend to keep prices from falling. Unfortunately, ARMs originated in excess will quickly cause prices to rise during periods of flat or declining FRM rates. ARM financing permits sellers to raise prices beyond what buyers would otherwise be able to pay. Increased availability of funds from ARMs help stabilize the market in a time of temporarily high FRM rates, but they can just as quickly lead to a home pricing bubble and a potential market crash when the ATL ratio is running contrary to the FRM rate movement as occurred in 1993 and 2002.
ARMs are the cause of volatility in California's housing market. The Option ARM was the culprit that inflated the Great Housing Bubble because it allowed huge principal values with tiny payments. The same payment can finance two or more times the loan amount with an Option ARM as compared to a FRM.
In the past, ARMs in healthy markets have generally made up approximately 20% to 40% of the home loan market, while the remainder is made up of FRM loans. If the ATL ratio exceeds 40%, which normally happens when FRM rates rise too high, it is a sign of instability in the financing market, and forebodes potential problems for homeowners and homebuyers in the near future – weaker sales volume and home prices.
Forecasting the future
With FRM rate movements in mind, it is possible to forecast the future of sales volume and sales price trends by comparing FRM rates with movement in the ATL ratio. To do so, take a close look at the correlation from year to year between FRM rates and the ATL ratio on the first chart above.
Ordinarily, the ATL ratio rises and falls in tandem with FRM rates, roughly following it in a stable and nearly parallel relationship. However, this stable relationship can and does sometimes fail when external factors cause the ATL to move contrary the FRM rate. Such external factors may include:
increases in jumbo loan demand;
rapid shifts in demographic demands to buy or sell;
too much or too little construction activity; or
changes in government regulations on homeownership or mortgage financing.
You can develop an understanding of what will be the real estate sales volume for the next 12 months, and sales price movement for a full 24 months by following any failure in ATL/FRM relationship.
In the real estate market, home sales volume tends to rise and fall in a cyclical fashion corresponding to economic recessions (represented above by gray vertical bars on the charts) and booms. Home prices change primarily due to prior changes in sales volume, although the pricing inertia generated by rising sales volume tends to continue for 8 to 12 months after home sales volume reaches its apex (this delayed change in pricing, which is particular to SFR property, is referred to as the sticky pricing phenomenon). [For a more thorough analysis of sticky pricing, see the first tuesday December 2009 article, TheFlat Line Recovery: A Side-Effect of Sticky Housing Prices.]
To make an accurate and well-informed prediction of home sales volume and pricing in California, the only figures you need are the ATL ratio and the FRM rate for the past 12 months. When these two figures fail to move in tandem during the prior 12 months, the friction between them is predictive of the extent of the change in sales volume and pricing trends in future months. Which direction the trend will take depends upon whether the two rates become more closely aligned or more distant.
It is unnecessary to look to any information other than the correlation between the ATL ratio and the FRM rate for forecasting the next 12 months of sales volume and 24 months of pricing. All other factors either reflect the ATL and FRM rates, or are directly caused by the fluctuations in those rates. For instance, while the volume of notices of default (NODs) and trustee’s deeds (TDs) may appear to have an influence on price movement at the moment of analysis, in fact NOD/TD volume is merely a manifestation of prior price movements which are dictated by FRM and ATL frictions. [For more information on NODs in the current market, see the first tuesday Market Chart,NODs and Trustee’s Deeds.]
When the ATL ratio parallels the movement of FRM rates, both sales volume and prices will remain fairly constant in the future. This is the definition of a normal market: looking forward, readers can safely predict that neither a measurable boom in pricing nor a recession will take place in the two years following such conditions.
Instead, sales volume will continue much the same as at present for at least 12 months, and prices will remain reasonably steady, adjusting upward at approximately the rate of inflation in the consumer price index (CPI) for a longer period, another 6 to 12 months. [For the most current CPI figures, see the first tuesday Rates Page.]
However, any sustained period (12 months or more) in which the two factors are at odds with one another, as demonstrated by a widening or narrowing of the space between the two lines on the ATL/FRM chart, discloses a hazardous abnormality in the home financing market. Any such abnormality establishes a divergent trend going forward in real estate sales and pricing. Examples of such divergences are elucidated below.
I have used the loosly defined term “normal” market on many occassions. The definition above is a good one, if a bit technical.
Historical trends
To get a clear idea of the power of FRM rates and the ATL ratio to predict action in the real estate market, take a look at these illustrative instances:
1. Between 1996 and 2002, the ATL ratio moved in approximate synchronicity with FRM rates, in an example of the ideal lending conditions on the market. Thanks to stable and sane loan demands by homebuyers and homeowners, real estate prices rose at a slow and sustainable rate for the duration of this period.
2. Beginning in 2002, FRM rates dropped continuously for two years. In the meantime, the ATL ratio began to rise, thanks to deregulation of lenders and Wall Street Bankers which allowed them to push for increased use of ARM loans and the concurrent rise in asset prices. The unnatural rise in ARMs led to excessive home price increases, which continued to rise for one to two years even after a return to standard ATL/FRM synchronicity (the ATL ratio peaked in early 2005, but home pricing did not reach its apex until one year later).
3. Between 2005 and 2009, FRM rates remained flat, but the ATL ratio reversed course and dropped significantly. The declining ATL ratio, coupled with a flat FRM, presaged an inevitable decline in housing prices, and a similar drop in the amount of money available for homebuyers and homeowners to borrow. In short, the dropping ATL ratio (without a drop in FRM rates) was both a symptom and a cause of the catastrophic Great Recession. Lenders dropped FRM rates further, in early 2009, but the ATL ratio responded by dropping to almost zero, a condition that exists at the end of 2010.
The authors contention is backed up by the data. Although this indicator and explanation are hard to follow, it makes sense that sudden changes in financing behavior, particularly the use of risky ARM loans, will lead to market volatility and instability.
The current market
As of October 2010, adjustable rate mortgages (ARMs) made up only 5% of mortgage market originations statewide, compared to 77% at the height of the Millennium Boom (for comparison, the peak national rate was only 36% ARMs). This 5% ATL is very low, yet it is higher than the bottom of 2% in May 2009, and continues a downward trend from an ATL ratio of 6.5% in May 2010.
Both the ATL ratio and the FRM rates are bouncing around at about the same level, with the ATL ratio literally bumping along on the bottom (as it cannot go lower than zero). Yes, the FRM is artificially low and will move around depending on the effectiveness of Fed and congressional stimulus at end of 2010 which will take effect throughout 2011, but that is not the issue.
The ATL/FRM relationship has remained relatively normal for the past year, after a logical bounce at the end of 2009. Sales volume is thus likely to remain constant or drop over the next 12 months, and the same is true of prices for the next 18 to 24 months from now. Buyers need not expect any changes in market conditions until mid- to late 2012. Government programs to encourage ownership, or to create pre-foreclosure workout sessions, will not significantly alter this situation. It will change only if buyers return to the streets intent on scarfing up real estate.
History also helps us to predict how ARMs will behave at the end of a real estate recession. Historically, recessions have led to a restabilization of the ATL ratio between 20 to 40% levels, typically following the FRM rate closely for three to five years following the recession’s end. This rule is not absolute, however; most recently, the period of 2001 to 2004 violated this condition (due to government efforts to artificially bolster the homeownership rate in the US from 64% to 70%, at the expense of homebuyers who were financially unprepared for homeownership).
As the gatekeepers to real estate, brokers and their agents need to know the shift in mortgage preferences among homebuyers from fixed rate mortgage (FRM) to ARM financing in the absence of increased FRM rates means the real estate market is destabilizing.
ARMs are not a stable loan product, and although 20% to 40% may typically be present, that only means 20% to 40% of the buyers are taking foolish risks and remaining market participants must deal with it. The presence of ARMs is not helpful, but the product doesn't totally destabilize the market while ratios are in that range and prices are rising.
With insight to apply this information, they will be able to provide better advice to both sellers and homebuyers.
The author is assuming agents care enough to convey truthful information even when they have it. My observation is that agents don't care about the truth unless it is helpful in generating a commission.
ARMs and the dysfunctional real estate market
While an ATL of up to 40% indicates a healthy home sales market, we wish to clarify that ARMs are almost never beneficial to the individual homebuyer, and are in fact largely (if not totally) responsible for the Great Recession in the real estate market.
The weaknesses of the real estate market revealed by the recent Millennium Boom (and the associated GreatRecession)are tied inextricably to the prevalence of ARM originations during that period. Without ARMs, introduced in 1982 by authority of the US Treasury, the world of real estate would not be in its present dire condition. Financing the purchase of any type of real estate with ARMs points to several key instabilities in a momentum environment of increasing sales volume:
Homebuyers are over-anxious. Over-anxious homebuyers who cannot finance the purchase of homes with stable long-term FRM loans will make the myopic decision to resort to ARMs in order to get into the home immediately, even though this choice entails greatly over-extending their future finances. They are not being told, nor do they themselves properly consider, the true cost of ARM loans when short-term rates increase — as they invariably and often dramatically do in normal business cycles of recession and recovery. This overheating of the real estate market — its weakness — creates a breeding ground for speculators and ever more ARM borrowing.
Speculators have a large presence in the market. ARMs provide a free lunch for flippers: rates are cheap with minimum cash flow requirements in the short term, providing speculators with enough time to get in, wait for prices to go up — the rush delivered by a momentum-based market — and then sell, hoping all the time to take a profit. ARMs also lower origination costs: a great incentive for speculators.
Home prices are unnaturally inflated. As more speculators enter the market to suck out their share of rising equities, they bid up property without any need to consider the fundamentals of real estate valuation, and over-inflation of housing prices ensues.
All of these conditions point to a most financially pernicious condition: the asset bubble. Thus, whenever ARM loans — sometimes referred to as zero-ability-to-pay (ZAP) loans — inconsistently rise in popularity compared to movement in the FRM rate (as indicated by an aberrant increase in the ATL ratio and a flat or dropping FRM rate),
This is a brilliant insight. ARMs equal instability. The more ARMs dominate the market, the more unstable that market is and the deeper the potential correction.
it should raise a massive red flag in the face of industry professionals. Such a rise in ARMs means that the Federal Reserve (the Fed) will soon need to slam on the brakes of the speeding real estate market before the new bubble implodes.
If only real estate professionals cared enough to send a warning. Few in the industry would argue against a bubble when so many are making so much from its inflation. Besides, as I can attest, any such warnings will be largely ignored anyway. People are going to do what they are going to do, often irrespective of the information made available to them.
The Fed accomplishes this primarily by raising short-term rates, which determine ARM origination costs and rates, and by raising reserve requirements for private banks to discourage lending in the overheating real estate market. The Fed’s measures, in turn, result in upward payment adjustments on ARMs that discourage new purchases and put current homeowners at risk of loss by sale or by foreclosure.
The advice below is some of the best I have come across. Do you think anyone in the real estate industry is actually telling thier customers stuff like this:
Knowledge brokers can use
The old joke in lending is that when a borrower opts for an ARM loan, lenders not only get an ARM off the borrower, but eventually his leg, as well. The industry has long been aware of what borrowers cannot seem to take to heart: ARMs are great only for the lenders who gladly take the fees and for speculators who don’t care about long-term ownership or market stability.
Agents need to counsel their buyers not to succumb to the toxic ARM. Brokers and agents who keep a close eye on the ATL will have the knowledge(and as fiduciaries, the duty) to provide the warning bells to their clients by supplying up-to-date information and their opinions about the potential direction of ARM rates and the prices of real estate.
As ARMs become more popular during this recovery, as they will, potential buyers will become more confident. Faced with these conditions, prospective homebuyers will find it increasingly difficult to compete with their ARM-using peers, and will opt to use ARMs once more in spite of the untenable risk they present.
This is my greatest concern with the way properties are being released. Everyone will end up in an ARM. If every new buyer is forced to stretch to the max in order to make up for the bad debts at the banks, everyone still ends up paying a huge loan ownership tax to the banks. I don't feel like putting the maximum allowable DTI toward a house less comfortable than my rental for the privilege of paying huge interest payments in hopes of future appreciation. Forget it.
These buyers must be told that there is no wisdom in mortgaging their future financial solvency for what will amount to a short-term tenancy when they can no longer make mortgage payments on their ARM. The mistake of an ARM purchase will only be compounded by the fact the new owner has most likely paid too high a price, since ARMs are only useful when homes become unavailable at FRM rates.
The high purchase price, unfortunately, makes it impossible for the buyer to resell and recover any equity when things turn sour at the end of the virtuous cycle. Able, informed buyers drive speculators away, giving sellers a fair price for their properties and brokers and agents a stable income.
Routine house spender
Finding a loan owner with a quarter million dollars worth of HELOC abuse is routine. It has little impact any more. I am still astonished by how common these borrowers are. You wouldn't think all of them borrowed over $100K. They did.
This house was purchased on 9/22/2000 for $265,000. The owner used a $251,750 first mortgage and a $13,250 down payment.
On 4/12/2004 he refinanced with a $315,000 first mortgage.
On 9/16/2004 he refinanced again for $381,500.
On 3/30/2005 he opened a stand-alone second for $50,000.
On 1/5/2006 he refinanced the stand-alone second for $50,000 and obtained a $20,000 HELOC.
On 8/16/1006 he refinanced with a $119,100 stand-alone second mortgage.
Total property debt is $500,600.
Total mortgage equity withdrawal is $248,850.
Total squatting time two years and counting.
Foreclosure Record
Recording Date: 09/15/2010
Document Type: Notice of Sale
Foreclosure Record
Recording Date: 06/25/2009
Document Type: Notice of Sale
Foreclosure Record
Recording Date: 03/20/2009
Document Type: Notice of Default
This owner made it through all of 2009 and 2010 without making a payment. It appears he is still living there.
-$346 ………. Tax Savings (% of Interest and Property Tax)
-$458 ………. Equity Hidden in Payment
$28 ………. Lost Income to Down Payment (net of taxes)
$50 ………. Maintenance and Replacement Reserves
============================================
$1,776 ………. Monthly Cost of Ownership
Cash Acquisition Demands
——————————————————————————
$4,000 ………. Furnishing and Move In @1%
$4,000 ………. Closing Costs @1%
$3,860 ………… Interest Points @1% of Loan
$14,000 ………. Down Payment
============================================
$25,860 ………. Total Cash Costs
$27,200 ………… Emergency Cash Reserves
============================================
$53,060 ………. Total Savings Needed
Property Details for 14952 GAINFORD Cir Irvine, CA 92604
——————————————————————————
Beds: : 3
Baths: : 2
Sq. Ft.: : 1112
Lot Size: : 5,096 Sq. Ft.
Property Type:: Residential, Single Family
Style:: One Level, Other
View:: Faces Northwest
Year Built: : 1971
Community: : El Camino Real
County: : Orange
MLS#: : S632589
——————————————————————————
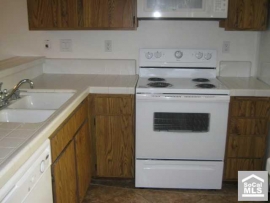
Come see this exquisite property in the El Camino Real area of Irvine! Property is a detached home close to 1200 sq feet and has a lot size of 5000 sq feet with a nice spacious backyard. Kitchen, Dining area, and Bathrooms were recently remodeled with new countertops and cabinetary in some areas. Some new additions to the house include a new fence in the back yard, new roof, crown molding in the master bedroom, vaulted ceilings in the living room, and laminate flooring in the family room and new tile in the kitchen. Best of all, no HOA or Mello Roos fees!
If banks could store time in a bottle, they could keep in on the shelf with their worthless paper until the market gives it life again. Unfortunately, rather than storing time in a bottle, the remaining equity capital in our banking system is leaking away through servicing costs like sand in an hourglass. These servicing costs are hidden by amend-extend-pretend until disposition forces recognition of the losses.
Astute housing market observers note the amend-extend-pretend policy of banks is untenable in the long term. As some point, keeping fantasy books must intersect with reality. The fantasy had house prices going up until reality and fantasy intersected. I don't believe it can or will work out that way.
The weight of the inventory and the incentive to liquidate will have individual banks working against their collective best interest. Ultimately, the fantasy of amend-extend-pretend will become so implausible that the banks will find that position is no longer operative.
But what will it take to force banks to end amend-extend-pretend? In my opinion, the answer is increasing loss severities.
by JON PRIOR — Thursday, December 16th, 2010, 5:28 pm
Loss severities are expected to increase between 5% and 10% on residential mortgage-backed securities in 2011 as loss mitigation costs and foreclosure expenses go up, according to Fitch Ratings. This, analysts said, will push servicers to short sales.
It will not push servicers to short sales because the loss severities are large there too. In some cases, once the bank has to pay sales commissions, back taxes, back HOA dues and other costs at short sale, they would have been better off simply pushing through a foreclosure and getting their cash.
The loss severity, or the percentage of principal lost when a loan is foreclosed, on prime mortgage loans is currently at 44%. This, according to Fitch, will increase to between 49% and 54% in 2011. For Alt-A loans, the current 59% loss severity should increase to between 64% and 69%.
Currently, the loss severity on subprime loans is 75%, but Fitch predicts it will increase to 80% and 85% by the next year.
These loss severities had remained stable for more than a year. In the second quarter of 2009, the amount a lender could recover when it foreclosed on a mortgage was propped up by slightly improving home prices, low mortgage rates, homebuyer tax credits and government-funded modifications.
Loss severities leveled off because prices made a minor rally during the echo-bubble engineered by the government and Federal Reserve. It takes appreciating prices to make up for the losses from servicing costs.
Increased servicing costs from pressures to modify more loans and recent problems with many banks' foreclosure processes will drag down the amount of principal banks can recover from a foreclosure. Borrowers average 19 months without making a payment before they are foreclosed upon, a record high, and Fitch projects this to increase to 25 months in 2011.
Fitch Managing Director Diane Pendley said the answer for some lenders is a short sale.
“Servicers are increasingly turning to less costly alternatives to foreclosure such as short-sales,” Pendley said.
Recovery rates on short sales are usually 10% higher than foreclosures. Pendley said servicers are also reducing the amount of payments they advance to securitization trusts from delinquent borrowers, particularly on subprime loans. In November, Fitch said, servicers advanced only roughly 60% of delinquent subprime loans, down from 90% at the beginning of 2009.
Each month a loan is delinquent it costs 1.5% of the loan balance in carrying costs. That is a troubling rate of financial decay. Time is the actually the bank's enemy when it comes to loan loss severities. Banks are providing squatters time in hopes they will get current and keep the zombie debt alive. Eventually, the carrying costs are going to make the loss severities so large that banks will either liquidate or implode, after which they will be liquidated anyway.
… Let’s start with real-world implications. The average borrower in foreclosure has been stuck in the default pipeline for more than 16 months, according to Lender Processing Services (LPS: 29.66 -1.69%), without making any sort of payment on their mortgage. That's well over a year, with some states even averaging north of this number. No wonder servicers are increasingly halting principal and interest advances, deeming loans unrecoverable. At that level of severe delinquency, there is simply no cure that can restore a loan to performing.
Here’s why: Consider that the average carry cost of a home in foreclosure is 1.5% of unpaid principal balance per month, on average, a figure I’ve been given by various servicing executives. For a $200,000 loan in foreclosure, that amounts to more than $48,000 in accumulated carry costs given the average age. That’s roughly a quarter of the entire original indebted amount.
(If you wondered how loss severities above 100% are materializing on liquidated debt, by the way, this is how you get there.) …
Loan severities will continue to increase as appreciation no longer hides the bleeding on bank's balance sheets. The longer these foreclosures are dragged out, the worse the loss severities will become.
A HELOC the bank deserves to lose
Sometimes when I see a really stupid loan in the property records, it really infuriates me that taxpayers are making up the business losses of people who approved such stupid loans. The owners of today's featured property went Ponzi. It was obvious they had gone Ponzi. However, some banking genius thought it was a good idea to extend a HELOC to a Ponzi in second position to an Option ARM. WTF?
Second position to an Option ARM?
Lenders willing to take on that kind of risk deserve the losses they receive. They gave the owners of this house free money to spend. They spent it, and now they can't pay it back. Anyone with an ounce of common sense could look at the property records and see this coming. Why didn't the banks bother?
Banks won't worry about future loan losses either now that they know the rest of us will bail them out. Moral hazard is an impossible problem to overcome. It can only be avoided.
This property was purchased on 6/26/2000 for $392,000 according to the property records. There is also a $392,000 first mortgage and a $58,800 second mortgage, so it is more likely the owners paid closer to $450,800.
On 3/18/2002 they refinanced with a $387,000 first mortgage.
On 11/13/2002 they refinanced with a $300,000 first mortgage and a $92,000 second mortgage.
On 3/2/2004 they obtained a $220,000 HELOC, and the problems began.
On 7/21/2004 they refinanced the first mortgage for $522,000 and obtained a $128,000 HELOC.
On 6/20/2006 they refinanced with a $656,000 Option ARM first mortgage and obtained a $82,000 HELOC.
I find that HELOC offensive in its stupidity. Anyone in lending with half a brain could see it was only a matter of time before these borrowers imploded (they already went Ponzi) yet they were extended a $82,000 HELOC on top of a loan product with a growing balance, the Option ARM.
If lenders had any concern for risk, they would not have made that loan. It angers me that I am paying for it with taxpayer bailouts.
Next housing bubble, I am going to figure out how to get a HELOC on my rental.
-$476 ………. Tax Savings (% of Interest and Property Tax)
-$651 ………. Equity Hidden in Payment
$247 ………. Lost Income to Down Payment (net of taxes)
$83 ………. Maintenance and Replacement Reserves
============================================
$2,758 ………. Monthly Cost of Ownership
Cash Acquisition Demands
——————————————————————————
$6,609 ………. Furnishing and Move In @1%
$6,609 ………. Closing Costs @1%
$5,287 ………… Interest Points @1% of Loan
$132,180 ………. Down Payment
============================================
$150,685 ………. Total Cash Costs
$42,200 ………… Emergency Cash Reserves
============================================
$192,885 ………. Total Savings Needed
Property Details for 8 WESTMORELAND Irvine, CA 92620
——————————————————————————
Beds: 4
Baths: 3 baths
Home size: 2,132 sq ft
($310 / sq ft)
Lot Size: 4,750 sq ft
Year Built: 1985
Days on Market: 75
Listing Updated: 40522
MLS Number: U10004545
Property Type: Single Family, Residential
Community: Northwood
Tract: Cs
——————————————————————————
According to the listing agent, this listing is a bank owned (foreclosed) property.
Price reduction. REO. Nice 4 bedroom, 3 full baths SFR in very nice Courtside neighborhood. Newly painted interior, new stove, over the range microwave, new sink, disposal, etc. Very nicely landscaped with a deep lot. Near everything, freeways & shopping.

.jpg)


.jpg)


