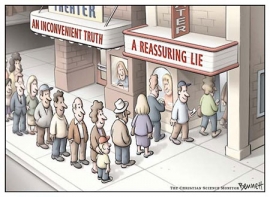
The economists at the Federal Reserve take an honest look at the inefficacy of their policies.
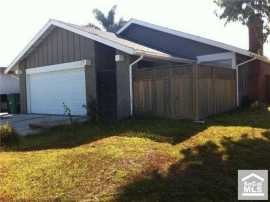
Irvine Home Address … 12 PLEASONTON Irvine, CA 92620
Resale Home Price …… $660,000

The only way to win is cheat
And lay it down before I'm beat
and to another give my seat
for that's the only painless feat.
That suicide is painless
It brings on many changes
and I can take or leave it if I please.
Johnny Mandel — Suicide is Painless
Most people try to avoid pain, physical, emotional, financial. Anyone focused on playing in the California housing market Ponzi scheme, there is only one painless feat: pass the debt off to another person. Give them your seat and let them own the mortgage. Think about the windfall received by those few that sold in 2005-2007 and rented. Those left owning loans are feeling major pain.
The Federal Reserve exists to foster moral hazard by preventing banks, businesses, and consumers from feeling the ill effects of their poor financial decisions. The Federal Reserve has purchased $1,200,000,000,000 in mortgage-backed securities in an effort to lower interest rates and make the sky-high prices of the bubble affordable. They have printed money through two rounds of quantitative easing, and they help lenders dodge regulation that might expose their insolvency or hinder their business. Given the mission and behavior of the Fed, it is surprising when they publish a fact-filled paper with careful analysis, particularly when that paper is critical of government policy.
The Fallacy of a Pain-Free Path to a Healthy Housing Market
December 2010
Federal Reserve Bank of Dallas
by Danielle DiMartino Booth and David Luttrell
In the mid-1990s, the public policy goal of increasing the U.S. homeownership rate collided with a huge leap in financial innovation. Lenders shifted from originating and holding mortgages to originating and packaging them for sale to investors. These new financial products enabled millions of Americans who hadn’t previously qualified to buy a home to become owners. Housing construction boomed, reaching a postwar high—9.1 million homes were built between 2002 and 2006, a period when 5.6 million U.S. households were formed.
That is a huge supply imbalance. And like Ireland, much of this supply exists in areas where there is little or no demand. Second home communities are inundated with houses that nobody can finance at prices several times what local incomes can support.
The resulting oversupply of homes presents policymakers with a formidable challenge as they struggle to craft a sustainable economic recovery. Usually a driver of economic recoveries, the housing market is foundering as an engine of growth.
Generations of policymakers since the 1930s have sought to increase the homeownership rate. By the late 1960s, it had reached 64.3 percent of households, remaining there through the mid-1990s, in apparent equilibrium with household formation during a period of sustained U.S. economic growth. A fresh push to increase ownership drove the rate up 5 percentage points to its peak in the mid-2000s. Home price gains followed the rate upward.
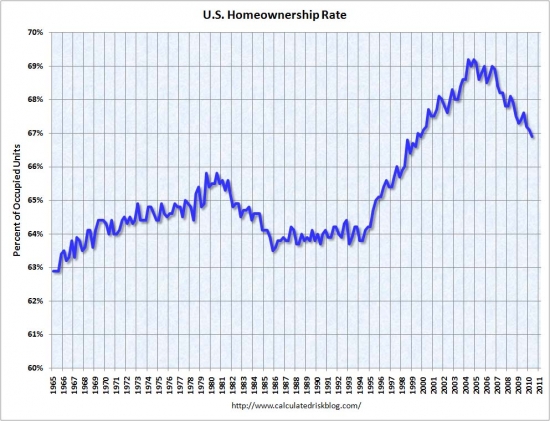
Reverting to the Mean Price
As gauged by an aggregate of housing indexes dating to 1890, real home prices rose 85 percent to their highest level in August 2006. They have since declined 33 percent, falling short of most predictions for a cumulative correction of at least 40 percent.[1] In fact, home prices still must fall 23 percent if they are to revert to their long-term mean (Chart 1). The Federal Reserve’s purchases of Fannie Mae and Freddie Mac government-sponsored-entity bonds, which eased mortgage rates, supported home prices. Other measures included mortgage modification plans, which deferred foreclosures, and tax credits, which boosted entry-level home sales.

Adjusting for inflation, prices almost certainly will fall. The relationship between inflation and house price that have been stable for over a century doesn't suddenly break down and fail to limit home prices. If we manage to ignite inflation, we may get prices to hold up on a nominal basis, but adjusting for inflation, prices will fall significantly.
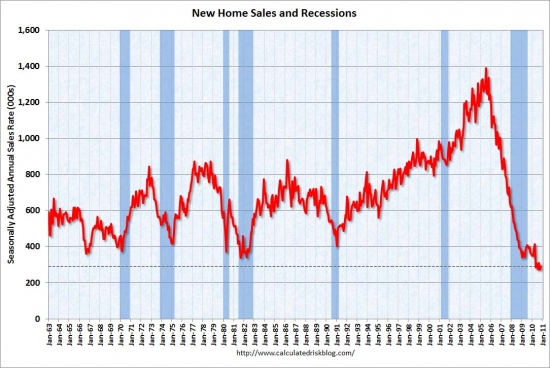
Measuring the success of these efforts is important to determining the trajectory of the economic recovery and providing policymakers with a blueprint for future action. New-home sales data, though extremely volatile, are considered a leading indicator for the overall housing market. Since expiration of the home-purchase tax credit in April, sales have fallen 40 percent to an average seasonally adjusted, annualized rate of 283,000 units. This contrasts with the three years through mid-2006 when monthly sales averaged 1.2 million on an annual basis. Before the housing boom and bust, single-family home sales ran at half that pace. Because current sales are at one-fifth of the 2005 peak, new-home inventories—now at a 42-year low—still represent an 8.6-month supply. An inventory of five to six months suggests a balanced market; home prices tend to decline until that level is achieved.
One factor inhibiting the new-home market is a growing supply of existing units. The 3.9 million homes listed in October represent a 10.5-month supply. One in five mortgage holders owes more than the home is worth, an impediment that could hinder refinancings in the next year, when a fresh wave of adjustable-rate mortgages is due to reset. The number of listed homes, in other words, is at risk of growing further. This so-called shadow inventory incorporates mortgages at high risk of default; adding these to the total implies at least a two-year supply.[2]

As predicted, the recasting of Option ARMs and interest-only ARMs is causing many borrowers to stop making payments. Many of those borrowers used that financing because they were in an inflated market. Many of those markets have crashed leaving the borrower deeply underwater and facing a much larger loan payment.
The surprise with the mortgage resets is the lack of foreclosures and foreclosure inventory to push prices lower. Mostly, this is due to amend-extend-pretend and the massive buildup of shadow inventory. These bad loans are out there, and this inventory will eventually make it to the market. How The Lending Cartel Disposes Their REO Will Determine the Market’s Fate. 
The mortgage-servicing industry has struggled with understaffing and burgeoning case volumes. The average number of days past due for loans in the foreclosure process equates to almost 16 months, up 64 percent from the peak of the housing boom. One in six delinquent homeowners who haven’t made a payment in two years is still not in foreclosure.[3] Mounting bottlenecks suggest the shadow inventory will grow in the near term.
Notably, not all homeowners in arrears suffer financial hardship due to unaffordable house payments. Those with significant negative equity in their homes may choose to default even though they can afford to make the payments. Such “strategic default” is inherently difficult to measure; one study found 36 percent of mortgage defaults are strategic.[4] Though the effect is not readily quantifiable, the growing lag between delinquency and foreclosure provides an added inducement for this form of default.
Thinking About Accelerated Default? The Average Squatting Time Is Up to 449 Days.
Mortgage Modification Limits
One set of policies to aid home-owners in dire straits involves mortgage modifications, though these efforts have only minimally reduced housing supplies. The most far-reaching effort has been the Making Home Affordable Program (previously the Home Affordable Modification Program, or HAMP), in effect since March 2009. After only one year, cancellations—loans dropped from the program before a permanent change was completed—eclipsed new modifications (Chart 2). Since March, the number of cancelations has continued to exceed new trial modifications, which involve eligibility and documentation review, and successful permanent modifications.

In short, to the surprise of no one, the government run loan modifications programs have been a total failure by any performance metric.
The fact that many mortgage holders have negative equity in their homes stymies modification efforts. In the case of HAMP, the cost of carrying a house must be reduced to 31 percent of the owner’s pretax income. Even if permanent modification is achieved, adding other debt payments to arrive at a total debt-to-income ratio boosts the average participant’s debt burden to 63.4 percent of income. In many cases, the financial innovations of the credit boom era, enabling owners to monetize home equity, encouraged high aggregate debt.
You have to love academic writing. Note the euphemism “enabling owners to monetize home equity” when they meant that banks were giving out free money under the guise of “innovation.” The Fallacy of Financial Innovation.
A study found that in a best-case outcome, 20 to 25 percent of modifications will become permanent.[5] In 2008, one in three homeowners devoted at least a third of household income to housing; one in eight was burdened with housing costs of 50 percent or more.[6] Failed modifications suggest that, without strong income growth, the bounds of affordability can be stretched only so far.
Let's stop for a moment to ponder the math: if best-case scenario is for 20% to 25% of loan modifications to work, then at least 75% will fail. With around 10 million distressed loans, at least 7.5 million of them will not cure through loan modification. Far fewer will cure through paying back the loan balance, so that leaves short sale and foreclosure. Since most short sales fail, that leaves only foreclosure. We will see a lot more foreclosures than pundits are willing to admit.
Without intervention, modest home price declines could be allowed to resume until inventories clear. An analysis found that home prices increased by about 5 percentage points as a result of the combined efforts to arrest price deterioration.[7] Absent incentive programs and as modifications reach a saturation point, these price increases will likely be reversed in the coming years. Prices, in fact, have begun to slide again in recent weeks. In short, pulling demand forward has not produced a sustainable stabilization in home prices, which cannot escape the pressure exerted by oversupply (Chart 3).

The data clearly shows the fake prosperity of the tax credit, and the devastating impact of its expiration.
Lingering Housing Market Issues
About 3.6 million housing units, representing 2.7 percent of the total housing stock, are vacant and being held off the market. These are not occasional-use homes visited by people whose usual residence is elsewhere but units that are vacant year-round. Presumably, many are among the 6 million distressed properties that are listed as at least 60 days delinquent, in foreclosure or foreclosed in banks’ inventories.
Recent revelations of inadequately documented foreclosures and the resulting calls for a moratorium on foreclosures—what was quickly coined “Foreclosuregate”—threaten to further delay housing market clearing. While home price declines may be arrested as foreclosure paperwork issues are resolved, the buildup of distressed supply will only grow over time.
Lenders are hoping the inventory problems will simply resolve themselves as a resurgent economy sparks a great deal of household formation and sparks demand for a huge inventory of empty houses. It isn't going to happen.
Perhaps less obviously, some lenders with the means to underwrite new mortgages will remain skeptical about the underlying value of the collateral.
This is the real problem with delaying the bottom. Other than the FHA or the GSEs which are backed by the government, who else is confident enough about the stability of home values to take risk with new home loans? Nobody is. That's why the combined government programs now account for about 99% of the housing market. It is also why very few jumbo loans are being originated.
With nearly half of total bank assets backed by real estate, both homeowners on the cusp of negative equity and the banking system as a whole remain concerned amid the resumption of home price declines.[8] This unease highlights the housing market’s fragility and suggests there may be no pain-free path to the eventual righting of the market. No perfect solution to the housing crisis exists.
Fix the Housing Market: Let Home Prices Fall.
The latest price declines will undoubtedly cause more economic dislocation. As the crisis enters its fifth year, uncertainty is as prevalent as ever and continues to hinder a more robust economic recovery. Given that time has not proven beneficial in rendering pricing clarity, allowing the market to clear may be the path of least distress.
May be the path of least distress? The band aid analogy is best. We should have ripped the band aid off and been done with the pain. Instead, we have gone through heroic efforts to prop up prices and merely spread out the pain over a longer timeframe. The insolvent bankers undoubtedly like the path we chose. I, for one, think it was a mistake.
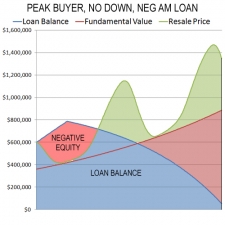
Peak buyer trying to save what she can
As people abandon hope of another market rally to save them and their finances, they take a hard look at their expenses and ask, “Why are we paying so much for this mortgage?” If there is no additional return on their investment, many will lose faith in rapid appreciation and sell out. It's all part of the capitulation process.
Today's featured property was purchased on 4/20/2007 for $673,000. The owner used a $538,400 first mortgage and a $134,600 down payment. If she gets her asking price and pays commission, she loses about $50,000. So for the last four years, she has been paying far more in cost of ownership than the cost of rental, and she is going to lose another $75,000 to the market. I imagine she thinks that sucks.
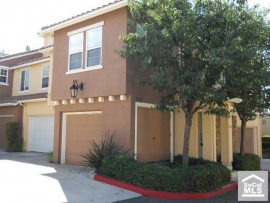
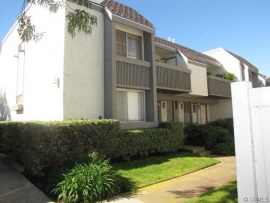
Irvine Home Address … 12 PLEASONTON Irvine, CA 92620 ![]()
Resale Home Price … $660,000
Home Purchase Price … $673,000
Home Purchase Date …. 4/20/2007
Net Gain (Loss) ………. $(52,600)
Percent Change ………. -7.8%
Annual Appreciation … -0.5%
Cost of Ownership
————————————————-
$660,000 ………. Asking Price
$132,000 ………. 20% Down Conventional
5.02% …………… Mortgage Interest Rate
$528,000 ………. 30-Year Mortgage
$136,971 ………. Income Requirement
$2,841 ………. Monthly Mortgage Payment
$572 ………. Property Tax
$0 ………. Special Taxes and Levies (Mello Roos)
$110 ………. Homeowners Insurance
$70 ………. Homeowners Association Fees
============================================
$3,593 ………. Monthly Cash Outlays
-$487 ………. Tax Savings (% of Interest and Property Tax)
-$632 ………. Equity Hidden in Payment
$258 ………. Lost Income to Down Payment (net of taxes)
$83 ………. Maintenance and Replacement Reserves
============================================
$2,815 ………. Monthly Cost of Ownership
Cash Acquisition Demands
——————————————————————————
$6,600 ………. Furnishing and Move In @1%
$6,600 ………. Closing Costs @1%
$5,280 ………… Interest Points @1% of Loan
$132,000 ………. Down Payment
============================================
$150,480 ………. Total Cash Costs
$43,100 ………… Emergency Cash Reserves
============================================
$193,580 ………. Total Savings Needed
Property Details for 12 PLEASONTON Irvine, CA 92620
——————————————————————————

Beds: 3
Baths: 2 full 1 part baths
Home size: 1,703 sq ft
($388 / sq ft)
Lot Size: 4,000 sq ft
Year Built: 1985
Days on Market: 209
Listing Updated: 40540
MLS Number: S620211
Property Type: Single Family, Residential
Community: Northwood
Tract: Othr
——————————————————————————
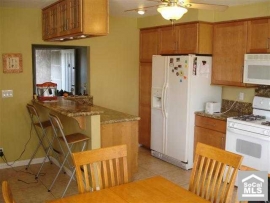
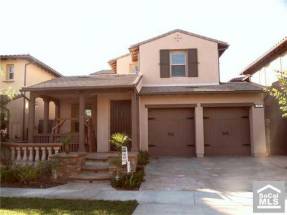
EQUITY SALE!! NOT REO!! NOT Short Sale!! Beautiful Northwood area. NO MELLO ROOS! LOW tax rate. HOA $70/mo. Single Family Detached Former Model Home. Bright open floor plan, lots of windows, plantation shutters, custom cabinets & crown molding. Beautiful hardwood floors. Living Rm & Dining Rm w/ vaulted ceiling. Family Rm w/ fireplace, custom computer center & sliding French door. Kitchen w/ custom cabinets & Italian tile floor. Master Bedrm w/ walk-in closet & vaulted ceiling. Jetted Tub. Brick patio w/ patio cover, 2 car garage w/ roll-up garage doors & cabinets. Laundry Rm w/ custom cabinets. Across Assoc bbq, tot lot, swimming pool/spa & Orchard Park w/ basketball courts, playground, bbq, picnic area, baseball/soccer field. Walk to tennis courts, parks, aquatic center, library, stores, schools. Great Irvine Unified School District Award Winning Schools. Minutes from OC beaches, museums, Irvine Spectrum, District, Tustin Marketplace, Fashion Island, South Coast Plaza & Great Park.
.


 In Las Vegas where prices are very affordable, a small decrease in affordability will not make much difference; however, in inflated California markets where every penny of affordability is needed to support pricing, rising interest rates will be a serious problem.