Mortgage rates have been heading higher for the last month. Have we reached the bottom of rates for this cycle?
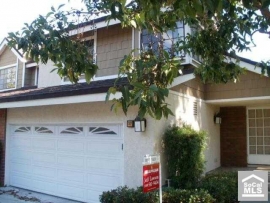
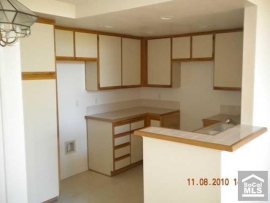
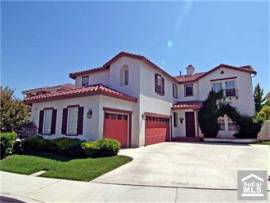
Irvine Home Address … 37 WEEPINGWOOD Irvine, CA 92614
Resale Home Price …… $475,000

All the way up
All the way down
Never look back
It's time to breakout
I want it my way
That's right
It's a temporary life
It's a ride
That takes you all the way up
All the way down
Never look back it's time to breakout
Emily Osmet — All The Way Up
A couple of weeks ago, I noted that Bond Market Selloff Makes Mortgage Rates Rise. Many expected the knee-jerk market reaction to be reversed and the downward trend in interest rates to resume. It doesn't appear to be working out that way. Have interest rates bottomed for this cycle?
Zillow: 30-year mortgage rates hit five-month high

The 30-year, fixed-rate mortgage spiked to the highest point in five months, up 20 basis points to 4.5% from the week prior, according to the Zillow Mortgage Marketplace weekly update. This is the second consecutive week the rate increased.
Zillow said the current 15-year, fixed-average rate is 3.89% and the rate for a 5-1 adjustable-rate mortgage is 3.1%. That type of mortgage maintains a steady rate for five years and then is adjusted annually thereafter.
Regionally, 30-year rates vary, but the majority of states witnessed a dramatic inflation. Massachusetts' average rate spiked to 4.61% from 4.3% prior. Rates in California also increased substantially to 4.47% from 4.32% the previous week, while New York's rate increased to 4.53% from 4.31%, and Texas saw its average rate rise to 4.44% from 4.24%.
The current rate in Washington increased week-over-week to 4.5% from 4.24%, as did Illinois' rate, up to 4.4% from 4.23%. Rates in Florida are up close to the national average at 4.48% from 4.33%, and rates in Pensylvania rose to 4.43%.
Colorado's average rate for a 30-year FRM decreased one basis point to 4.47%.
Zillow bases its averages on real-time mortgage quotes from lenders registered with the company. The national average comes from thousands of daily quotes by anonymous borrowers through the Seattle-based company's website.
Write to Christine Ricciardi.
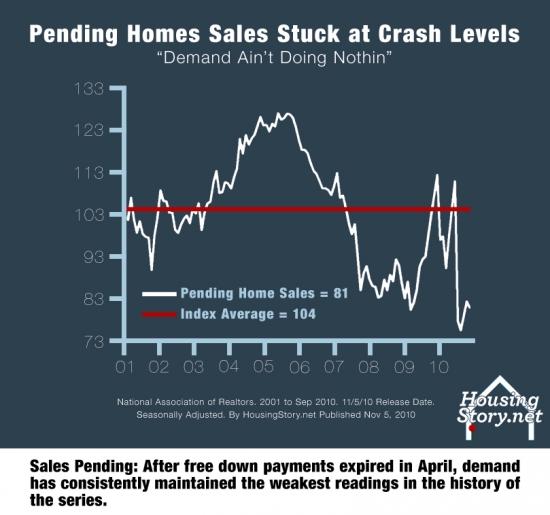
About a month ago, I wrote Low Interest Rates Will Not Create Demand. Each week as I write posts, I check the current interest rate to calculate the total cost of ownership. If you look back through the archives, you can see what the bankrate.com published interest rate was for that week. A month ago it was 4.29%. The low was 4.21%. Last Friday, the rate was 4.71%. That represents a 12% increase in borrowing costs in a little over a month. Since the mortgage payment is by far the biggest cost of ownership, rising interest rates take their toll on afffordability. That will also put pressure on prices.![]()
Don't worry because…
Mortgage Rates Are All in Your Head
By: Diana Olick — Monday, 6 Dec 2010
It's like home buyers today are suffering from post-traumatic stress disorder.
The housing crash, foreclosure crisis and banking scandals have all combined to make buyers more sensitive than ever before.
That's why the slightest fluctuation in mortgage interest rates have huge emotional power today.
That and the fact that realtors will use low interest rates as a scare tactic. From Urgency Versus Reality: realtors Win, Buyers Lose:
realtor Reason Du Jour
The marketing presentation I attended had many examples of how to manipulate the current situation to create urgency when none exists. One of these pertains to the inevitability of rising interest rates, and it goes something like this:
If a buyer is looking at a $400,000 home, very low interest rates make the payment affordable, but when interest rates go up, it will be harder and harder to finance that $400,000 home. In fact, if interest rates go up a full point, a buyer might lose as much as $100,000 in buying power; therefore, you should buy before interest rates go up.
Hmmm… I nearly raised my hand to ask a follow up question but then I contemplated who my audience was and what they understand about real estate markets and finance, I decided against it. I ask the question here:
OK, if I buy today, the buyer who wants to purchase the house from me in the future when I am ready to move may not be able to borrow as much money. Won't that make my house harder to sell, and might I have to lower the price — a great deal — like the $100,000 mentioned in the example? Isn't the fact that my take-out buyer is going to be much less leveraged working against me?
We all know the answer to those questions (Your Buyer’s Loan Terms), and that was when I had an epiphany: the realtor mind is unconcerned with reality, it is only concerned with urgency, and if urgency conflicts with reality, urgency wins, and buyers lose. Buyers are supposed to believe the realtor cares and that they are looking out for the buyer's best interest; beliefs wholly incompatible with a realtor Mind®™ that places urgency over honesty.
Back to the article.
"I think some people get a little fearful of what the higher payment might mean to them but they don’t' realize how minimal the difference might be," notes Eric Gates, President of Apex Home Loans in Rockville, MD.
In fact, Gates did a little math for me on the change in your monthly payment at different interest rates, if you buy a $200,000 home (just above the national median) with 20 percent down.
- 4.25%: $787.10
- 4.5%: $810.70
- 4.75%: $834.64
- 5.0%: $858.91
"Keep in mind that difference is mainly interest which is tax deductible. So, someone paying an extra $24 a month in interest who is in a 25% tax bracket is really only paying an extra $18 a month after the tax write off of the extra interest," Gates adds. Yes, cutting the mortgage interest deduction is currently being debated as a deficit-reducer, but the proposal is to reduce the cap from $1 million to $500,000, so it's not going to affect the buyers I'm using as an example here.
The fact is that we're talking less than $100 a month, for a full percentage point increase.
Wait just a minute. Early in 2009, I explored the impact of rising interest rates in 4.5% Mortgage Interest Rates?
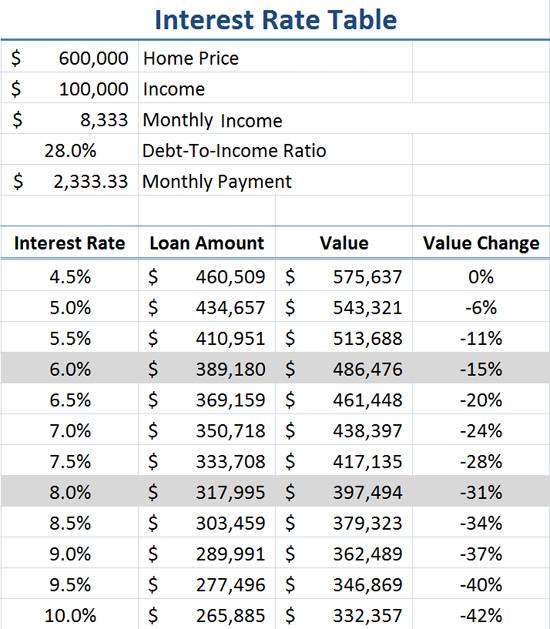
Since most people finance to the maximum allowed by a lender to get the most expensive home they can acquire, the it doesn't matter if the payment differential is small, any change is going to impact the total amount of the loan. That is what impacts house prices.
As has been pointed out in the comments, the impact of rising interest rates will be felt most where affordability is a problem. Right now in Las Vegas, the low end is trading 30% to 50% below rental parity. If interest rates go up, current price levels are still very affordable. People do not need to reach for the starts to buy what they can rent. The same is true in areas that did not bubble and continue to enjoy relative affordability.
Contrast that to Orange County were the fringe of the market were prices are estaablished is pushed to the maximum limit of income affordability. In that circumstance, rising interest rates will reduce loan balances, and the weight of inventory will cause prices to fall to the new lower limit of affordability.
Obviously big cities or in-demand housing markets, where home prices are far higher than the national average, will see bigger jumps in their monthly payments, but if they're able to afford the higher priced home, the change in monthly payment would likely be comparable in its impact on their overall budget.
The problem is that people in high prices areas like Orange County cannot afford the higher priced home. They never could.
So why, then, do mortgage purchase applications fall every time rates go up slightly and the opposite when they go down??
The answer is that it is largely emotional. Home buyers seem to ignore what they can afford and focus instead on what they think they somehow deserve in today's badly beaten market.
"Instead of focusing on what's my payment going to be, they see that their friend got 4.25 and they want that same rate and 4.5 isn't 4.25 and they think 'that's not good enough'," says Gates, who has seen that happen more than once. Fear of unemployment also looms large, so buyers are much more careful with monthly payment calculations, even trying to make sure that if they are out of work temporarily they can still make the payments and not go into default.

People should not be focused on what their payment is going to be. That is part of what got us into this mess. Option ARMs made sky-high prices affordabie on a payment basis. Albeit temporarily.
So what do you think? Have we seen the bottom of the mortgage interest rate cycle, or will we see under 4% mortgage interest rates?
Take the free money. What could go wrong?
Borrowers took the free money offered to them by banks for the appreciation of thier house. Many thought, "what could go wrong?" Real estate always goes up, right? Who is to blame for borrower stupidity?
Many who want to see the banks come to ruin are portraying the borrowers as hapless victims of predatory lending. This assertion is only half true. Lenders did indeed induce borrowers to take on excessive debts. Lenders did not do this to profit from the foreclosure — those have been big losers — but to profit from the origination fees. The idea that borrowers are somehow blameless in this matter is the part that irritates me.
Borrowers knew it was a loan. They knew they were borrowing hundreds of thousands of dollars they would need to pay back. Many of them believed the house would pay it — or more accurately stated, the future buyer of thier house would pay it. But whatever foolish beliefs borrowers had, they were still responsible for taking out the loans. They borrowed all the equity from their houses and spent it. When people make such a foolish mistake, the consequences are foreclosure and bankruptcy. Life goes on.
The owners of today's featured property bought back in 1992. After 18 years of loan ownership, they lost their house in foreclosure due to their excessive borrowing. Do you think they will learn their lesson, or will they blame the banksters or the housing market gods? Human nature being what it is, some will take responsibility for their actions, but most will play the victim and blame someone else.
- This property was purchased on 5/29/1992 for $207,000. The owners mortgage information is not available, but it was likely a $165,600 first mortgage and a $41,400 down payment.
- On 10/15/1998 they took out a stand-alone second for $37,500.
- On 3/1/2002 they refinanced with a $252,000 first mortgage.
- On 7/1/2004 they refinanced with a $315,000 first mortgage.
- On 7/14/2006 they refinanced with a $400,000 first mortgage.
- On 11/13/2007 they refinanced with a $429,000 Option ARM.
- Total mortgage equity withdrawal is $263,400.
-
Total squatting time was about 19 months.

Foreclosure Record
Recording Date: 11/13/2009
Document Type: Notice of Sale
Foreclosure Record
Recording Date: 06/25/2009
Document Type: Notice of Default
The property was purchased at auction on 10/29/2010 for $390,000. The flipper wasted little time getting the property on the market.
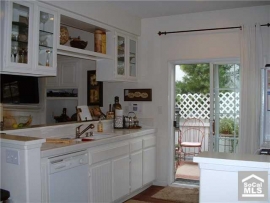
Irvine Home Address … 37 WEEPINGWOOD Irvine, CA 92614 ![]()
Resale Home Price … $475,000
Home Purchase Price … $207,000
Home Purchase Date …. 5/29/1992
Net Gain (Loss) ………. $239,500
Percent Change ………. 115.7%
Annual Appreciation … 4.5%
Cost of Ownership
————————————————-
$475,000 ………. Asking Price
$16,625 ………. 3.5% Down FHA Financing
4.71% …………… Mortgage Interest Rate
$458,375 ………. 30-Year Mortgage
$95,132 ………. Income Requirement
$2,380 ………. Monthly Mortgage Payment
$412 ………. Property Tax
$0 ………. Special Taxes and Levies (Mello Roos)
$79 ………. Homeowners Insurance
$305 ………. Homeowners Association Fees
============================================
$3,176 ………. Monthly Cash Outlays
-$387 ………. Tax Savings (% of Interest and Property Tax)
-$581 ………. Equity Hidden in Payment
$30 ………. Lost Income to Down Payment (net of taxes)
$59 ………. Maintenance and Replacement Reserves
============================================
$2,297 ………. Monthly Cost of Ownership
Cash Acquisition Demands
——————————————————————————
$4,750 ………. Furnishing and Move In @1%
$4,750 ………. Closing Costs @1%
$4,584 ………… Interest Points @1% of Loan
$16,625 ………. Down Payment
============================================
$30,709 ………. Total Cash Costs
$35,200 ………… Emergency Cash Reserves
============================================
$65,909 ………. Total Savings Needed

Property Details for 37 WEEPINGWOOD Irvine, CA 92614
——————————————————————————
Beds: 3
Baths: 2 full 1 part baths
Home size: 1,585 sq ft
($300 / sq ft)
Lot Size: n/a
Year Built: 1981
Days on Market: 22
Listing Updated: 40511
MLS Number: S638763
Property Type: Condominium, Residential
Community: Woodbridge
Tract: Pw
——————————————————————————
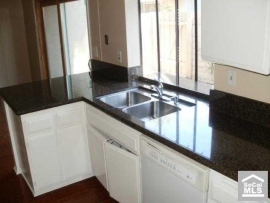
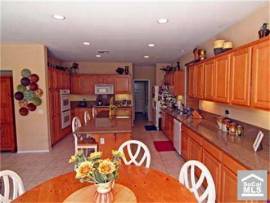
Complete Turnkey Property!!! Charming And Private End Unit With 3 Bedrooms, 2 1/2 Bathrooms, New Carpet And Paint, Granite Countertops, Hardwood Floors And A Serene Back Patio Setting.


 Beautifully maintained with laminate wood floors & upgraded neutral carpet & paint. Gourmet kitchen with sparkling white tile counters & white cabinetry opens to living room & dining area. Living room features a cozy gas fireplace, & built-in media unit. French doors open to a secluded front porch area. The dining nook features built-in seating & shelves. From the kitchen, enter a serene garden w/patio area, & wrap around yard- great for relaxing & entertaining. Custom window coverings accent the home. Located on a quiet interior cul de sac street, with one of the larger lots for this floorplan. Association amenities include heated pool, lighted tennis courts, sport courts, playground areas, BBQ's. Walking distance to award winning schools-Canyon View Elem., Northwood High. Close to Tustin & Irvine Marketplace for dining, shopping, entertainment.

.jpg)


.jpg)
