Was I right, wrong, or somewhere in between. Let's review the data, and I will let you decide.
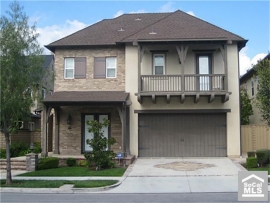
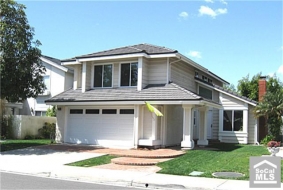
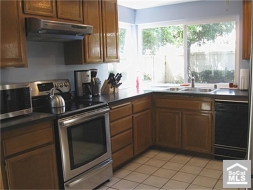
Irvine Home Address … 184 PINEVIEW Irvine, CA 92620
Resale Home Price …… $196,000
I believe I can see the future
Because I repeat the same routine
I think I used to have a purpose
Then again, that might have been a dream
Nine Inch Nails — Every Day is Exactly the Same
Groundhog Day is one of my favorite movies. Every day is exactly the same. One of the reasons I enjoy Southern California so much is because I rarely change my outdoor plans due to the weather. Every day is beautiful. Yesterday was, and tomorrow will be as well.
It will feel like groundhog day here over the next few years as we work through the inventory issues. I will offer the same advice: don't buy unless you plan a long-term hold. I will say that until the number of foreclosures gets down near zero, and the backlog of unprocessed bad loans is complete. I don't know how these bad loans will be resolved. I believe foreclosure will resolve most of them, but we may see some form of principal forgiveness become more common before this crisis is truly behind us. I hope not.
My beginning at the IHB
Many of you may not remember that I was not an original writer at the IHB. Zovall and IrvineSingleMom were the two first writers. When they asked me to write, I just started, and I haven't stopped. I don't know where the energy or inspiration comes from, but I do enjoy exploring this artform… or is it a news media…
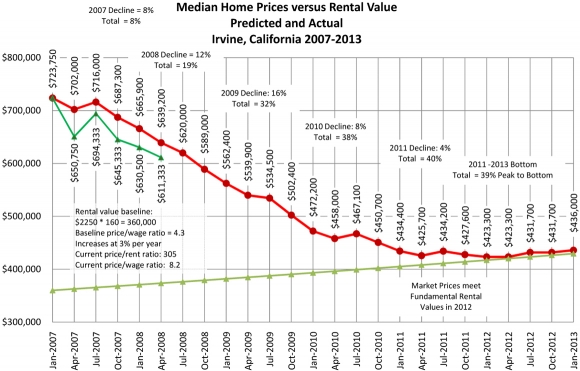
Back on February 27, 2007, I loudly proclaimed we were at the top of the market and that prices were going to crash. I wasn't offering a weak warning that prices might go down a little bit, I was boldly stating prices were going to crash — hard. It was going to be a catastrophe. It was important news.
Of course, when i made these proclamations, I was roundly criticized as a fool who didn't know what he was talking about (read some of the old comments). In order to provide some credibility to my assertions, I wrote a series of analysis posts:
In that post, I went on to list the main factors that will influence the timing and the depth of the decline:
Percentage of Income Put Toward Housing Payments
Interest Rates
Foreclosures
Adjustable Rate Mortgage Time Bombs
Government Intervention
I wrote that back in early 2007 before we had any of the following:
loan modifications which focus on DTI ratios,
federal reserve buying mortgage paper to influence interest rates,
foreclosures that reached maximum market absorption levels,
ARM resets contributing to delinquencies which are now in shadow inventory, and
The federal government nationalizing the housing market by taking the GSEs into conservatorship.
On August 25, 2008, I revisited my prediction in I Was Wrong, It’s Worse… It had the updated results through April of 2008.
The initial stages of the crash were surprising in the rapidity of the declines. Irvine's real estate market had experienced patches of weakness, but it avoided most of the 18% statewide decline in the early 90s. Predicting any decline ran the risk of stubborn sellers and sticky prices preventing a decline. By mid 2008, even the most stubborn bulls realized they had no idea what they were talking about back in 2006. They weren't just a little wrong, they were debt-up-to-their-eyes wrong about the direction of house prices.
How wrong was I?
I just obtained the updated median home sales prices for Irvine to see how my predictions compared to what really happened.
Prices did not fall as much as I predicted, not because my reasoning was flawed, but because unforeseeable and unprecedented efforts by bankers and the government delayed the drop, and may have averted a much deeper drop.
I say these events were unforeseeable and unprecedented, but some may argue that such extremes were inevitable. I have no way to counter that point. However, I can say that few predicted those events in advance of when the rumors became news. Any forecaster out there who foresaw those events and accurately gaged their impacts is far better than I am.
What happened in 2008 to slow the drop in prices?
Two events in 2008 marked important turning points for the market. First, in early 2008 nearly every housing market in the country reached and exceeded its capacity to absorb foreclosures without pushing prices lower. And second, in late 2008, the Treasury department went against 40 years of government statements and took over the GSEs and backstopped the GSEs bad debts. The public was absorbing the losses of private enterprise just like with AIG.
In the last housing bubble on the late 80s-early 90s, lenders foreclosed on delinquent borrowers without delay. There was no shadow inventory. The number of foreclosures did push prices lower, but they were not so overwhelming that prices crashed. In early 2008, the number of foreclosures simply overwhelmed the number of buyers, and prices plummeted. Banks had a decision to make: 1. keep foreclosing and push prices back to the 90s, or stop foreclosing and accumulate a shadow inventory of delinquent mortgage squatters. They chose the latter.
In late 2008, in response to a balance sheet in tatters and mounting losses, the Treasury Department took over the GSEs. by the end of the year, between the FHA and the GSEs, the federal government controlled about 98% of the mortgage market.
Once the government controlled the delivery mechanism for home loans, the only thing they needed was someone willing to buy those loans at high prices, and they could support prices at levels higher than a free market would bear. The patsy to buy home loans in a depreciating market turned out to be the Federal Reserve.
What happened in 2009 to slow the drop in prices?
When the Federal Reserve began its program to buy $1.2 trillion in mortgage-backed securities, it knew it was buying toxic crap, but the with an infinite balance sheet from the ability to print money, they are uniquely suited to absorb these losses — losses their member banks cannot afford to take. In essence, they printed enough money to paper over what was destroyed through lender losses.
Since 2009, the government has been in total control of the housing market. They remain in control to this day. There is talk in Washington about reform, but since any subsidy removal will lower prices and increase bank losses, any transition will happen slowly.
I was wrong: It's better
I was clearly wrong. Prices did not fall as far as I said they would. But how wrong was I?
If prices only fell 2/3 of the amount I projected, was I 1/3 wrong? If prices are 50% below expectations, how wrong am I. Was I at least 66% right?
46% off at the low end
Whatever becomes of the median, it is clear that prices of low-end properties have fallen dramatically. The owner who paid $342,000 for this property in 2006 certainly didn't think it would be worth less than $200,000 in 2011. He was wrong too. However wrong I am, it isn't as painful for me as it is for this former owner.
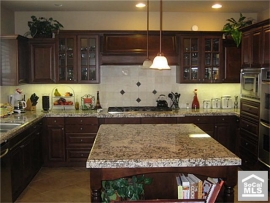
Irvine Single Family Attached Home. 2 Story with large living room, tile flooring, new wall paint, new kitchen appliances, new furnace, new carpet, and more. TURNKEY! Upstairs Bedroom and Bathroom. Rear Patio and laundry closet for full sized washer and dryer. Close to restaurants, shopping, schools, and more. HOA dues include trash and water. Carport # 199.
During the Great Housing Bubble, people knowingly lied about their income in order to buy homes. The practice was so common, the loan programs became known as liar loans. I described liar loans back in 2008:
“The Road to Hell is Paved with Good Intentions.” — Samuel Johnson. Most people who took out a “liar loan” did so to provide shelter for their families and hopefully make a few dollars speculating in real estate. Most people did not intend to defraud anyone when they took out the loan, but they ended up doing so by walking away from their payment obligations. This Highway to Hell is paved with good intentions, and it is very well traveled.
State Income Loans
One unique phenomenon of The Great Housing Bubble was the utilization of state-income loans, also known as “liar loans” because most people were not truthful when stating their income. Loan documentation is usually a routine part of obtaining financing. Lenders ordinarily require a borrower to provide documentation proving income, assets and debt. However, during the final stages of the Great Housing Bubble, loan documentation was seen as an unnecessary barrier to completing more transactions, and loan programs which circumvented normal documentation procedures flourished. The fact that these programs existed at all is a remarkable proof of the risk lenders were taking through the relaxing or outright elimination of lending standards. According to a study by Credit Suisse, 81% of Alt-A purchase originations in 2006 were stated income, and 50% of subprime originations in 2005 and 2006 were stated income. Stated income loans increased from 18% of originations in 2001 to 49% in 2006 according to Loan Performance. In a related study by the Mortgage Asset Research Institute, 60% of stated-income borrowers had exaggerated their incomes by more than 50%. …
The stated-income loan, also known as liar loan due to the built-in incentive to exaggerate one’s income, was originally provided to borrowers such as the self-employed who most often do not have W-2s to verify income. When these loan programs were first started, they were not made available to borrowers with W-2s as the transparency of the lie would have been obvious to all parties. During the bubble rally, these loans were made available to anyone, and not just were the borrowers encouraged to lie, they were often assisted in fabricating paperwork by aggressive loan officers and mortgage brokers. Since the loan could be packaged and sold to investors who had no idea what they were buying, there was a complete lack of concern for whether or not the borrower actually made the money stated in the loan application and thereby could actually make the payments on the loan. Everyone involved was making large fees, the borrower was obtaining the real estate they desired, and for a time, the investor was receiving payments from the borrower. As long as prices were rising, everyone benefited from the arrangement. Of course, once prices started to fall, borrowers did not want to continue making payments they could not afford, and the whole system collapsed in a massive credit crunch.
Liar loans went away, but as fate would have it, the reverse liar loan appeared shortly thereafter.
Everyone is doing loan modifications now: Citibank, the GSEs, everyone. They must. … Part of the loan workout requires the borrower to demonstrate they are unable to make payments, and their income is going to be used to figure out how much principal reduction and other loan terms the bank will adjust to accommodate them. I think you can see where this is going… All the people who exaggerated their incomes to obtain more house than they can afford, are now trying to look as poor as Church mice to get the biggest mortgage principal reduction they can: the reverse liar loan. They lied to get in, now they get to lie in order to keep it. We have a great system in place, don't you think?
For every irresponsible borrower, there was a foolish lender who enabled them. Imagine this, you stand on a street corner and had out $20 bills to anyone who promises to pay you back. When most of the people spend the money and don't pay you back, were they immoral for lying to you, or were you stupid for giving them your money?
Lenders are more culpable than borrowers. The power imbalance in the lender-borrower relationship puts greater responsibility on the lender. It stands on principles of fairness that lenders should bear the brunt of the losses, the tarnished image, and other collateral damage associated with such a colossal group failure. The reality is that lenders are getting big bonuses, they aren't foreclosing on each other's houses, they are getting tax bailout money, and they are just as rich and powerful as they were before the disaster of their making. It isn't working out so well for the little guy.
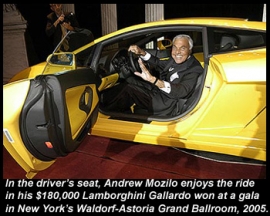
A few weeks ago, when the Justice Department decided not to prosecuteAngelo Mozilo, the former chief executive of Countrywide, I wrote a column lamenting the fact that none of the big fish were likely to go to prison for their roles in the financial crisis.
Soon after that column ran, I received an e-mail from a man named Richard Engle, who informed me that I was wrong. There was, in fact, someone behind bars for what he’d supposedly done during the subprime bubble. It was his 48-year-old son, Charlie.
On Valentine’s Day, the elder Mr. Engle said, his son had entered a minimum-security prison in Beaver, W.Va., to begin serving a 21-month sentence for mortgage fraud. He then proceeded to tell me the tale of how federal agents nabbed his son — a tale he backed up with reams of documents and records that suggest, if nothing else, that when the federal government is truly motivated, there is no mountain it won’t move to prosecute someone it wants to nail. And it was definitely motivated to nail Charlie Engle.
There is no way to know what prosecutors real motivations were for bringing a case. From their point of view, with the information they had, this case looks quite different. It's always a good idea to preface these stories with a reality check because a good writer will lead you down the path before you know it.
Mr. Engle’s is a tale worth telling for a number of reasons, not the least of which is its punch line. Was Mr. Engle convicted of running a crooked subprime company? Was he a mortgage broker who trafficked in predatory loans? A Wall Street huckster who sold toxic assets?
No. Charlie Engle wasn’t a seller of bad mortgages. He was a borrower. And the “mortgage fraud” for which he was prosecuted was something that literally millions of Americans did during the subprime bubble. Supposedly, he lied on two liar loans.
Prosecutors like to get a few high-profile scalps as a deterrent to others considering similar crimes. The utility of a few important prosecutions can go far beyond the resources devoted. Apparently, someone singled out this guy to be the poster child for liar loans. I think Casey Serin would have been a better target.
“The Department of Justice has made prosecuting financial crimes, including mortgage fraud, a high priority,” said Neil H. MacBride, the United States attorney for the Eastern District of Virginia, in a statement. (Mr. MacBride, whose office prosecuted Mr. Engle, declined to be interviewed.)
Apparently, though, it’s only a high priority if the target is a borrower. Mr. Mozilo’s company made billions in profit, some of it on liar loans that he acknowledged at the time were likely to be fraudulent and which did untold damage to the economy. And he personally was paid hundreds of millions of dollars. Though he agreed last year to a $67.5 million fine to settle fraud charges brought by the Securities and Exchange Commission, it was a small fraction of what he earned. Otherwise, he walked. Thus does the Justice Department display its priorities in the aftermath of the crisis.
I wrote last year that Countrywide's Mozilo should go to jail. The facts are as presented above. Mozilo is a crook who gamed the system, took his slap on the wrist, and kept his ill-gotten booty. The penalties being doled out to the parties are grossly unfair.
It’s not just that Mr. Engle is the smallest of small fry that is bothersome about his prosecution. It is also the way the government went about building its case. Although Mr. Engle took out the two stated-income loans, as liar loans are more formally called, in late 2005 and early 2006, it wasn’t until three years later that his troubles began.
As a young man, Mr. Engle had been a serious drug addict, but after he got clean, he became an ultra-marathoner, one of the best in the world. In the fall of 2006, he and two other ultra-marathoners took on an almost unimaginable challenge: they ran across the Sahara Desert, something that had never been done before. The run took 111 days, and was documented in a film financed by Matt Damon, who served as executive producer and narrator. Mr. Engle received $30,000 for his participation.
The film, “Running the Sahara,” was released in the fall of 2008. Eventually, it caught the attention of Robert W. Nordlander, a special agent for the Internal Revenue Service. As Mr. Nordlander later told the grand jury, “Being the special agent that I am, I was wondering, how does a guy train for this because most people have to work from nine to five and it’s very difficult to train for this part-time.” (He also told the grand jurors that sometimes, when he sees somebody driving a Ferrari, he’ll check to see if they make enough money to afford it. When I called Mr. Nordlander and others at the I.R.S. to ask whether this was an appropriate way to choose subjects for criminal tax investigations, my questions were met with a stone wall of silence.)
Mr. Engle’s tax records showed that while his actual income was substantial, his taxable income was quite small, in part because he had a large tax-loss carry forward, due to a business deal he’d been involved in several years earlier. (Mr. Nordlander would later inform the grand jury only of his much lower taxable income, which made it seem more suspicious.) Still convinced that Mr. Engle must be hiding income, Mr. Nordlander did undercover surveillance and took “Dumpster dives” into Mr. Engle’s garbage. He mainly discovered that Mr. Engle lived modestly.
In March 2009, still unsatisfied, Mr. Nordlander persuaded his superiors to send an attractive female undercover agent, Ellen Burrows, to meet Mr. Engle and see if she could get him to say something incriminating. In the course of several flirtatious encounters, she asked him about his investments.
After acknowledging that he had been speculating in real estate during the bubble to help support his running, he said, according to Mr. Nordlander’s grand jury testimony, “I had a couple of good liar loans out there, you know, which my mortgage broker didn’t mind writing down, you know, that I was making four hundred thousand grand a year when he knew I wasn’t.”
Mr. Engle added, “Everybody was doing it because it was simply the way it was done. That doesn’t make me proud of the fact that I am at least a small part of the problem.”
A basically honest man who confesses to a seductress, a confession for a crime hundreds of thousands of borrowers were guilty of — and encouraged to commit by lenders — and this is who the government wants to go after? I truly hope the prosecutors had other motives. Calculated Risk also wonders why the prosecutors chose this case.
Unbeknownst to Mr. Engle, Ms. Burrows was wearing a wire.
Lying on a stated-income loan is, without question, a crime, and one ought not to excuse it even though, as Mr. Engle says, “everybody was doing it” — usually with the eager encouragement of their brokers. But the Engle case raises questions not just about the government’s priorities, but about something even more basic: did he even commit the crimes he is accused of?
Partly, I concede, Mr. Engle is easy to root for. He is a personable, upbeat man who has conquered some serious demons. Part of his Sahara expedition was aimed at raising money for a charity to help bring clean water to Africa. “Every experience in life has the ability to teach lessons if I am open to them,” he wrote on a blog as he prepared to enter prison. How can you not like someone like that?
But the more I looked into it, the more I came to believe that the case against him was seriously weak. No tax charges were ever brought, even though that was Mr. Nordlander’s original rationale. Money laundering, the suspicion of which was needed to justify the undercover sting, was a nonissue as well. As for that “confession” to Ms. Burrows, take a closer look. It really isn’t a confession at all. Mr. Engle is confessing to his mortgage broker’s sins, not his own.
Whose crime is this? Isn't the real problem with this whole prosecution that the guilty parties are not being charged? Mr. Engle committed a crime, but the lender who put him up to it is even more responsible.
Perhaps anticipating that problem, when Mr. Nordlander finally arrested Mr. Engle in May 2010, he claims to have elicited a stronger, better confession while Mr. Engle was handcuffed in the back seat of his car. Mr. Engle fervently denies this. This second supposed confession, however, was never captured on tape.
As for the loans themselves, on one of them Mr. Engle claimed an income of $15,000 a month. As it turns out, his total income in 2005, according to his accountant, was $180,000, which amounts to … hmmm …$15,000 a month, though of course Mr. Engle didn’t have the kind of job that generated monthly income. (In addition to real estate speculation, Mr. Engle gave motivational speeches and earned around $50,000 a year as a producer on the hit show “Extreme Makeover: Home Edition.”)
The monthly income listed on the second loan was $32,500, an obviously absurd amount, especially since the loan itself was for only $300,000. It was a refinance of a property Mr. Engle already owned, allowing him to pull out $80,000 of the $215,000 in equity he had in the property.
Mr. Engle claims that he never saw that $32,500 claim and never signed the papers. Indeed, a handwriting analysis conducted by the government raised the distinct possibility that Mr. Engle’s signature and his initials in several places in the mortgage documents had been forged. As it happens, Mr. Engle’s broker for that loan, John J. Hellman, recently pleaded guilty to mortgage fraud for playing fast and loose with a number of mortgage applications. Mr. Hellman testified in court that Mr. Engle had signed the mortgage application. Early this week, Mr. Hellman received a reduced sentence of 10 months, less than half of Mr. Engle’s sentence, in no small part because of his willingness to testify against Mr. Engle.
Even the jurors seemed confused about how to think about Mr. Engle’s supposed crime. When it came time to pronounce a verdict, the jury found him not guilty of providing false information to the bank, which would seem to be the only fraud he could possibly have committed. Yet it still found him guilty of mortgage fraud. “I think the prosecution convinced the jury that I was guilty of something but they weren’t sure what,” Mr. Engle wrote in an e-mail.
Like many people, Mr. Engle’s biggest mistake was believing that housing prices could only go up. When the market collapsed, Mr. Engle defaulted on the two properties, which of course is not a crime. Although his accountant tried to persuade the banks to do a complicated refinancing, they refused and foreclosed on the properties. Like many Americans, Mr. Engle wound up being punished by the market for his mistake, losing all his remaining equity along with the properties themselves. Thanks to the government, though, his punishment was far more severe than most.
So this guy lost everything, and he is being sent to prison. Amazing.
At his sentencing, Mr. Engle told the judge: “I can say with confidence that I can turn negatives into positives. I have no doubt I will make the best of it.” With his inspiring prison blog, Running in Place: A Blog About Surviving Adversity, he has already begun to do that.
Even when he emerges from prison, though, his ordeal will not be over. As part of his sentence, Mr. Engle was ordered to pay $262,500 in restitution to the owner of his mortgages. And what institution might that be? You guessed it: Countrywide, now owned by Bank of America.
Angelo Mozilo ought to get a good chuckle out of that one.
It wouldn't be quite so outrageous for this guy to be forced to pay restitution if the others who did the same thing were similarly compelled. For this one guy to get singled out for such a severe punishment when many others walk away scot-free doesn't serve justice.
That's a big mortgage
High wage earners, like the dentist who owns today's featured property, were given access to copious amounts of credit during the housing bubble. As I have stated on many occasions, high-end pricing did not get where it is by people making large down payments. Prices got so high because lenders were willing to underwrite $3,000,000 loans.
Prior to the housing bubble, loans over $1,000,000 were very rare. Since any amounts over $1,000,000 can't be deducted (assuming the AMT allowed it anyway), very few borrowers took out such large loans.
Prices in the over $1,000,000 range tended to have equity for amounts over $1,000,000. Since equity was necessary to inflate prices, high-end homes tended to be less volatile. However, once lenders started underwriting loans over $1,000,000 prices went up with the lender air, and now with the jumbo market in tatters, lenders are requiring borrowers to document their income which is reducing the borrower pool significantly.
In the story above, the borrower who lied on his income stood out as unusual. Here, the posers blend in with the achievers.
Today's featured property was purchased on 5/9/2006 for $4,288,500. The owner used a $3,000,000 first mortgage, a $200,000 second mortgage, and a $1,088,500 down payment. It is listed as a short sale for $3,500,000.
Ponder that for a moment. There is no NOD filed on this property, yet the owner cannot pay off the two mortgages at a $3,499,999 selling price? The only way the mortgage balance could be that large is if this borrower hasn't made any payments in quite a while. That makes this true shadow inventory. It doesn't appear on any reports, but it's clearly a distressed property working to push prices lower.
SHORT SALE AT END OF CUL-DE-SAC WITH PANORAMIC OCEAN AND CITY LIGHTS VIEW ON ONE LARGEST LOTS IN TURTLE RIDGE WITH ALMOST 20,000 SQUARE FEET * * * LAST TWO SALES WERE $4.05M AND $3.6M FOR LESSER VIEWS AND SMALLER LOTS. HOME FEATURES TWO KITCHENS WITH EXQUISITE FULL BUTLERS PANTRY AND KITCHEN. UPGARDES ARE TOO NUMEROUS TO MENTION BUT INCLUDE HARDWOOD FLOORS, IMPORTED ITALIAN GRANITE, STANLESS STEEL APPLIANCES, INCERDIBLE BBQ PAVILION. GUARD GATED WITH AMAZING AMENITIES THAT INCLUDE FAMILY AND ADULT SWIMMING FACILITIES, GYMNASIUM, HOA BUSINESS CENTER, ENTERTAINMENT THEATRE, HIKING TRAILS AND ACCESS TO AWARD WINNING YEAR AROUND VISTA VERDE SCHOOL AND UNIVERSITY HIGH SCHOOL.
Life is always moving forward. It's time for us to turn the page and embark on a new era at the IHB. But first, a look at one of the reasons we are looking to enhance the IHB experience.
Critics say Realtors' monthly report overly optimistic
By John W. Schoen Senior producer — March 25, 2011
Two high-profile reports on home sales this week confirmed that the housing market is still mired in a deep slump with prices still falling and sales activity sluggish at best. In fact, the market may be in much worse shape than even those numbers suggest.
Figures from the National Association of Realtors that are among the most closely watched indicators on the housing market have been called into question by economists who say they may overstate existing-home sales activity by up to 20 percent.
The issue is more than just an academic dispute among economists. Without a working barometer, it's hard to see the next storm coming.
It's time to take this task away from the NAr and create some bloated and inefficient government bureaucracy to collect and disseminate this data instead. I would rather deal with the problems of government waste than realtor duplicity.
“It's very important for the industry but also for policy makers,” said Mike Fratantoni, head of research at the Mortgage Bankers Association, one of the groups that is challenging the Realtors' data.
“Folks at the Fed and at the Treasury and anyone involved in economic policy throughout government are very concerned about the health of the housing market. So if your primary indicator is giving you an overly optimistic reading, that's cause for concern,” he said.
It's only a concern for those interested in the truth. Accuracy is not as important to realtors as creating a false sense of urgency.
The Realtors, a trade group of licensed real estate agents and brokers, concede that there has probably been some “upward drift” in its numbers since the unprecedented collapse of the housing market in 2006. But Realtors spokesman Walter Molony says the group's data still accurately track the monthly ups and downs of home sales, providing valuable insight into sales trends.
“In terms of broad market characterizations, it's really not that big of a deal,” said Molony.
Not that big a deal? They grossly overstate housing sales numbers to manipulate buyers for purely self-serving reasons, and this is not big deal? I'm sure it's not… to them.
But if the data is as badly flawed as critics fear, it could be a big deal for home buyers and sellers because it could mean prices are more likely to head even lower. That's because an unrealistically optimistic assessment of the pace of home sales could be artificially buoying home prices.
The possible breakdown of the barometer couldn't come at a worse time for the housing industry. After signs of life last year — helped by generous government tax breaks—there are ominous signs that those incentives simply pulled future sales forward.
Analysts have theorized that new-home sales have been hurt because prices of existing homes have fallen more quickly, making them relative bargains. But analysts have been unsettled by data suggesting that the housing market is headed into another leg down for sales and prices.
“This is really unknown territory for us,” said Evan Barrington, head of economic analysis at The Stephenson Company, a market research firm. “We haven’t been through this before.”
'Upward drift'
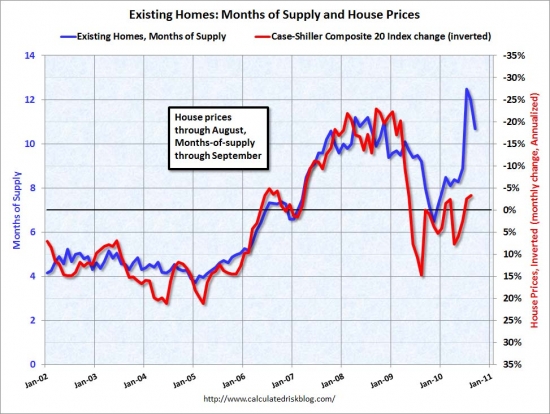
One reason for concern about the Realtors' data is that when assessing the outlook for future sales, forecasters rely heavily on the inventory of homes on the market, which is generally expressed in number of “months' supply.”
That number is derived by comparing the number of unsold homes and the current pace of sales. Prices tend to be fairly stable when the market has about six to eight months' worth of unsold homes. Tighter supplies tend to push prices higher, bigger supplies tend to depress prices.
According to the NAR's latest monthly data, the number of unsold homes in February represents an 8.6-month supply at the current sales pace, based on an annual sales rate of 4.88 million.
But other measures — including mortgage data tracked by the mortgage bankers, show a much lower sales pace. Private research firm CoreLogic, which counts closings filed in more than 2,000 counties, says the pace of home sales in February was just 3.6 million units on an annual basis. If true, that means the inventory of unsold houses is more like 17 months' supply, or roughly double the level reported by the NAR, according to Mark Fleming, chief economist at CoreLogic.
“(Overstating the pace of homes sales) makes a big difference in terms of that month's supply measure,” said Fleming. “That implies significant downward price pressure — which we're actually observing. Prices are falling month over month — and year over year again — at a pretty significant pace at the moment.
So what could account for such a substantial overcounting of home sales?
The desire to lie. realtors feel the need to puff the market with bogus statistics. The rest is merely the mechanics of the deception.
To begin with, monthly statistics like home sales data are the murky underpinnings of economics – a prime example of why it's called the “dismal science.” Almost all economic statistics — from widely watched employment data to more obscure measures of industrial output – are only estimates based on data samples that are designed to stand in for a more complete reporting that would take months or years.
In the case of NAR's existing home sales report, the association polls about 40 percent of its members and logs sales based on the widely used Multiple Listing Service. Up until 2010, it periodically “benchmarked” its data based on the more complete count conducted by the U.S. Census.
Unfortunately, the Census dropped several key questions about housing in the 2010 Census, which left the NAR without that data set to recalibrate its own data series.
“That kind of threw a monkey wrench in the works for us,” said Molony.
The collapse of the housing industry may also have played a role, according to housing economists who are talking a closer look at the data. One theory is that the consolidation of the housing industry also brought a consolidation among real estate agencies that the NAR's model hasn't kept up with. An agency used in the NARs sample, for example, may have increased sales because it acquired smaller agencies, not because sales in that market rose.
Offering excuses only hides the reality that the NAr knew their methods would inflate the numbers, and they chose to deceive the American people because the numbers were not what they wanted them to be.
Moloney said the NAR is working with the Federal Reserve, Fannie Mae, the Federal Housing Finance Agency, the MBA, Corelogic and academic economists to get its monthly sales data back on track.
“It's a normal process, but now we have to obtain a consensus with a lot of parties,” he said.
That could be a big challenge, given the number of businesses that keep an close eye on the NAR data.
The housing industry's outsized role in the U.S. economy touches thousands of businesses whose sales rely heavily on the level of home sales. From appliance makers to home improvement centers, businesses have to decide month-to-month how many workers to hire and how much inventory to stock. The NAR's monthly number is one of the most critical pieces of data they rely on to make the right decision.
“These data really do have a real world impact,” said Franatoni.
Data is important, isn't it?
It's a shame the NAr has gone down the path it has. Few reliable sources of real estate analysis and information exist, and few signs the NAr is going to become one of them. That leaves a void. Uncharted waters buyers must navigate without a reliable guide. It's a void we seek to fill here at the IHB.
We are in the process of assembling our own private database of housing and related economic statistics. Over the next several weeks as I have time to digest the new information, I plan on a number of new analysis posts to truly illuminate the activity in our local housing market.
I have no agenda to spin the data. Let's see what is really going on. I want to be accurate. People can make their own decisions and draw their own conclusions from accurate data. If approached without the built-in bias of a realtor, data analysis can be revealing rather than deceiving.
I will still have a dog in this hunt. I do run a business that makes money from real estate transactions. I am subject to the same biases as any other human being. I sell real estate, but I am not a realtor. The truth needs no salesman. I will present data as accurately as I can. If reality motivates you to buy or rent, the IHB can help you. I have no desire to manipulate data in order to make a quick buck. This is a part-time hobby for me, not my livelihood.
What about the OC Register?
I recently gave the OC Register grief because The OC Register Says California had no real estate bubble. It's a legitimate beef when a supposedly impartial newspaper starts permitting realtors to revise history with self-serving bullshit.
I probably would have overlooked that silly article in the past. I was once on the cover of the OC Register. I think much of their reporting is very good, particularly Marilyn Kalfus who I think does outstanding work.
Did you see their recent blogger anniversary series?
I wasn't noteworthy enough to make their list. ~~ sniffle, sniffle ~~ Perhaps they forgot about me? Their readers haven't. Note September 2010 when IHB stood atop the list.
I don't know how compete.com does their traffic counts, so I can't comment on the accuracy of their data.
How is the IHB unique?
When I started writing for the IHB in February of 2007, I had a simple message: don't buy, prices are going to crash. It was an important news story to a population gripped with the insanity of a financial mania. The message stood out, and the blog readership quickly grew.
I put a great deal of time and effort into writing a series of analysis posts which became the basis for my book, The Great Housing Bubble. It was my the equivalent of a doctoral thesis in real estate economics. My credibility on real estate is evidenced by the book, the daily writing here, and the fact that I predicted a market decline, and explained why it was going to happen. I could have been lucky.
in order to stay relevant and change with the times, I need to provide you a compelling reason to come back. I hope you enjoy my writing and my cartoons, but coming back for a good laugh isn't all I have to contribute. With this new data, I can provide a unique view into the workings of our local housing market.
Data analysis is core strength
I have some skill in data analysis, and with the collective wisdom of the blog that shines through the astute observations, we will come up with some compelling ways to look at data. Many of the silly arguments that dust up in the comments can be put to rest with data.
For instance, are heavy-cash buyers supporting house prices in Irvine? With data, we can answer this question. I am getting the median home price and the median loan amount history back to 1988. We will be able to trace exactly how down payments have fluctuated over time. We can correlate changes in the down payment with changes in price. If down payments go up when prices go down, then heavy cash buyers are indeed keeping prices up.
I have no idea what the truth is. I haven't looked at the data. This tempest in a teapot has been whirling in the comments for months. Wouldn't it be great to know the truth?
How many homes did the Irvine Company really sell?
The blue line above is the raw data, and the red line is the trailing twelve months as a moving average. The smoothing effect of the moving average reveals the underlying trends in new home sales.
I didn't realize they sold so few new homes after the 2001 recession. The bubble rally years of 2002-2004 were not as lucrative for new home sales as I would have thought. It looks like late 2004 through 2005 was a very profitable period for them. They sold a lot of houses at peak prices. From July 2004 to December 2006, they sold 2,455 homes.
The utter collapse of sales in 2008 is apparent. After recording two sales in January of 2009, there were zero sales in February and March of that year. In all of 2009, there were 90 new homes sold in Irvine. The average since 1988 is 52.5 homes per month.
The good news is that the trend is decidedly up. It's hard to go below zero.
What data is coming?
That is probably a follow-up post all to itself. I am getting data down to the zip code level for most items. For the MLS data, we are grouping builder codes into neighborhoods to overcome the clumsy village codes in the local MLS. Knowing the median price in Northwood is not as useful as seeing the difference between Northwood Pointe, Northwood I and Northwood II. Granularity of data is important for it to be meaningful.
I have closed sales, asking prices, rents, sizes, ages, and a number of other data points all broken down by zip code, village, and neighborhood. We will be able to identify high-equity neighborhoods and high-debt neighborhoods. We will be able to rank villages and neighborhoods desirability as measured by median and $/SF for both resales and rentals. Which do you think is more desirable, Turtle Rock or Turtle Ridge? The numbers will tell us.
No NAr nonsense data or projections. I am using raw MLS data which is subject to its own errors. The information I am getting from Dataquick is one level removed from the raw data, but Dataquick's reputation for accuracy is good, certainly better than the NAr.
I also discovered a great source of public data at the St Louis Fed. They call the system FRED for Federal Reserve Economic Data. They go to the various government agencies, compile their data, and put it in a consistent format so data analysts like me can use it. If you are in to data, this site is a treasure.
How will Shevy get involved?
I didn't handle the announcement of the brokerage well. I thought the shock value would be interesting and positive. I was wrong. Unfortunately, that put Shevy in a difficult circumstance to share is perspective on the market. We are going to change that.
Shevy has been working daily with IHB clients since 2009. Our sidebar has testimonials from IHB clients on the quality of his work, and his sales volumes have been fantastic. In other words, he has satisfied a lot of IHB clients.
We have asked Shevy to start writing posts we will air on Sundays. He may not write every Sunday, but he will share his experiences working with clients. It's a perspective on the market I don't have.
Do you like the Shevy graphic? I was inspired by the common interpretation of Raphael's The School of Athens: “It is popularly thought that their gestures indicate central aspects of their philosophies, Plato's his Theory of Forms, Aristotle's his empiricist views, with an emphasis on concrete particulars.”
i believe Shevy will contribute much to the IHB conversation.
That Mille Fleurs you're waiting for has a squatter in it
The myth of Irvine's high end immunity continues to prove wrong. The reality of squatting to boost prices is inescapable.
Today's featured property isn't supposed to exist. All the heavy-cash buyers with stable finances are allegedly holding all of Irvine's prime properties. Apparently, there are still a few posers out there.
This property was purchased on 5/3/2005 for $1,247,000. The owners used a $935,200 first mortgage, a $186,750 second mortgage, and a $125,050 down payment. I thought this would be a tale of woe from a peak buyer. Nope. These owners got some HELOC booty.
On 2/6/2007 they refinanced with a $1,218,750 first mortgage and a $225,000 HELOC. The total property debt is $1,473,750, and they managed to extract $351,800 — unless you don't believe they maxed out the HELOC. In that case, they only got out $96,800, which recoups most of their down payment.
They quit paying about two years ago.
Foreclosure Record
Recording Date: 02/11/2011
Document Type: Notice of Sale
Foreclosure Record
Recording Date: 12/18/2009
Document Type: Notice of Sale
Foreclosure Record
Recording Date: 09/17/2009
Document Type: Notice of Default
Foreclosure Record
Recording Date: 09/17/2009
Document Type: Notice of Rescission
Foreclosure Record
Recording Date: 07/07/2009
Document Type: Notice of Default
During the next recession, if I fall on hard times, I hope I am allowed to squat in a Mille Fleurs. As for the buyer waiting to pay for the house, too bad.
-$964 ………. Tax Savings (% of Interest and Property Tax)
-$949 ………. Equity Hidden in Payment
$347 ………. Lost Income to Down Payment (net of taxes)
$119 ………. Maintenance and Replacement Reserves
============================================
$4,151 ………. Monthly Cost of Ownership
Cash Acquisition Demands
——————————————————————————
$9,499 ………. Furnishing and Move In @1%
$9,499 ………. Closing Costs @1%
$7,599 ………… Interest Points @1% of Loan
$189,980 ………. Down Payment
============================================
$216,577 ………. Total Cash Costs
$63,600 ………… Emergency Cash Reserves
============================================
$280,177 ………. Total Savings Needed
Property Details for 51 STOWE Irvine, CA 92620
——————————————————————————
Beds: 5
Baths: 3
Sq. Ft.: 3650
$260/SF
Lot Size: 5,339 Sq. Ft.
Property Type: Residential, Single Family
Style: Two Level, Contemporary
Year Built: 2005
Community: Woodbury
County: Orange
MLS#: P775061
Source: SoCalMLS
Status: Active
On Redfin: 1 day
——————————————————————————
New Listing (24 hours)
This elegant Mediterranean style 5bd 4bth home is located in the prestigious Woodbury Community in Irvine near 405 & 5 fwys. Mille Fleurs Plan 1 (Giverny) built by Standard Pacific homes offers plenty of upgrades that include ADT alarm system, corian countertops, built-in BBQ & fireplace, Koi pond, and many more ammenities. Truly resort style living. Hurry, wont last!!!
You pinch yourself but the mem'ries are all you feel
Can you break away from your alibis
Can you make a play will you meet me in the dark…
Billy Squire — in The Dark
The NAr and lenders both want to convince potential buyers no problem exists with shadow inventory. They want to keep both this inventory and buyers in the dark.
by CHRISTINE RICCIARDI — Monday, March 21st, 2011, 5:08 pm
Foreclosure time lines and an abundance of distressed home sales are causing wide fluctuations in shadow inventory across the country.
The National Association of Realtors released state-by-state data on shadow inventory Monday, calculating the data in relation to distressed property sales. On the whole, Capital Economics estimates there are 5.3 million homes in limbo between foreclosure and the sales market. Standard & Poor's states it could take up to 49 months to clear the shadow inventory books. However, the NAR numbers indicate which states are in better shape to unload these properties based on the respective proportion of distressed sales.
Florida holds the largest shadow inventory across the U.S., with more than 441,000 residential properties caught between foreclosure and the sales market, according to NAR. California is a far second with almost 228,000 residential properties constituting the shadow inventory. Shadow inventory properties are sold as distressed sales.
NAR attributed growing shadow inventories to the ramifications of recent disruptions to foreclosure time lines. Some states are having more trouble than others in moving these properties into foreclosure. For example, a mortgage in Florida is delinquent 638 days on average, the second longest time line in the country. The only state that tops that is New York where the average loan is delinquent 644 days before its cleared through the foreclosure process. New York currently holds the fourth largest shadow inventory of 107,500, according to NAR.
NAR reported that the length of the foreclosure process in Florida and California jumped 156% and 157%, respectively, since 2008.
Still, two states commonly seen as poster children for the foreclosure and housing crisis are faring much better in terms of clearing out shadow inventory. Nevada and Arizona both rank in the top 26 states with the largest shadow inventory. However, among those 26 states, they rank 11th (Arizona) and 16th (Nevada) for their level of shadow inventory, behind many states that are supposed to be in recovery, including Texas.
I am not surprised Nevada is not in the top 10 for shadow inventory. Lenders are processing foreclosures there. Wherever they decided to allow people to squat — like California — shadow inventory dominates the landscape.
“This is largely due to their shadow inventory moving somewhat faster through the pipelines and comprising larger share of existing sales,” NAR said. Distressed sales comprised 69% of existing home sales in Nevada in the fourth quarter of 2010 and 55% in Arizona. (Full national stats available by clicking chart below.)
NAR reported early Monday that distressed sales nationwide increased to 39% of all existing purchase transactions in February. The median sale price is hurt by this type of sale, as well as the number of cash transactions that took during the month. The median sale fell 5.2% compared to one year ago to $156,000, NAR said.
Notice the NAr buries that little tidbit at the end of their press release. Perhaps they figured people wouldn't notice prices are falling again.
NAR determined it will take 29 months to clear shadow inventory in Florida, 11 months to clear in California, 34 months to clear in New York, seven months to clear in Nevada and nine months to clear in Arizona.
In Wyoming, the state with the smallest shadow inventory, it will take 13 months to clear the 1,837 homes in limbo. Nevada ties Mississippi for the shortest time frame to clear the shadow inventory at seven months. New Jersey has the longest time line at 51 months, according to NAR.
When the NAr calculates the months of inventory, they divide total inventory by the monthly sales rate to compute the number of months it would take to clear the existing inventory if no new properties were added. They use the same methodology to measure the months of inventory of shadow inventory. This measure is supposed to say something about how long the shadow inventory problem will be with us, but in typical NAr style, they rely on this measure to downplay the real seriousness of the problem.
In the real world, there are only so many buyers, and even if lenders put every distressed property on the market at once, prices could not be lowered enough to absorb that much supply. Lenders must slowly release this inventory or prices crash. Further, in the real world, when the composition of sales is more than 40% distressed properties, prices also fall. Therefore, lenders must manage the flow of properties to be no more than 40% of sales to keep prices stable.
When the total market inventory is around six months, lenders cannot add to total inventory without prices going down. The distressed properties become an additional 40% which pushes months of inventory to double digits where it is now. It has remained elevated for the last four years.
Realistically, shadow inventory can only be liquidated at 40% of the monthly sales rate. If you take the NAr estimate of 11 months of shadow inventory in California — which is a joke — and divide it by 40%, and the months of inventory balloons to 27.5.
The NAr measure of shadow inventory months of supply understates reality by 150%. The Standard and Poor's estimate of 49 months nationally is far more realistic. Four years from now, we will begin liquidating the long tail of distress that will follow this crisis into the later half of this decade.
Bankers allow each other to squat
One of the most infuriating facts about shadow inventory is its epicenter: the New York MSA. Boneheads in New York think their market is immune as it is one of the few where properties still routinely trade at peak prices. Little do they know that this price stability is an illusion created by shadow inventory.
by JACOB GAFFNEY — Wednesday, February 2nd, 2011, 3:57 pm
“The shadow inventory in the New York MSA will take the longest to clear — 130 months as of fourth-quarter 2010. That is at least twice as long as it will take in any of the other top 20 MSAs and 2.7 times the average time to clear for the U.S. as a whole,” the S&P report states. “This is primarily due to very low liquidation rates in New York.”
What the hell is this? Very low liquidation rates? Why is that? Could it be that bankers don't want to hurt their own property values? What other reason could there be? Assholes.
The previous Ponzis
Many Ponzis from the housing bubble left their cash cows to the bagholder to pay off. The previous owners of this property got the better end of the deal.
The bought the property on 4/16/1999 for 265,500. The used a $212,200 first mortgage and a $53,300 down payment.
On 3/21/2001 they obtained a stand-alone second for $100,000. I hope they didn't spend it all in one place.
On 3/20/2002 they went in for their annual cash infusion. The refinanced the first mortgage for $285,000 and added a stand-alone second for $57,000.
On 6/3/2003 the refinanced with a $300,000 first mortgage and a $80,000 HELOC.
On 3/19/2004 they refinanced the $300,000 first mortgage.
On 7/29/2004 they refinanced with a $333,700 first mortgage.
On 3/4/2005 they refinanced with a $380,000 first mortgage. Then it gets weird.
On 6/8/2005 they refinanced with a $380,000 first mortgage.
On 7/13/2005 they refinanced with a $380,000 first mortgage.
On 10/20/2005 they refinanced with a $380,000 first mortgage.
On 2/16/2006 they refinanced with a $380,000 first mortgage. I wonder if one of the owners was a mortgage broker churning their own mortgage for fees? I have never seen four refinances for the same amount before.
Total mortgage equity withdrawal was $167,800.
After riding the equity wave for six years, they sell to the current dreamers for $525,000 on 12/18/2007.
The current dreamers
With aggregate prices in Irvine below $330/SF and falling, how do these owners realistically expect to get $397/SF for a corner lot at a busy intersection?
Based on when these people bought — the market dropped more than 10% in 2008 — they will be lucky to get near their asking price.
Perhaps that special buyer will come along who appreciates the unique attributes of this tract home and offers more than its asking price. ~~ giggles ~~
UPGRADED Detached 3 bedrooms and 2.5 bathrooms home that is strategically located close to award-winning Myford Elementary & Pioneer Middle School. Cul-De-Sac location. Designer upgrades include elegant hardwood, tile flooring, custom carpet, and recess lightings. Cozy & warm living/family room with a fireplace. Spacious kitchen features 5-burner cooktop range, stainless steel appliances, oak cabinetry, reverse osmosis, instant hot water and granite countertop. A huge master suite with walk-in closet that is big enough to be a bedroom, dual vanities and a shower in the master bathroom. Powder room with pedestal sink, and convenient upstairs laundry. Hardscaped backyard, great for entertaining families & friends. NEW insulated garage door, NEW faucets, NEW mirrors in the upstairs bathrooms. A/C & heating unit were recently serviced. NO HOA & LOW Mello Roos (approx. $1,500/ yr)
The deflating housing bubble has done little to curb American's enthusiasm for owning real estate. However, the collapse has provided people sound reasons for not buying a house.
The need for shelter is basic as is the desire for community. In the United States, this translates into a desire to take on a very large mortgage to buy real estate. These basic human emotions drive much of the activity in real estate markets.
Most people buy because it is the right time for them. Their career, age, family circumstances all come together to push people toward ownership at different times. Some are fortunate and buy at the bottom of the real estate cycle. Some are not so fortunate and buy at the peak.
The most damaging aspect of our current system is the price volatility. It capriciously rewards some and destroys others. Home price volatility creates a culture of Ponzi borrowing and dependency. The goal of government policy should be price stability, but lately it seems their goal is price maximization.
Seven Reasons We're Buying and Four Reasons We're Not
By Julia Edwards and Edmund L. Andrews
Wednesday, March 23, 2011 — 12:28 p.m.
Although the housing bubble and bust may have shattered notions that home prices have nowhere to go but up, Americans haven’t lost their love for owning a home. In the latest Allstate/National JournalHeartland Monitor poll, homeownership ranked second, just behind raising a family, in people’s definition of the American Dream. Despite new home sales' drop to a record low, about four-fifths of respondents said that owning a home is still a better financial decision than renting, and nearly nine in 10 homeowners say would buy their home again.
Those results also underscore the extent to which Americans see buying a home as a deeply personal decision. It seems the decision to buy a home is made from the heart, while the decision to rent comes from the wallet.
That is a great way to look at the situation. Most people want to buy and own. Those who look rationally at the costs often chose to rent, not because it's the most emotionally pleasing choice, but because it's the most financially sound decision. Those who chose to rent recognize that being house poor is its own form of unhappiness that so takes away from the joy of ownership as to make it undesirable.
We reveal the top seven reasons why Americans are still drawn to owning a home, and the four reasons that make them hesitant to buy, according to the Heartland Monitor poll.
Reason to Buy No. 7: Getting a tax deduction
Only 2 percent said they considered the tax deduction for homeowner’s a reason to buy a home. That number may come as a shock to members of the Obama administration, who designed the first-time homebuyer tax credit, now expired, as an incentive to bring more buyers to market.
That is a surprisingly low number. Nationally, only about a third of home owning taxpayers take the home mortgage interest deduction, but the proportion in Irvine will be much higher. For high wage earners borrowing upwards of a million dollars, the tax deduction is very motivating.
Reason to Buy No. 6: Following in your parents’ footsteps
Following the path of mom and dad tied with a tax deduction among participants. Only 2 percent said they considered it important to own a home because they had grown up in a house.
I suspect this number is so low because people are unaware of their true motivations. So much of our behavior is subconscious, and the familiarity of house and home provides a psychological anchoring to real estate that runs very deep.
Reason to Buy No. 5: Being part of a neighborhood and community
Putting down roots in a community was a reason to buy a home among 6 percent of participants.
This is another area where Irvine is a special subset of buyers. Many people chose master planned communities like Irvine because they want neighborhood involvement. The number may only represent 6% of America, but it is much higher among readers of this blog.
Reason to Buy No. 4: Acquiring an asset you can pass along
The security that used to come with owning a tangible property may have faded, but 9 percent of participants said they still consider it a reason to buy a home.
Our society has become so mobile that people have come to recognize the impermanence of all living arrangements. We no longer buy family homes and stay there through our passing.
Personally, I plan to acquire several investment homes to pass on to my son. I guess I am one of the 9 percent.
Reason to Buy No. 3: Making a good, long-term investment
Although foreclosure rates may tell us otherwise, 13 percent still believed that owning a home is a good, long-term investment.
The question is a bit vague and misleading. All the terms are up for interpretation: What is good? What is long-term? And what is investment? I believe a good long-term investment is an income property with an 8% cap rate in today's market. Some believe a good long-term investment is a speculative flip in the North Korea towers. Over the very long term, real estate values rise in nominal dollars along with inflation. Is that good?
Reason to Buy No. 2: Building equity rather than paying rent
Building equity was the strongest of all financial reasons to own a home. Twenty-six percent of participants said they would own a home to build credit through a mortgage payment rather than earning less credit through paying rent.
The reason people want to own the home is to obtain appreciation. This nonsense about paying down a mortgage is not what people really think. No California Ponzi believes they have to reduce the balance of their mortgage. Mortgages are made to get larger.
realtors like to spin this as “throwing money away on rent.” Of course, they ignore the fact that they are throwing away much more money renting the bank's money, but the tax deduction makes it all okay, right?
Reason to Buy No. 1: Having a place to raise a family
An overwhelming 40 percent said that raising a family in a place of their own was the ultimate factor in their decision to buy. The housing market may rise and fall, but the value of the home to the American family seems set in stone.
People have come to equate ownership with stability. Unfortunately, our concept of ownership has been perverted into money rentership. Ownership with a huge mortgage is tenuous compared to renting. Capricious landlords evicting good tenants are much less common than robo-signing lenders evicting delinquent borrowers.
The timeless and the new
The reasons listed above are timeless. No matter when an article like this is written, the above reasons will be on it, and they will be just as compelling to buyers. The new are the reasons not to buy. These are a direct response to the collapsing housing bubble.
Reason Not to Buy No. 4: Entering into many years of debt
The bursting of the bubble and the horror stories that followed made 13 percent of respondents hesitant to agree to pay the high price of a home.
Five years ago, nobody cared about debt levels.
Reason Not to Buy No. 3: Losing the flexibility to move if you need to find a new job
In our mobile society and fickle job market, 21 percent said they would be hesitant to lock into a place that they may not be able to sell should they have to move to take a job.
Five years ago, everyone assumed you would simply sell your house for a huge profit if you needed to move.
Reason Not to Buy No. 2: Risking you home losing value if real-estate prices drop
“Price Reduced” signs cropping up in the yards of neighbors desperate to sell led 21 percent to back away from buying a home that could sell for less than the price they paid for it.
Five years ago, with exception of a few of us crazy bloggers, very few people believed prices could go down.
Reason Not to Buy No. 1: Monthly mortgage payments are too high
As opposed to the familial emotions that made 40 percent lean toward homeownership, the harsh realities of high monthly mortgage payments was the ultimate reason that 40 percent of participants said they would not buy a home.
The last reason is why house prices still need to come down. Despite the low interest rates, the cost of ownership is still too high in many markets.
What's it like to be immobile?
Today's featured property is an example of reasons number 3 above. People who buy now, or who bought since 2009, are facing the problem of a flat or declining market. When prices don't go up, people have to pay the sales commissions out of their down payment. That was their money rather than the market's. When free money from the appreciation fairies doesn't materialize, owners generally price their properties to accomplish three things:
Provide negotiating room to lower price,
Pay the realtor, and
Get their down payment money back.
Hence, we see properties priced just over breakeven like today's.
I want every buyer looking today and over the next two or three years to be forewarned that they could find themselves in this situation. And reinforcing risk #2 — dropping prices — it could even be worse.
Location, Location! One block from the Lake. .. 4 bedrooms, 2.5 bath single family detached home in premium 'inside the loop' location. Walk to award winning elementary and middle school or perhaps stroll to the lake and enjoy the view or activities at the South Lake Beach Club/Lagoon. Rarely on the market, this spacious Wildflower model has an open floor plan, cathedral ceilings, newer Low E dual paned vinyl windows throughout, newer roof. Separate living room with charming inglenook seating area with own fireplace, large slider window and door invites the entertainer's backyard into the room. Kitchen has updated stainless steel appliances, countertop, tile flooring and recessed lighting – separate family room flows from the kitchen with built in shelving. Bathrooms have updated glass shower doors and lighting fixtures. Closet organizers in all bedroom closets. Great location, great house, come see and make it your home.


.png)