NAr measures shadow inventory and reports it on the same months-of-supply metric. What about the other homes? Don't they count?


Irvine Home Address … 1 TRADITION Pl Irvine, CA 92602
Resale Home Price …… $595,000

You never listen to the voices inside
They fill your ears as you run to a place to hide
You're never sure if the illusion is real
You pinch yourself but the mem'ries are all you feel
Can you break away from your alibis
Can you make a play will you meet me in the dark…
Billy Squire — in The Dark
The NAr and lenders both want to convince potential buyers no problem exists with shadow inventory. They want to keep both this inventory and buyers in the dark.
Shadow inventory rocked by foreclosure snafu
by CHRISTINE RICCIARDI — Monday, March 21st, 2011, 5:08 pm 
Foreclosure time lines and an abundance of distressed home sales are causing wide fluctuations in shadow inventory across the country.
The National Association of Realtors released state-by-state data on shadow inventory Monday, calculating the data in relation to distressed property sales. On the whole, Capital Economics estimates there are 5.3 million homes in limbo between foreclosure and the sales market. Standard & Poor's states it could take up to 49 months to clear the shadow inventory books. However, the NAR numbers indicate which states are in better shape to unload these properties based on the respective proportion of distressed sales.
Florida holds the largest shadow inventory across the U.S., with more than 441,000 residential properties caught between foreclosure and the sales market, according to NAR. California is a far second with almost 228,000 residential properties constituting the shadow inventory. Shadow inventory properties are sold as distressed sales.
NAR attributed growing shadow inventories to the ramifications of recent disruptions to foreclosure time lines. Some states are having more trouble than others in moving these properties into foreclosure. For example, a mortgage in Florida is delinquent 638 days on average, the second longest time line in the country. The only state that tops that is New York where the average loan is delinquent 644 days before its cleared through the foreclosure process. New York currently holds the fourth largest shadow inventory of 107,500, according to NAR.
NAR reported that the length of the foreclosure process in Florida and California jumped 156% and 157%, respectively, since 2008.
Still, two states commonly seen as poster children for the foreclosure and housing crisis are faring much better in terms of clearing out shadow inventory. Nevada and Arizona both rank in the top 26 states with the largest shadow inventory. However, among those 26 states, they rank 11th (Arizona) and 16th (Nevada) for their level of shadow inventory, behind many states that are supposed to be in recovery, including Texas.
I am not surprised Nevada is not in the top 10 for shadow inventory. Lenders are processing foreclosures there. Wherever they decided to allow people to squat — like California — shadow inventory dominates the landscape.
“This is largely due to their shadow inventory moving somewhat faster through the pipelines and comprising larger share of existing sales,” NAR said. Distressed sales comprised 69% of existing home sales in Nevada in the fourth quarter of 2010 and 55% in Arizona. (Full national stats available by clicking chart below.)
NAR reported early Monday that distressed sales nationwide increased to 39% of all existing purchase transactions in February. The median sale price is hurt by this type of sale, as well as the number of cash transactions that took during the month. The median sale fell 5.2% compared to one year ago to $156,000, NAR said.

Notice the NAr buries that little tidbit at the end of their press release. Perhaps they figured people wouldn't notice prices are falling again.
NAR determined it will take 29 months to clear shadow inventory in Florida, 11 months to clear in California, 34 months to clear in New York, seven months to clear in Nevada and nine months to clear in Arizona.
In Wyoming, the state with the smallest shadow inventory, it will take 13 months to clear the 1,837 homes in limbo. Nevada ties Mississippi for the shortest time frame to clear the shadow inventory at seven months. New Jersey has the longest time line at 51 months, according to NAR.
Write to Christine Ricciardi.
Follow her on Twitter @HWnewbieCR.
Why I believe the NAr is wrong
When the NAr calculates the months of inventory, they divide total inventory by the monthly sales rate to compute the number of months it would take to clear the existing inventory if no new properties were added. They use the same methodology to measure the months of inventory of shadow inventory. This measure is supposed to say something about how long the shadow inventory problem will be with us, but in typical NAr style, they rely on this measure to downplay the real seriousness of the problem.
In the real world, there are only so many buyers, and even if lenders put every distressed property on the market at once, prices could not be lowered enough to absorb that much supply. Lenders must slowly release this inventory or prices crash. Further, in the real world, when the composition of sales is more than 40% distressed properties, prices also fall. Therefore, lenders must manage the flow of properties to be no more than 40% of sales to keep prices stable.
When the total market inventory is around six months, lenders cannot add to total inventory without prices going down. The distressed properties become an additional 40% which pushes months of inventory to double digits where it is now. It has remained elevated for the last four years.
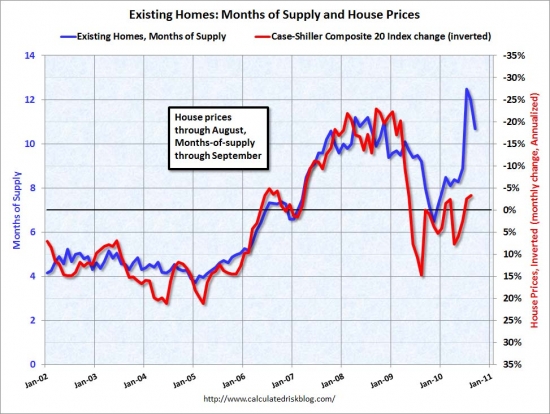
Realistically, shadow inventory can only be liquidated at 40% of the monthly sales rate. If you take the NAr estimate of 11 months of shadow inventory in California — which is a joke — and divide it by 40%, and the months of inventory balloons to 27.5.
The NAr measure of shadow inventory months of supply understates reality by 150%. The Standard and Poor's estimate of 49 months nationally is far more realistic. Four years from now, we will begin liquidating the long tail of distress that will follow this crisis into the later half of this decade.
Bankers allow each other to squat
One of the most infuriating facts about shadow inventory is its epicenter: the New York MSA. Boneheads in New York think their market is immune as it is one of the few where properties still routinely trade at peak prices. Little do they know that this price stability is an illusion created by shadow inventory. 
Shadow inventory to push foreclosures to new heights
by JACOB GAFFNEY — Wednesday, February 2nd, 2011, 3:57 pm
“The shadow inventory in the New York MSA will take the longest to clear — 130 months as of fourth-quarter 2010. That is at least twice as long as it will take in any of the other top 20 MSAs and 2.7 times the average time to clear for the U.S. as a whole,” the S&P report states. “This is primarily due to very low liquidation rates in New York.”
What the hell is this? Very low liquidation rates? Why is that? Could it be that bankers don't want to hurt their own property values? What other reason could there be? Assholes.


The previous Ponzis 
Many Ponzis from the housing bubble left their cash cows to the bagholder to pay off. The previous owners of this property got the better end of the deal.
- The bought the property on 4/16/1999 for 265,500. The used a $212,200 first mortgage and a $53,300 down payment.
- On 3/21/2001 they obtained a stand-alone second for $100,000. I hope they didn't spend it all in one place.
- On 3/20/2002 they went in for their annual cash infusion. The refinanced the first mortgage for $285,000 and added a stand-alone second for $57,000.
- On 6/3/2003 the refinanced with a $300,000 first mortgage and a $80,000 HELOC.
- On 3/19/2004 they refinanced the $300,000 first mortgage.
- On 7/29/2004 they refinanced with a $333,700 first mortgage.
- On 3/4/2005 they refinanced with a $380,000 first mortgage. Then it gets weird.
- On 6/8/2005 they refinanced with a $380,000 first mortgage.
- On 7/13/2005 they refinanced with a $380,000 first mortgage.
- On 10/20/2005 they refinanced with a $380,000 first mortgage.
- On 2/16/2006 they refinanced with a $380,000 first mortgage. I wonder if one of the owners was a mortgage broker churning their own mortgage for fees? I have never seen four refinances for the same amount before.
- Total mortgage equity withdrawal was $167,800.
After riding the equity wave for six years, they sell to the current dreamers for $525,000 on 12/18/2007.
The current dreamers
With aggregate prices in Irvine below $330/SF and falling, how do these owners realistically expect to get $397/SF for a corner lot at a busy intersection?

Based on when these people bought — the market dropped more than 10% in 2008 — they will be lucky to get near their asking price.
Perhaps that special buyer will come along who appreciates the unique attributes of this tract home and offers more than its asking price. ~~ giggles ~~
Irvine Home Address … 1 TRADITION Pl Irvine, CA 92602 ![]()
Resale Home Price … $595,000
Home Purchase Price … $525,000
Home Purchase Date …. 12/18/2007
Net Gain (Loss) ………. $34,300
Percent Change ………. 6.5%
Annual Appreciation … 3.8%
Cost of Ownership
————————————————-
$595,000 ………. Asking Price
$119,000 ………. 20% Down Conventional
4.79% …………… Mortgage Interest Rate
$476,000 ………. 30-Year Mortgage
$120,272 ………. Income Requirement
$2,495 ………. Monthly Mortgage Payment
$516 ………. Property Tax
$125 ………. Special Taxes and Levies (Mello Roos)
$99 ………. Homeowners Insurance
$0 ………. Homeowners Association Fees
============================================
$3,234 ………. Monthly Cash Outlays
-$423 ………. Tax Savings (% of Interest and Property Tax)
-$594 ………. Equity Hidden in Payment
$218 ………. Lost Income to Down Payment (net of taxes)
$99 ………. Maintenance and Replacement Reserves
============================================
$2,534 ………. Monthly Cost of Ownership
Cash Acquisition Demands
——————————————————————————
$5,950 ………. Furnishing and Move In @1%
$5,950 ………. Closing Costs @1%
$4,760 ………… Interest Points @1% of Loan
$119,000 ………. Down Payment
============================================
$135,660 ………. Total Cash Costs
$36,900 ………… Emergency Cash Reserves
============================================
$172,560 ………. Total Savings Needed
Property Details for 1 TRADITION Pl Irvine, CA 92602
—————————————————————————— 
Beds: 3
Baths: 3
Sq. Ft.: 1500
$397/SF
Lot Size: 5,162 Sq. Ft.
Property Type: Residential, Single Family
Style: Two Level, Other
Year Built: 1999
Community: West Irvine
County: Orange
MLS#: S652679
Source: SoCalMLS
Status: Active
On Redfin: 1 day
——————————————————————————
UPGRADED Detached 3 bedrooms and 2.5 bathrooms home that is strategically located close to award-winning Myford Elementary & Pioneer Middle School. Cul-De-Sac location. Designer upgrades include elegant hardwood, tile flooring, custom carpet, and recess lightings. Cozy & warm living/family room with a fireplace. Spacious kitchen features 5-burner cooktop range, stainless steel appliances, oak cabinetry, reverse osmosis, instant hot water and granite countertop. A huge master suite with walk-in closet that is big enough to be a bedroom, dual vanities and a shower in the master bathroom. Powder room with pedestal sink, and convenient upstairs laundry. Hardscaped backyard, great for entertaining families & friends. NEW insulated garage door, NEW faucets, NEW mirrors in the upstairs bathrooms. A/C & heating unit were recently serviced. NO HOA & LOW Mello Roos (approx. $1,500/ yr)
.png)

Irvine Renter, we totally need to get a graphic for “hardwood“.
Pinocchio with a tent?
O!
http://www.crackthecode.us/images/HardWood.jpg
LOL! Can you overlay some pergo wood flooring on the ceiling behind him? Then I can put a title: “Hard Wood Flooring”
I like it I like it
Maybe now you understand what I meant by “jpg homies”.
You probably look like that guy in the picture:
“Ooooo… look at this new jpg I made for IR!”
Irvine HO, you just don’t appreciate fine hardwood flooring.
Check out the updated post.
LOL! Mikey I think he likes (loves) it
Sold in 2007 for $525K.
According to irvine renter current market value is only 5% off peak for this strategic location – LOL.
But low and behold they are asking 10% over 2007 price.
Let’s see where this closes, the “epic crash” in Irvine continues. It may sell for 5% off peak or the same, maybe 10% more… Report on the devastation quickly.
You may want to update and be more precise with your price per square foot numbers.
Redfin shows an up tick to $355 per sq ft for 92602. For recent comps for this gem it’s showing $361.
The epic Irvine crash continues.
Statics can be used many different ways.
There’s not enough transactions in 92602, but I thought I’d post some numbers to show what’s really going on in that zip code. Per Redfin, 15 SFH’s sold in Feb. Per Redfin SFH medium price is down in this zip code -21.9% vs prior year, and SQFT off -8%.
Redfin also shows that SF home sales in Irvine @ 322 a sqft. Also, they show as of Feb 2011, sales off -6.8% vs previous month (I thought sales were suppose to increase after the new year), and off -10.6% vs previous year. Medium price off -3.3% from previous month, and off -7.7% from previous year.
Let’s wait and see what this sells for, shall we?
It may sell for more than 2008 price. There was a lot of panic at that time, and equity sellers were just wanting to get out. However, this is an awful location for this home … just incredibly awful.
I think I know what’s going on. We’ve started the second part of the decline, and unless the govt/fed can up the ante with more debt/welfare, prices will continue to drop in Orange County, Irvine and 92602.
Let’s see were comps are at the end of the year, shall we?
“It may sell for more than 2008 price”
Ahhh progress and acceptance, I love it. So who exactly is presenting the wrong data now LOL.
I’m not accepting anything. I don’t have to be right. The numbers speak:
SFH in 92602 fer Redfin:
3/23/2009 = 332 SQFT
3/21/2011 = 327 SQFT
So prices are roughly the same … this after the govt/fed threw trillions at this mess. Zero percent interest rates. The lowest mortgage rates in history. 2 trillion in quantitative easing. Special tax deductions. Political heat on the banks/lenders. Accounting rules manipulated for the banks. All of it.
The collapse was interrupted by the greatest expansion of debt in recorded history. The real question is, how much longer can this continue? I think it’s ending.
As I said before, let’s see were comps are at the end of the year … the end of next year too, shall we? I don’t believe the govt/fed can continue this.
No way, let me get this straight: you are using list prices for 2011. Give me a second to laugh.
Sold is $355 per sq ft. What’s more important, sold or list or do you conveniently choose which one you want to use LOL. If this was priced at $540k it would likely already be pending, $361 show for the relevant area. Facts are facts.
You’re right … I was using condo’s too in my field.
Given the list price this will probably take forever to sell. It may take a year before we know what it closes for and maybe there will be a trustee fip transaction in between unless there was a 20% down payment or more. End of 2007 might have required 20% down. I’d guess it bottoms around $520-525, though the $489 or $470 estimates are not unreasonable. $350 is unreasonable but crazier things have happened.
so one would argue that there has been huge intervention in the market Lee.
But that was done nationally, not only for Irvine. So given that, when the other truly bubbly areas fell by 40% or 50% (ala vegas and Miami), Irvine has held up relatively better.
That isn’t to say that prices may not go down some more but what made Irvine so special that the interventions specifically affected it differently from the other markets.
What?
You mean in Las Vegas there aren’t housing selling in 2011 for greater than their 2007 sales price? Say it ain’t so. Las Vegas must be different.
Strawman argument.
Even IR the Las Vegas flipping tycoon frankly admits that appreciation is not what will drive sales in LV, and in one of his LV posts he talks about deteriorating prices hurting profits on a couple of his properties with squatters.
So don’t try and argue against a position that no one here is taking.
This “strategic location” makes me think of other threads we’ve had about the fun health implications of living next to a major road like Jamboree: http://goo.gl/eEIZp
Here is a question that has perplexed me:
I fully understand why large banks would want to
throttle the shadow inventory sales rate to
keep prices artifically high. (as explained
above)
From what I can tell, the banks are emulating
the Debeers diamond business model. IE. keep
the huge oversupply of diamonds in the vault
and meter them out to create an illusion
of scarcity and force prices high.
What I don’t understand is why small/medium
size banks with limited R/E exposure would
not dump their entire portfolios on the market
to recover as much cash as *quickly* as possible?
In others words, why don’t the small banks
jump off the cliff first and thus maximizing
their total possible return?
Are all the banks linked together as a cartel?
If they are locked together in a cartel or not is as much conspiracy theory and anything else (IMHO).
What I do believe is going on is that the banks do not have the reserves to dump all these properties at the same time. They need the capital coming in from the ZIRP and other bailouts to feed the loses taken as they write off the bad loans.
Also, they only want to scale up the distressed processing operations so much. They are basically feeding a department to lose money. They want to keep that department just big enough to push through the amount of write downs they can afford.
Unless you are in New York. In that case let the guy sitting at the desk next to you live rent and mortgage free. Assholes.
The small banks, if they kept the loans in house, do not have the same percentage of bad residential loans. And they do market their REO quickly.
School Information
* Elementary School: Myford
* Middle School: Pioneer
* High School: Beckman
* School District: Irvine Unified
Beckman is Irvine Unified?
Yeah, tell that to the unsuspecting FCBs.
The FCBs know that West Irvine is Tustin Unified.
And even though, those schools in that area of Tustin Ranch are just as good (if not better) than Irvine Unified.
But the perception of “Tustin” does have some sway on price, West Irvine is typically lower than other areas of Irvine in IUSD proper.
Exactly,
It’s all good as long as the FCB punchbowl remains full.
Maybe someone has suggested this before, but periodically, you should have a “Price is Right” contest on polling for the actual sales price on a recently listed WTF price such as this
Closest to, without going over gets some kudos from you, and on their death bed, they will maintain total consciousness, which is nice….
My bid is 489,900 with a closing date of 8/1/2011
I would guess $525K with a $417K loan, though I could see $540-550K. Hard to know whether they need to sell.
REO, 350k on May 16th, 2013
I’m surprised PR hasn’t rebutted you with his awesome Irvine insight yet.
Chances of this going sub $500k is slim.
I’m with PR and an over/under of $525k due to bad location.
Having lived near a major street before, I would not buy this place for $400k.
Having lived near a major street before, I would not buy this place for $400k.
You wouldn’t do it for the sake of the children getting to go to a fine Irvine school?
Why does the Nar get quoted anymore? Aren’t their numbers suspect by definition?
A few years ago, there was a front page article in the OC Register that had a cool map. It detailed the distressed properties/foreclosure problem by zip code in Orange County. For example, if a zip code had more than 6 months of inventory, it got shaded red. Buried in the article, the writer talked about how he came up with the months of inventory….# of foreclosures + distressed properties divided by the sales per month. I thought, “WTF”. I wrote to the guy and asked what the rates would be if new inventory and existing (non-distressed) properties were factored in. And then I began my plans to sell our house.
Why does the Nar get quoted anymore? Aren’t their numbers suspect by definition?
Of course they are suspect, but who else are the reporters going to ask?
I’ll say short sale of $470K in November of 2011.
boy, boy, boy, prices in a double dip with the fed buying bonds and interest rates at serious artificial lows…. We have a long hard slow grind ahead of us for a decade or more. Prices slowly deflating as rates rise at best. The almighty help us if we get anything other than a slow rise in inflation and rates. Imagine buying any of this with 9% money…. pobre si!
B
We’ll see how things pan out when QE2 ends.
But then there’ll probably be QE3, 4, ….. (and to infinity).
Can’t beat a printing machine, ya know?
If we have a Q3 and more… the dollar is even more doomed. Rates will rise. They are higher now than they were 6 months ago and the fed is buying… If this keeps up the Fed will be the only one buying…
B
Wow… what would happen if rates just went back 7.25% – what I paid in 1999 with perfect credit and 20% down?? Most don’t really realize that rates falling for 20 to 30 years – depending on your definition – also, enabled this ginormous bubble. Now we will likely see a reversal to mean. Not all at once but, slowly. Rates will just rise slowly (if we are lucky) for as long as you can see…. I’m guess a 3-4 point rise in long term rates over the next 10-12 years.
Why do you think gold is going through the roof?? Just like the 70s…stagflation. Rising rates, rising commodities, rising inflation. And, declining values for anything and everything that requires borrowed money.
Yikes… I’m not happy about it. I own property but, also rent a place. Just a very tough decade or two in front of us….
BD
Interest rates will not go to 7% or 9% by magic or because it is the ‘mean’. 10-year rates were very low for much of the 50’s, so we can have today’s low rates for a while. Rates were higher in 1999 even in the face of an improving deficit situation – why? Maybe it is because investment dollars were gushing into stocks? Which also coincided with a very healthy job market?
Rates will rise with two factors: rising inflation and an economy moving closer to full capacity. What could produce higher rates is the fed saying its inflation target is now 4% instead of 2% (it gives more flexibility in the zero-bound situation we are currently in). We had rough 4% inflation in the 90’s and that was a decent decade economically (really, compare it to the 00’s), so 4% inflation would not hurt. If the fed did this, you’d have rates spike 2% higher…but you’d have 2% more inflation, keeping real rates nearly constant. Higher rates, with higher inflation are easier to handle than lower rates with zero or negative inflation.