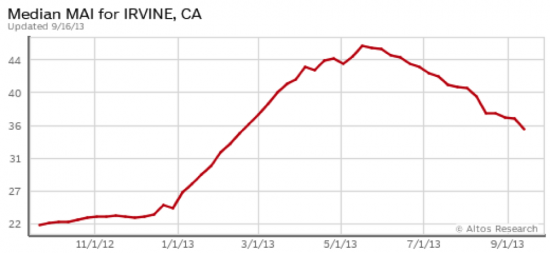
According to Altos Research, the Market Action Index (MAI) for Irvine’s single-family housing market was 35.02 on September 13. That is down from the 37.21 MAI that was recorded about a month ago. The Irvine MAI made a steady climb upward starting at the first of the year but then started making a steady trend downward. However, as defined by Altos, this still puts the Irvine single-family housing market in the seller’s market category. (Above 30 is defined as a seller’s market; below is defined as a buyer’s market.) Altos also states that the average single-family home in Irvine has been on the market for about 65 days as of September 13, 2013.
Following is Irvine’s August 2013 housing market data as provided by Redfin.
| Type | List Price/# Homes Listed | Sold Price/# Homes Sold | List Per SF | Sold Per SF | % Chg Y-O-Y Sold Price/SF |
| Houses | |||||
| 13-Aug | $1,075K/235 | $908K/114 | $459 | $406 | 17.70% |
| 13-Jul | $1,125K/210 | $900K/122 | $459 | $435 | 16.90% |
| 13-Jun | $1,112K/186 | $855K/99 | $462 | $414 | 16% |
| 13-May | $1,030/167 | $890/113 | $457 | $411 | 21.60% |
| 13-Apr | n/a | n/a | n/a | n/a | n/a |
| 13-Mar | $1,020K/101 | $904K/62 | $443 | $381 | 13.40% |
| 13-Feb | na/109 | na/272 | $415 | $354 | n/a |
| 13-Jan | na/113 | na/274 | $409 | $357 | n/a |
| Condos | |||||
| 13-Aug | $590K/295 | $564K/146 | $406 | $384 | 24.30% |
| 13-Jul | $588K/295 | $522K/135 | $416 | $394 | 28.80% |
| 13-Jun | $585K/235 | $540K/130 | $418 | $391 | 24.90% |
| 13-May | $599K/177 | $539K/144 | $406 | $386 | 30.40% |
| 13-Apr | n/a | n/a | n/a | n/a | n/a |
| 13-Mar | $570K/111 | $476K/88 | $375 | $344 | 21.60% |
| 13-Feb | na/100 | na/301 | $369 | $325 | n/a |
| 13-Jan | na/106 | na/324 | $377 | $327 | n/a |
| All | |||||
| 13-Aug | $710K/579 | $660K/278 | $418 | $389 | 18.20% |
| 13-Jul | $709K/545 | $659K/283 | $423 | $401 | 24.10% |
| 13-Jun | $734K/456 | $638K/249 | $422 | $395 | 20.80% |
| 13-May | $750K/371 | $659K/274 | $416 | $393 | 26.80% |
| 13-Apr | n/a | n/a | n/a | n/a | n/a |
| 13-Mar | $703K/219 | $588K/151 | $392 | $359 | 18.90% |
| 13-Feb | na/209 | na/573 | $389 | $334 | n/a |
| 13-Jan | na/219 | na/598 | $389 | $338 | n/a |