The double dip is showing up in the NAr statistics, and the spin and bullshit from the NAr is laughable.

Irvine Home Address … 35 ABRAZO AISLE Irvine, CA 92614
Resale Home Price …… $249,000

Lost in a dream
Nothing is what it seems
Searching my head
For the words that you said
I try to let go, but I know
We'll never end 'til we're dust
We lied to each other again
But I wish I could trust
Megadeth — Trust
One of the key features of many posts on the IHB is the art of critical reading. There is so much garbage in the mainstream media, and corrupt organizations like the National Association of realtors use this cesspool to dispense its bullshit in hopes that someone, somewhere will take it at face value. I read real estate articles every day looking for facts, truth, and insightful analysis. I have only ever found facts, questionable facts, in NAr press releases. Truth and insightful analysis is always lacking.

It's been a couple of weeks since I declared victory over the local realtor association, but the NAr is still practicing the dark art of spinning bullshit into gold. Today we are going to look at their July sales report and see what truth we can salvage from the published debris.
The specifics of data, spin and bullshit
As a reminder:
Data: Factual statements that present statistics or some measurable phenomenon. Presenting data is ostensibly the reason for a real estate press release. However, the real intention is to spin the data or otherwise manipulate the interpretation.
Spin: The offered interpretation of data that forwards the agenda of the organization issuing the press release. Spin is usually a plausible interpretation that is most often taken out of context, knowingly, by the authors.
Bullshit: An interpretation of data that is either not factual, or the data itself is not factual, or an interpretation that is not plausible based on the data. Bullshit is an obvious lie an organization passes off to a gullible public in hopes that nobody catches on.
With that, let's see what the esteemed National Association of realtors had to say about the dismal market conditions in July.
Second Quarter Metro Area Prices Mixed with Little Change, State Sales Down
Washington, DC, August 10, 2011
Median existing-home prices declined modestly in the second quarter with 27 percent of metropolitan areas experiencing price gains from a year ago, while state home sales declined from the second quarter of 2010, according to the latest quarterly report by the National Association of Realtors®.
Notice how the declines are downplayed while the increases are emphasized. What's worse is the emphasized increase masks the extremely negative flipside: 72% of MSAs experienced declines from a year ago. Declining prices and declining sales is a sign that more declines are on the way. If sales had been up, at least an argument could be made that buyers are entering the market to get bargains.
The median existing single-family home price rose in 41 out of 151 metropolitan statistical areas1 (MSAs) in the second quarter from the same period in 2010, including four with double-digit increases; one was unchanged and 109 areas showed price declines. In the first quarter, 34 metro areas had posted gains from a year earlier.
 Notice how the sentence above starts with spin to put a good face on the really bad news that follows.
Do you think an NAr spokesman will risk what little credibility they have and use this opportunity to call a bottom?
Lawrence Yun, NAR chief economist, said home prices have been moderating. “Median home prices have been moving up and down in a relatively narrow range in many markets, which shows a stabilization trend,” he said. “Markets showing consistent price stability or increases are those with solid labor market conditions, such as in Washington, D.C.; San Antonio; or Fargo, N.D.”
Falling prices during the one period of the year when prices nearly always rise is certainly not a sign of stabilization. Think of what will happen this fall and winter — a time when prices nearly always fall — after the conforming limit is lowered and the already scarce buyer pool goes into hibernation.
Yun noted the median price measurement reflects the types of homes that are selling during the quarter and can be misleading at times. “The level of foreclosures, which can artificially depress median prices, can vary notably in given markets. The annual price gauge smoothes out the quarterly swings and has shown fairly stable price trends in most markets.”
Foreclosures don't “artificially depress” anything. Foreclosures are the market. That doesn't mean there are not some markets (like Las Vegas) where prices have been pushed well below their historic levels of support, but that is not “artificial.” It is merely the state of the market right now. Foreclosures are going to impact prices for quite some time.
He added the housing market should be stronger. “With home prices in a broad trough and historically low mortgage interest rates, high housing affordability conditions and rising rents could stimulate a more rapid sales recovery if banks get back into the business of lending to more creditworthy borrowers,” Yun said.
Yun was in rare form with that sentence. In some markets, sales and prices should be stronger. Mortgage rates are very low, and affordability is excellent in markets where prices are also low. While it's true that rising rents could stimulate a more rapid sales recovery, this isn't very likely because rents will not rise quickly in a weak economy, and many wouldbe buyers will be forced to rent because the short sale or foreclosure on their record keeps them out of the buyer pool. The bullshit about lowering lending standards is a common meme in realtor circles. It's an easy thing for them to advocate as they take none of the risk but obtain all of the benefit.
NAR’s Housing Affordability Index stood at 176.6 in the second quarter, the third highest on record after the first quarter of 2011 and fourth quarter of 2010. The index measures the relationship between median home price, median family income and mortgage interest rates; the higher the index, the greater household purchasing power. Recordkeeping began in 1970.
I haven't studied the NAr housiing affordability index. I don't have to in order to recognize it is an unreliable gauge because I know the source is not trustworthy. Back during the housing bubble, prices were so high that their affordability measure stated that only about 2% of the population could afford the median sales price. So what did they do? They changed their affordability metrics from measuring against a 30-year amortizing mortgage with a 20% down payment to using an interest-only mortgage with a 10% down payment. Suddenly, prices were affordable again.
The national median existing single-family home price was $171,900 in the second quarter, down 2.8 percent from $176,800 in the second quarter of 2010. The median is where half sold for more and half sold for less. Distressed homes,2 typically sold at a discount of about 20 percent, accounted for 33 percent of second quarter sales, down from 39 percent in the first quarter; they were 32 percent a year earlier.
Did you notice that distressed sales have increased over last years high level? You weren't supposed to. They put in the factoid about 39% of properties were distressed sales in the first quarter to make you think distressed sales are declining when, in fact, they are increasing.
Total state existing-home sales, including single-family and condo, declined 5.4 percent to a seasonally adjusted annual rate3 of 4.86 million in the second quarter from 5.14 million in the first quarter, and were 12.7 percent below a 5.57 million pace during the second quarter of 2010. June 2010 was the closing deadline for the home buyer tax credit.
Half way through the press release, and we finally get to some very revealing information. Sales are down — dramatically. Sales dropped 5.4% from the first quarter to the second quarter. This is typically when both sales volumes and prices are rising. Further, the rate of decline as compared to last year is an astonishing 12.7%. He tries to make excuses by mentioning the tax credit, and that was certainly part of the reason, but the market is very weak right now, and it's more than just the removal of market supports.
NAR President Ron Phipps, broker-president of Phipps Realty in Warwick, R.I., said the key to healthy housing is credit access. “It’s frustrating for many creditworthy potential home buyers to realize that when they’re ready to make a move, banks remain risk averse,” he said.
Yes, I imagine is very frustrating for people who previously could make up income numbers and get 100% financing to be faced with the cold reality of needing good credit, verifiable income, and a down payment. Of course, lenders may find an innovative solution to the problem….

“People with good jobs, long-term plans and who are willing to stay well within their means deserve an opportunity to realize their American dream of home ownership. When banks return to normal and safe but sensible lending standards, housing will be able to contribute its traditional share to economic growth.”
People with good credit, stable jobs, and a down payment are buying homes. The problem is there are not enough of those people to absorb the supply from the people who couldn't sustain ownership.
It really annoys me when I read these calls from realtors to lower lending standards. Let them put their money at risk if they believe standards are too tight. If they are right, they have an opportunity to make large profits from the low default rates they will experience on the loans they underwrite to all the creditworthy people they believe deserve loans.
Housing has no traditional share of economic growth. Homebuilding does, but we built too many homes in the 00s, and we are currently recycling that inventory through foreclosure. Realtor commissions don't do anything for economic growth other than through the spending power of realtors themselves. realtors add no value to homes, they merely profit from the sale of them. Perhaps they add service value to the buyers and sellers — at least I hope we do — but by and large, realtors drain value from real estate not add to it. If the thousands of realtors who left the profession got trained in something more productive, then we might see some benefit from the housing bubble after all.
Yun clarified the point on economic growth. “The direction of the economy will be determined principally by the housing market recovery, and indications now are pointing toward only a modest recovery,” he said.
Yun couldn't resist the temptation to interject more bullshit into the press release.
The share of all-cash home purchases was 30 percent in the second quarter, up from 25 percent in the second quarter of 2010. Investors, who make up the bulk of cash purchasers, accounted for 19 percent of second quarter transactions, up from 14 percent a year ago.
Increased sales by cash buyers is a sign of a market bottoming. When cash buyers come in, prices have reached market clearing levels. This is the only real good news in the data presented, and the NAr didn't recognize it as such.
First-time buyers purchased 35 percent of homes, down from 46 percent in the second quarter of 2010.
This is an important tidbit they buried deep in the press release. Together with cash buyers and investors, first-time homebuyers are key to the market's recovery. If first-time homebuyers are not absorbing the inventory, prices will continue to decline, and sales will continue to suffer.
Repeat buyers accounted for a 56 percent market share in the second quarter, up from 40 percent a year earlier.
These are probably repeat cash buyers. There isn't much of a move up market, particularly as prices continue to slide.
In the condo sector, metro area condominium and cooperative prices – covering changes in 54 metro areas – showed the national median existing-condo price was $169,200 in the second quarter, which is 3.5 percent below the second quarter of 2010. Fourteen metros showed increases in the median condo price from a year ago and 40 areas had declines.
Notice how the NAr presents the good news first to blunt the impact of the really bad news that follows.
The rest is region specific data generally showing the same pattern of price and sales declines.
Regionally, the median existing single-family home price in the Northeast rose 2.0 percent to $245,600 in the second quarter from a year ago. Existing-home sales in the Northeast declined 4.6 percent in the second quarter to a level of 763,000 and are 19.9 percent below the second quarter of 2010.
The median existing single-family home price in the Midwest fell 5.4 percent to $139,800 in the second quarter from the same period in 2010. Existing-home sales in the Midwest were down 3.1 percent in the second quarter to a pace of 1.05 million and are 18.3 percent below a year ago.
In the South, the median existing single-family home price declined 2.7 percent to $153,000 in the second quarter from a year earlier. Existing-home sales in the South fell 3.4 percent in the second quarter to an annual rate of 1.89 million and are 9.9 percent below the second quarter of 2010.
The median existing single-family home price in the West declined 3.1 percent to $218,000 in the second quarter from the second quarter of 2010. Existing-home sales in the West dropped 10.8 percent in the second quarter to a level of 1.16 million and are 6.2 percent below a year ago.


The National Association of Realtors®, “The Voice for Real Estate,” is America’s largest trade association, representing 1.1 million members involved in all aspects of the residential and commercial real estate industries.
The NAr is the voice for real estate, and they always have the same message, “Its always a good time to buy or sell a house.”
840 square feet that once appraised for $386,500
The owner of today's featured property is a typical Ponzi. He managed to milk this property for $262,350 from his $3,850 down payment back in 1999. I could compute the return on investment, but it would be astronomical. It's owners who had experiences like this guy who keep kool aid intoxication alive. He won the housing lottery, so anyone can, right?
- This property was purchased for $128,000 on 11/24/1999. The owner used a $124,850 first mortgage and a $3,850 down payment.
- On 12/26/2000, just over one year later, he got his first mortgage equity withdrawal with a new $136,000 first mortgage. That probably paid off a few Christmas gifts.
- On 10/18/2004 he refinanced again with a $146,300 first mortgage.
- On 2/22/2005 he refinanced with a $236,000 first mortgage and obtained a $90,000 HELOC. With those two loans, he nearly doubled his mortgage, but he got $150,000 to play with.
- On 8/2/2006 he got an Option ARM with a 2% teaser rate for $344,000.
- On 10/5/2006 WAMU gave him a $42,500 HELOC. This loan was particularly stupid. I can't believe banks gave out seconds on top of Option ARMs. They deserve to lose their money on that one.
- Total mortgage equity withdrawal is $262,350. We know the guy didn't spend much on the property as the description says it's a fixer. I would be shocked if I hadn't seen a hundred of these before.
What amazes me about properties like this one is that they appraised at such a high value. This is an 840SF 2 bedroom 2 bath condo. It is comparable to an Irvine Company apartment that likely rented for about $1,800 per month back in 2006 when the final loan was approved. Since the final refinance was with an Option ARM, this owner probably had payments near rental parity. Like many others, he believed he would be able to serial refinance into another Option ARM and pull out more HELOC booty when the loan payments were due to increase. In other words, he went Ponzi.

——————————————————————————————————————————————-
This property is available for sale via the MLS.
Please contact Shevy Akason, #01836707
949.769.1599
sales@idealhomebrokers.com
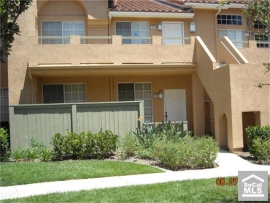
Irvine House Address … 35 ABRAZO AISLE Irvine, CA 92614
Resale House Price …… $249,000 
Beds: 2
Baths: 2
Sq. Ft.: 840
$296/SF
Property Type: Residential, Condominium
Style: One Level, Other
Year Built: 1988
Community: Westpark
County: Orange
MLS#: S669465
Source: SoCalMLS
Status: Active
On Redfin: 3 days
——————————————————————————
This floor plan is hardly ever on the market and its a lower unit located near the pool and has an interior tract location it needs a little TLC and is reflected in the price.
——————————————————————————————————————————————-
Proprietary IHB commentary and analysis ![]()
Resale Home Price …… $249,000
House Purchase Price … $128,000
House Purchase Date …. 11/24/1999
Net Gain (Loss) ………. $106,060
Percent Change ………. 82.9%
Annual Appreciation … 5.7%
Cost of Home Ownership
————————————————-
$249,000 ………. Asking Price
$8,715 ………. 3.5% Down FHA Financing
4.19% …………… Mortgage Interest Rate
$240,285 ………. 30-Year Mortgage
$77,754 ………. Income Requirement
$1,174 ………. Monthly Mortgage Payment
$216 ………. Property Tax (@1.04%)
$50 ………. Special Taxes and Levies (Mello Roos)
$52 ………. Homeowners Insurance (@ 0.25%)
$276 ………. Private Mortgage Insurance
$241 ………. Homeowners Association Fees
============================================.jpg)
$2,009 ………. Monthly Cash Outlays
-$185 ………. Tax Savings (% of Interest and Property Tax)
-$335 ………. Equity Hidden in Payment (Amortization)
$13 ………. Lost Income to Down Payment (net of taxes)
$51 ………. Maintenance and Replacement Reserves
============================================
$1,554 ………. Monthly Cost of Ownership
Cash Acquisition Demands
——————————————————————————
$2,490 ………. Furnishing and Move In @1%
$2,490 ………. Closing Costs @1%
$2,403 ………… Interest Points @1% of Loan
$8,715 ………. Down Payment
============================================
$16,098 ………. Total Cash Costs
$23,800 ………… Emergency Cash Reserves
============================================
$39,898 ………. Total Savings Needed
——————————————————————————————————————————————————-
So this condo sold for $128,000 in 1999.
That is about $173,000 in todays money according to
http://www.usinflationcalculator.com/
Shouldn’t this be the value unless there have been improvements to the property? Or is it because Irvine has become a more sought after area? I am looking to buy a condo but can’t see why I should pay over the cost in year 2000 adjusted for inflation.
Is there something I am missing?
You’re not missing anything. The only argument that can be made is that today’s lower interest rates make the higher price more affordable on a cost-of-ownership basis. However, you would be paying $60,000 more than you should because of the lower interest rates which doesn’t seem like a benefit to me.
I truly believe Irvine is more sought after area in the last decade. Look at how many more companies are HQ’d and how much more retail and entertainment has been developed since 1999. Simply put, the city has really grown. Things like The District and Diamond Jamboree didnt exist in 1999. Spectrum has grown significantly as well.
That isnt to say the price is the right price for this unit but there has been changes in Irvine that should be considered above just inflation since 1999.
“I truly believe Irvine is more sought after area in the last decade.”
The real test of your belief is this: have rent increases in Irvine outpaced the rest of OC since 1999? The answer to that question would provide a lot more insight than anecdotal speculation about jobs or retail centers.
That is a good point. Maybe IR can add this to the data posts. Gut says it has.
Good news — we will be answering this very question in tomorrow’s post. Global Decision has created a hedonic-based model for Irvine rents. Our post tomorrow will show the relationship between Irvine rents, Irvine home prices, and Irvine cost-to-own (rents modulated by interest rates). The use of the hedonic model allows the rent trend over time to be (less) distorted by changes in the mix of what is renting.
Awesome. Just curious, will you be making comparisons to the rest of the Southern California market? Or is this just Irvine-specific data?
The post will, as usual, focus on Irvine. We have a lot of analytics related to Irvine prices (purchase price hedonic, rent price hedonic), but we will frame the analysis with other SoCal data where we can. I personally like to use the Case-Shiller LAOC Top Tier index as a comparable for home values. However, we don’t have a lot of other rent data (yet).
Another growth factor people rarely mention is UC Irvine.
Back in the 80s… it was almost like a community college. If you look at it now, with all the new buildings and greatly expanded on-campus housing, you can imagine how much the off-campus housing population has grown in the last 20 years.
As to BMS’s question, rents are still high for private SFRs. Anything newer than 1990 with a 3CWG usually rents for more than $4000 (I usually try to check rental rates that match the type of homes I am looking at). 4/3s start at around $2900+, about 5-6 years ago, they rented for $2500.
Do other OC cities have similar rents?
You misunderstood the question, which was whether Irvine rents have increased at a faster rate in the time period rkp mentioned. Not whether they are currently higher than average.
I was trying to address both.
In my 4/3 example, rents have risen about 15% in the last 6 years… is that the same elsewhere? If I recall correctly, in the 80s a 2br apartment rented for about $900 a month, what does it rent for now? $1700?
We all know that Irvine is one of the few cities that continues to build new homes… but it also continues to build new apartment communities. The Village by the Spectrum has more than doubled. Would people continue to build new apartments if Irvine wasn’t in demand?
And I do think a higher than average rent (which Irvine does have) is an indicator of “more sought after”.
The full quote is “more sought after area in the last decade.” Nobody ever disputed that Irvine rents were higher both than and now. Magnitude and rate-of-change are two distinct quantities.
I don’t know how much Irvine rents and OC rents have risen in the last decade. Unfortunately the american factfinder doesn’t seem to have all the 2010 census date yet, so we can’t make a direct comparison to 2000. It’ll be interesting to look at it when it does come out.
You might want to use the American Factfinder with the ACS (American Community Survey) 2009 data for Irvine. Because Irvine has a fairly large population, you can pull Irvine-specific estimates on a 1-year basis.
Using that dataset, median household income for Irvine (2009) is listed as 84,950 (+- 4,331 margin of error). Median family income is listed as 102,681 (+- 4,407).
Family income takes into account only households where the earners are related by blood or marriage. On that basis, it’s probably a better metric for the income of a unit that would be likely to purchase real estate.
That is about $25K lower than I would have guessed, but I don’t know much about the lower-end segment of Irvine.
If this is not being weighed down by a significant population of lower-income residents, then Irvine prices are vulnerable indeed.
Thanks Jaysen; great tip! I wasn’t aware I could get just the 2009 numbers, but with a little Googling I found them.
I was suprised by what I found. I would have guessed that rent increases would have been very similar between Irvine and OC as a whole, with Irvine perhaps outpacing OC by a few percentage points.
Median gross rent Irvine 2000: $1272
Median gross rent OC 2000: $932
Median gross rent Irvine 2009: $1760 (38% increase)
Median gross rent OC 2009: $1439 (56% increase)
To put it another way, Irvine in 2000 commanded a 36% premium. In 2009, it commanded a 22% premium.
http://factfinder.census.gov/
BMS – Wow: interesting find. The ACS data should have annual results for Irvine and OC for 2005 to 2009 (and going forward). Would certainly be interesting to understand how the Irvine vs OC ratio has moved over time.
@php…you’re not missing anything. How many improvements can you put into 840 sq.ft?????
It does not need “a little TLC” it needs a lot of THC, or good old alcohol, to want to deal with it at that price. The madness continues. 🙂
But this time it’s different…
Every day I get this line:
“Well, the seller wants it priced at $500,000. There are a couple of closed homes in the area at $375,000 but (always the “but”) those are short sales, and aren’t really sold at fair value”.
When I say every day, that’s an average. On the days I don’t hear it, that average is made up with the two or three other realtors who do believe this claptrap.
I wish often, although carefully refrain, from reminding these realtors that indeed the closing price of any home, REO, Short Sale, or Equity Sale is the correct value. Any Realtor worth the brand name knows it.
My .02c
Soylent Green Is People.
SGIP,
You might shout is, but as in the movie “Soylent Green”, when the people heard that SGIP, they chowed down anyways.
As long as people can borrow without skin in the game, the prices will be inflated. Do you find people complaining about the documentation requirements for the 3.5% downpayment FHA loans?
Do they complain that the comparables are too low? Or the FHA requires verification of income?
Realtors have too much to gain from their vile, pernicious lies to abandon them, and this is among their most effective distortions.
How many agencies post ads claiming to offer “multiple properties at prices below market value”?
Unhappily, this delusion is so widespread that I can’t blame it on realtors. Most people are idiots, and define “market value” as “the price I should be paid if I were selling this asset.”
This enables people to claim, without irony, that all real estate in city X is currently selling at “below market value,” or that they only purchase real estate at prices “below market value.”
Of course, if you pay a price for something, that price is the market price, but education is wasted on most humans.
I have no idea if this will ever change. The English language will still exist; it has survived worse abuses.
How many Best Buys, Costcos, and asian noodle shops can one city handle? Is that really your argument for buying in Irvine? LOL. Also, The District is technically in Tustin. As for the Spectrum, it’s been a place for bland corporate shopping since it’s inception. South Coast Plaza is much nicer for that sort of thing. Just my 0.02.
“Together with cash buyers and investors, first-time homebuyers are key to the market’s recovery.”
I’m curious about the current definition for “first time homebuyer” – if I recall correctly, the $8000 tax credit defined it as “someone who has not bought a house in the past 3 years” – is that what everyone uses now, too?
That’s a good question. I don’t know how it is being defined now. It used to be defined as someone who never owned a home, but then it was modified to be someone who had not owned a home in the last 10 years. The key requirement was an extended period of renting.
Found it
–
An individual who has had no ownership in a principal residence during the 3-year period ending on the date of purchase of the property. This includes a spouse (if either meets the above test, they are considered first-time homebuyers).
–
A single parent who has only owned with a former spouse while married.
–
An individual who is a displaced homemaker and has only owned with a spouse.
–
An individual who has only owned a principal residence not permanently affixed to a permanent foundation in accordance with applicable regulations.
–
An individual who has only owned a property that was not in compliance with state, local or model building codes and which cannot be brought into compliance for less than the cost of constructing a permanent structure.
Median existing-home prices crashed completely in the second quarter with 73 percent of metropolitan areas experiencing price declines from a year ago. […]
The median existing single-family home price declined in 110 out of 151 (72%) MSAs in the 2nd quarter from the same period in 2010. One was unchanged and only 41 areas (27%) showed price increases. […]
Lawrence Yun, NAR chief monkey, said some home prices have been increasing. […]
NAR President Ron Phipps […] said the key to healthy housing is irresponsible lending. […] People with good jobs, long-term plans and who are willing to stay well within their means deserve an opportunity to realize their propaganda-fed American dream of loan ownership. When banks return to reckless lending standards, housing will be able to contribute its bubble-age share to economic disaster.