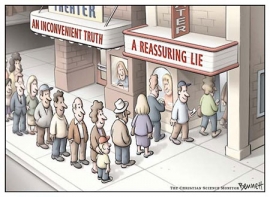
People make many choices in life both good and bad. Some people are traveling the highway to hell, some to heaven, and most have no clue where they are going one day to the next. In the aftermath of the housing bubble, many people find themselves caught up in morally ambiguous situations. People who continue to occupy real estate they have no equity in and do not pay for are not breaking any laws, and they are receiving a significant reward for their behavior. That doesn't make it right.
The couple that is the focus of today's featured article are also occupying real estate they don't own and aren't paying for. Rather than being rewarded, these people are going to jail. Is there really much difference between them and the multitudes of delinquent borrowers?
By EUGENE W. FIELDS — Published: Jan. 6, 2011 — Updated: 3:04 p.m.
THE ORANGE COUNTY REGISTER
NEWPORT BEACH – A husband and wife were arrested Thursday morning and face charges of illegally living in homes as squatters.
Chris Wayne Duncan, 42, and Robin Ann Duncan, 36, both of Newport Beach, were each charged with one felony count of conspiracy to commit second-degree burglary, second-degree burglary and unauthorized entry of a dwelling, according to the Orange County District Attorney's Office.
If some enterprising attorney wants to take on this case, I will give plenty of free press coverage here. How can we convict these people of anything given how much legal squatting goes on today? Delinquent loan owners are also occupying real estate they are not paying for. The only difference is that loan owners got a lender to give them purchase money on the false promise that the borrower would pay them back. The only difference between these people who might go to jail and delinquent borrowers is that the borrowers signed some papers and made promises of repayment that they did not keep. At least the squatters were open about their theft.
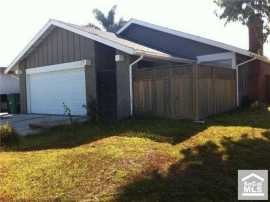
Chris Duncan is accused of finding properties that were in foreclosure and vacant. In September 2010, prosecutors allege, the Duncans drafted a fraudulent lease of 10 Hidden Pass – a foreclosed and vacant property in Newport Coast – and then broke in and illegally moved in.
It takes nerve and style to squat in a Newport Coast house. They probably could have gotten away with it in Riverside County. BTW, 10 Hidden Pass is a perfect example of shadow inventory.
According to the District Attorney's Office, the couple claimed to be renters of the property and had utilities turned on in their names to give the appearance of legitimate tenancy.
In October, when an appraiser went to the property as part of the process of short sale, the Duncans changed the locks and kept the appraiser from entering the home, prosecutors said. The couple is accused of telling the appraiser that they were legal renters and that the owner should contact the Duncans directly.
According to the District Attorney's Office, the owner then contacted the Newport Beach Police Department, which investigated the claim and arrested the Duncans.
The Duncans are each being held in lieu of $25,000 bail. An arraignment date is pending.
If convicted, the couple faces up to three years in state prison.
Is it harsh to call out the people living in homes they aren't paying for? Are these poor, downtrodden homeowners who are struggling to meet their obligations deserving of my compassion? Were these squatters duped into taking hundreds of thousands of dollars in mortgage equity withdrawal?
I say no. These people made a promise to either pay back the loan or give back the house. I have no problem with them not paying back the loan. They are exercising a contractual right if they strategically default. There are legitimate family hardships that justify defaulting on the mortgage. However, after people default, they need to get out of the house. They need to stop squatting and make room for a family that can afford the house. The squatting is far more irritating than the mortgage default.
Family home of 22 years lost to pre-foreclosure borrowing
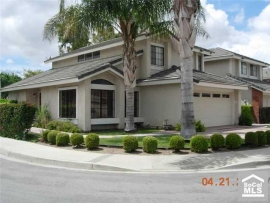
IRVINE, Calif. — The Spendthrift family of Irvine Village University Park lost their family home. A house they owned since 1989 when they bought the property for $232,100.
The Spendthrifts enjoyed twenty-two years of the ups and downs of the housing market. They bought in the middle of the second irrational price rally to hit California real estate. The floated on the froth of equity vapor the held the Irvine market up from 1990-1997. They had learned by the late 1990s how to serial refinance to raid their home equity whenever they needed it.
Apparently they needed it quite regularly.
On 4/14/1989 they paid $228,500. Their mortgage information is not known, but it was likely an 80% loan with 20% down, $182,800 and $45,700 respectively.
On 5/14/1998 they refinanced with a $169,500 first mortgage.
On 7/15/1998 they obtained a stand-alone second for $45,200, and the Ponzi scheme began.
On 11/30/1999 they obtained two stand-alone second mortgages for $36,570 and $25,500.
On 10/30/2000 they obtained another subordinate mortgage for $46,000.
On 8/15/2001 they refinanced the first mortgage for $256,000.
On 9/7/2001 they opened a HELOC for 64,000.
These refinancings go on and on and on….
On 6/10/2003 they refinanced with a $322,700 first mortgage.
On 12/22/2003 they obtained a $100,000 HELOC.
On 9/18/2004 they opened a $150,000 HELOC.
On 6/28/2005 they got a $200,000 HELOC.
On 3/8/2006 they refinanced one last time with a $508,000 first mortgage and a $85,000 stand-alone second.
Total property debt is $593,000.
Total mortgage equity withdrawal is $410,200.
They stopped paying in mid-2009, so they have been squatting for about 18 months so far.
Somewhere along the way, do you think those borrowers realized they were Ponzis? Did their blind faith in contiinued house price appreciation make their borrowing appropriate? Do you think they will feel any guilt about taking all that money? Or does the pain of losing their house wipe their conscience clean?
During the Great Housing Bubble, when prices more than doubled in about 5 years, the Spendthrifts went back to the housing ATM over and over to satisfy their growing level of entitlement.
Then prices went down, their payments came due, and nobody would extend them another loan to make those payments. Their personal Ponzi scheme collapsed. It's over. They lose the house.
Twenty-two years after buying the property, these loan owners are going to leave penniless, their credit in tatters, and their faith in California real estate appreciation being put to the test. They will not own again for a while, nor will they get the free money ownership entails. It must suck for them to live within their means after not having to for so long. Are you tearing up for them?
-$424 ………. Tax Savings (% of Interest and Property Tax)
-$561 ………. Equity Hidden in Payment
$34 ………. Lost Income to Down Payment (net of taxes)
$61 ………. Maintenance and Replacement Reserves
============================================
$2,384 ………. Monthly Cost of Ownership
Cash Acquisition Demands
——————————————————————————
$4,900 ………. Furnishing and Move In @1%
$4,900 ………. Closing Costs @1%
$4,729 ………… Interest Points @1% of Loan
$17,150 ………. Down Payment
============================================
$31,679 ………. Total Cash Costs
$36,500 ………… Emergency Cash Reserves
============================================
$68,179 ………. Total Savings Needed
Property Details for 5322 PLUM TREE Irvine, CA 92612
——————————————————————————
Beds: : 3
Baths: : 2
Sq. Ft.: : 1372
Lot Size: : 1,500 Sq. Ft.
Property Type:: Residential, Single Family
Style:: One Level, Ranch
Year Built: : 1974
Community: : University Park
MLS#: : S599118
Source: : CARETS
Status: : Pending
——————————————————————————
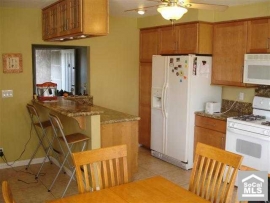
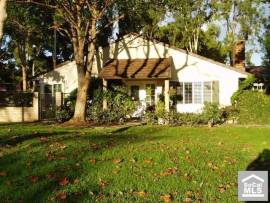
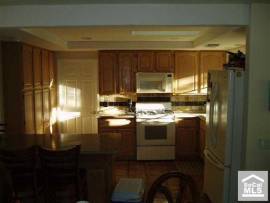
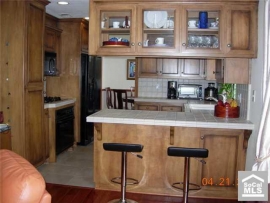
Upgraded University Park Home With Remodeled Kitchen, Recessed Lights, French Doors, Skylights And Much More. Bright And Open Floor Plan Featuring Large Living Room With Fireplace, Sunny Kitchen With A Bay Window, Two Large Private Patios. Tract Is Like No Other With Huge Parks, Lots Of Trees, Private Driveways, Assoc Maintained Front Lawns And Landscaping, Pools/spas/clubhouse.
I hope you have enjoyed this week, and thank you for reading the Irvine Housing Blog: astutely observing the Irvine home market and combating California Kool-Aid since 2006.
Most people try to avoid pain, physical, emotional, financial. Anyone focused on playing in the California housing market Ponzi scheme, there is only one painless feat: pass the debt off to another person. Give them your seat and let them own the mortgage. Think about the windfall received by those few that sold in 2005-2007 and rented. Those left owning loans are feeling major pain.
The Federal Reserve exists to foster moral hazard by preventing banks, businesses, and consumers from feeling the ill effects of their poor financial decisions. The Federal Reserve has purchased $1,200,000,000,000 in mortgage-backed securities in an effort to lower interest rates and make the sky-high prices of the bubble affordable. They have printed money through two rounds of quantitative easing, and they help lenders dodge regulation that might expose their insolvency or hinder their business. Given the mission and behavior of the Fed, it is surprising when they publish a fact-filled paper with careful analysis, particularly when that paper is critical of government policy.
In the mid-1990s, the public policy goal of increasing the U.S. homeownership rate collided with a huge leap in financial innovation. Lenders shifted from originating and holding mortgages to originating and packaging them for sale to investors. These new financial products enabled millions of Americans who hadn’t previously qualified to buy a home to become owners. Housing construction boomed, reaching a postwar high—9.1 million homes were built between 2002 and 2006, a period when 5.6 million U.S. households were formed.
That is a huge supply imbalance. And like Ireland, much of this supply exists in areas where there is little or no demand. Second home communities are inundated with houses that nobody can finance at prices several times what local incomes can support.
The resulting oversupply of homes presents policymakers with a formidable challenge as they struggle to craft a sustainable economic recovery. Usually a driver of economic recoveries, the housing market is foundering as an engine of growth.
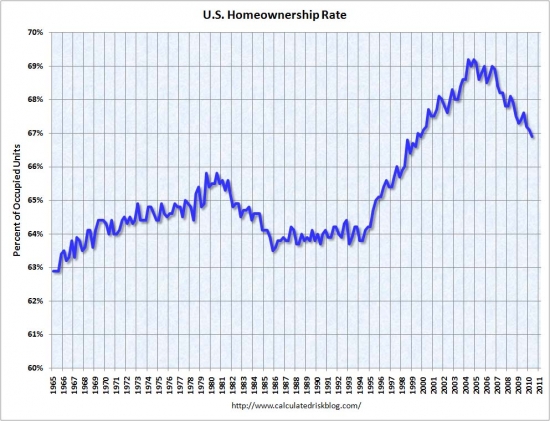
Generations of policymakers since the 1930s have sought to increase the homeownership rate. By the late 1960s, it had reached 64.3 percent of households, remaining there through the mid-1990s, in apparent equilibrium with household formation during a period of sustained U.S. economic growth. A fresh push to increase ownership drove the rate up 5 percentage points to its peak in the mid-2000s. Home price gains followed the rate upward.
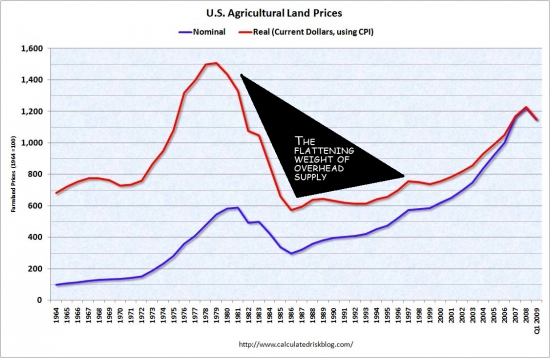
Reverting to the Mean Price
As gauged by an aggregate of housing indexes dating to 1890, real home prices rose 85 percent to their highest level in August 2006. They have since declined 33 percent, falling short of most predictions for a cumulative correction of at least 40 percent.[1] In fact, home prices still must fall 23 percent if they are to revert to their long-term mean (Chart 1). The Federal Reserve’s purchases of Fannie Mae and Freddie Mac government-sponsored-entity bonds, which eased mortgage rates, supported home prices. Other measures included mortgage modification plans, which deferred foreclosures, and tax credits, which boosted entry-level home sales.
Adjusting for inflation, prices almost certainly will fall. The relationship between inflation and house price that have been stable for over a century doesn't suddenly break down and fail to limit home prices. If we manage to ignite inflation, we may get prices to hold up on a nominal basis, but adjusting for inflation, prices will fall significantly.
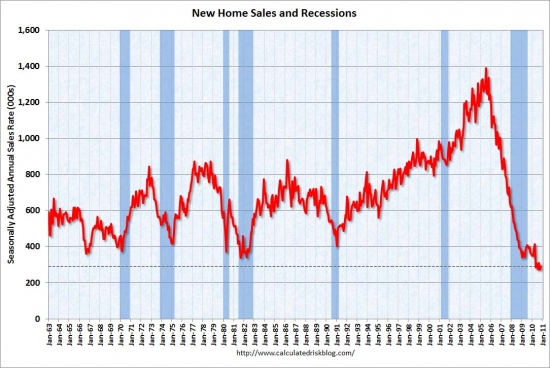
Measuring the success of these efforts is important to determining the trajectory of the economic recovery and providing policymakers with a blueprint for future action. New-home sales data, though extremely volatile, are considered a leading indicator for the overall housing market. Since expiration of the home-purchase tax credit in April, sales have fallen 40 percent to an average seasonally adjusted, annualized rate of 283,000 units. This contrasts with the three years through mid-2006 when monthly sales averaged 1.2 million on an annual basis. Before the housing boom and bust, single-family home sales ran at half that pace. Because current sales are at one-fifth of the 2005 peak, new-home inventories—now at a 42-year low—still represent an 8.6-month supply. An inventory of five to six months suggests a balanced market; home prices tend to decline until that level is achieved.
One factor inhibiting the new-home market is a growing supply of existing units. The 3.9 million homes listed in October represent a 10.5-month supply. One in five mortgage holders owes more than the home is worth, an impediment that could hinder refinancings in the next year, when a fresh wave of adjustable-rate mortgages is due to reset. The number of listed homes, in other words, is at risk of growing further. This so-called shadow inventory incorporates mortgages at high risk of default; adding these to the total implies at least a two-year supply.[2]
As predicted, the recasting of Option ARMs and interest-only ARMs is causing many borrowers to stop making payments. Many of those borrowers used that financing because they were in an inflated market. Many of those markets have crashed leaving the borrower deeply underwater and facing a much larger loan payment.
The surprise with the mortgage resets is the lack of foreclosures and foreclosure inventory to push prices lower. Mostly, this is due to amend-extend-pretend and the massive buildup of shadow inventory. These bad loans are out there, and this inventory will eventually make it to the market. How The Lending Cartel Disposes Their REO Will Determine the Market’s Fate.
The mortgage-servicing industry has struggled with understaffing and burgeoning case volumes. The average number of days past due for loans in the foreclosure process equates to almost 16 months, up 64 percent from the peak of the housing boom. One in six delinquent homeowners who haven’t made a payment in two years is still not in foreclosure.[3] Mounting bottlenecks suggest the shadow inventory will grow in the near term.
Notably, not all homeowners in arrears suffer financial hardship due to unaffordable house payments. Those with significant negative equity in their homes may choose to default even though they can afford to make the payments. Such “strategic default” is inherently difficult to measure; one study found 36 percent of mortgage defaults are strategic.[4] Though the effect is not readily quantifiable, the growing lag between delinquency and foreclosure provides an added inducement for this form of default.
One set of policies to aid home-owners in dire straits involves mortgage modifications, though these efforts have only minimally reduced housing supplies. The most far-reaching effort has been the Making Home Affordable Program (previously the Home Affordable Modification Program, or HAMP), in effect since March 2009. After only one year, cancellations—loans dropped from the program before a permanent change was completed—eclipsed new modifications (Chart 2). Since March, the number of cancelations has continued to exceed new trial modifications, which involve eligibility and documentation review, and successful permanent modifications.
In short, to the surprise of no one, the government run loan modifications programs have been a total failure by any performance metric.
The fact that many mortgage holders have negative equity in their homes stymies modification efforts. In the case of HAMP, the cost of carrying a house must be reduced to 31 percent of the owner’s pretax income. Even if permanent modification is achieved, adding other debt payments to arrive at a total debt-to-income ratio boosts the average participant’s debt burden to 63.4 percent of income. In many cases, the financial innovations of the credit boom era, enabling owners to monetize home equity, encouraged high aggregate debt.
You have to love academic writing. Note the euphemism “enabling owners to monetize home equity” when they meant that banks were giving out free money under the guise of “innovation.” The Fallacy of Financial Innovation.
A study found that in a best-case outcome, 20 to 25 percent of modifications will become permanent.[5] In 2008, one in three homeowners devoted at least a third of household income to housing; one in eight was burdened with housing costs of 50 percent or more.[6] Failed modifications suggest that, without strong income growth, the bounds of affordability can be stretched only so far.
Let's stop for a moment to ponder the math: if best-case scenario is for 20% to 25% of loan modifications to work, then at least 75% will fail. With around 10 million distressed loans, at least 7.5 million of them will not cure through loan modification. Far fewer will cure through paying back the loan balance, so that leaves short sale and foreclosure. Since most short sales fail, that leaves only foreclosure. We will see a lot more foreclosures than pundits are willing to admit.
Without intervention, modest home price declines could be allowed to resume until inventories clear. An analysis found that home prices increased by about 5 percentage points as a result of the combined efforts to arrest price deterioration.[7] Absent incentive programs and as modifications reach a saturation point, these price increases will likely be reversed in the coming years. Prices, in fact, have begun to slide again in recent weeks. In short, pulling demand forward has not produced a sustainable stabilization in home prices, which cannot escape the pressure exerted by oversupply (Chart 3).
The data clearly shows the fake prosperity of the tax credit, and the devastating impact of its expiration.
Lingering Housing Market Issues
About 3.6 million housing units, representing 2.7 percent of the total housing stock, are vacant and being held off the market. These are not occasional-use homes visited by people whose usual residence is elsewhere but units that are vacant year-round. Presumably, many are among the 6 million distressed properties that are listed as at least 60 days delinquent, in foreclosure or foreclosed in banks’ inventories.
Recent revelations of inadequately documented foreclosures and the resulting calls for a moratorium on foreclosures—what was quickly coined “Foreclosuregate”—threaten to further delay housing market clearing. While home price declines may be arrested as foreclosure paperwork issues are resolved, the buildup of distressed supply will only grow over time.
Lenders are hoping the inventory problems will simply resolve themselves as a resurgent economy sparks a great deal of household formation and sparks demand for a huge inventory of empty houses. It isn't going to happen.
Perhaps less obviously, some lenders with the means to underwrite new mortgages will remain skeptical about the underlying value of the collateral.
This is the real problem with delaying the bottom. Other than the FHA or the GSEs which are backed by the government, who else is confident enough about the stability of home values to take risk with new home loans? Nobody is. That's why the combined government programs now account for about 99% of the housing market. It is also why very few jumbo loans are being originated.
With nearly half of total bank assets backed by real estate, both homeowners on the cusp of negative equity and the banking system as a whole remain concerned amid the resumption of home price declines.[8] This unease highlights the housing market’s fragility and suggests there may be no pain-free path to the eventual righting of the market. No perfect solution to the housing crisis exists.
The latest price declines will undoubtedly cause more economic dislocation. As the crisis enters its fifth year, uncertainty is as prevalent as ever and continues to hinder a more robust economic recovery. Given that time has not proven beneficial in rendering pricing clarity, allowing the market to clear may be the path of least distress.
May be the path of least distress? The band aid analogy is best. We should have ripped the band aid off and been done with the pain. Instead, we have gone through heroic efforts to prop up prices and merely spread out the pain over a longer timeframe. The insolvent bankers undoubtedly like the path we chose. I, for one, think it was a mistake.
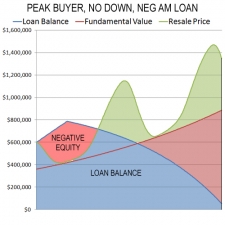
Peak buyer trying to save what she can
As people abandon hope of another market rally to save them and their finances, they take a hard look at their expenses and ask, “Why are we paying so much for this mortgage?” If there is no additional return on their investment, many will lose faith in rapid appreciation and sell out. It's all part of the capitulation process.
Today's featured property was purchased on 4/20/2007 for $673,000. The owner used a $538,400 first mortgage and a $134,600 down payment. If she gets her asking price and pays commission, she loses about $50,000. So for the last four years, she has been paying far more in cost of ownership than the cost of rental, and she is going to lose another $75,000 to the market. I imagine she thinks that sucks.
-$487 ………. Tax Savings (% of Interest and Property Tax)
-$632 ………. Equity Hidden in Payment
$258 ………. Lost Income to Down Payment (net of taxes)
$83 ………. Maintenance and Replacement Reserves
============================================
$2,815 ………. Monthly Cost of Ownership
Cash Acquisition Demands
——————————————————————————
$6,600 ………. Furnishing and Move In @1%
$6,600 ………. Closing Costs @1%
$5,280 ………… Interest Points @1% of Loan
$132,000 ………. Down Payment
============================================
$150,480 ………. Total Cash Costs
$43,100 ………… Emergency Cash Reserves
============================================
$193,580 ………. Total Savings Needed
Property Details for 12 PLEASONTON Irvine, CA 92620
——————————————————————————
Beds: 3
Baths: 2 full 1 part baths
Home size: 1,703 sq ft
($388 / sq ft)
Lot Size: 4,000 sq ft
Year Built: 1985
Days on Market: 209
Listing Updated: 40540
MLS Number: S620211
Property Type: Single Family, Residential
Community: Northwood
Tract: Othr
——————————————————————————
EQUITY SALE!! NOT REO!! NOT Short Sale!! Beautiful Northwood area. NO MELLO ROOS! LOW tax rate. HOA $70/mo. Single Family Detached Former Model Home. Bright open floor plan, lots of windows, plantation shutters, custom cabinets & crown molding. Beautiful hardwood floors. Living Rm & Dining Rm w/ vaulted ceiling. Family Rm w/ fireplace, custom computer center & sliding French door. Kitchen w/ custom cabinets & Italian tile floor. Master Bedrm w/ walk-in closet & vaulted ceiling. Jetted Tub. Brick patio w/ patio cover, 2 car garage w/ roll-up garage doors & cabinets. Laundry Rm w/ custom cabinets. Across Assoc bbq, tot lot, swimming pool/spa & Orchard Park w/ basketball courts, playground, bbq, picnic area, baseball/soccer field. Walk to tennis courts, parks, aquatic center, library, stores, schools. Great Irvine Unified School District Award Winning Schools. Minutes from OC beaches, museums, Irvine Spectrum, District, Tustin Marketplace, Fashion Island, South Coast Plaza & Great Park.
John Burns, founder of John Burns Real Estate Consulting in Irvine …
Us: What’s your Orange County housing outlook for 2011 …
John: I think prices along the coast will fall because they have lagged the decline that occurred elsewhere, and I think home price reality will set in for most homeowners, who still believe their home is worth more than it is.
I like how John tells it like it is.
Otherwise, the government has become so involved in housing that we have become totally subject to their decisions, so projecting 2011 housing involves getting inside the heads of (Fed chair) Ben Bernanke, (Treasury secretary) Tim Geithner, (influential congressman) Barney Frank, new Federal Housing Finance Agency Commissioner Joseph Smith and 50 state Attorney Generals. Together, they are artificially holding down mortgage rates and down payment requirements, and intervening in foreclosure activities. The intervention will certainly continue in 2011.
Forecasting government policy in response to the housing and credit bubbles is difficult. I did not foresee the government takeover of the GSEs. I did not foresee the Federal Reserve buying mortgage-backed securities. I did foresee the endless bailouts and false hopes, but I did not foresee the government taking it quite so far with all the loan modification programs. Prices did not fall as much as I expected partly due to government intervention and partly due to lenders not foreclosing and releasing properties to the market — something lenders are enabled to do by amend-extend-pretend and government policy.
Us: What will be the 2011 drivers of real estate change, good or bad? Why?
John: The good news is that we will have solid job growth, which will bring back some demand to the market. However, many delinquent mortgages need to be resolved, which will likely result in enough foreclosure activity to depress home prices.
In brief, that is exactly the dynamic we will face for the next three years. As the economy picks up and people go back to work, the housing market will not recover, and everyone will think it is some big mystery. In reality, the overhang of supply from distressed loans is going to hurt the market more than employment can help it. Without employment growth, the housing market has no chance of recovery, but even with good employment growth, there will be a protracted grinding slowness to the house price recovery.
Government-sponsored enterprises reform (Fannie Mae and Freddie Mac), which will drive mortgage qualification requirements, will be the biggest topic of the year. Geithner is issuing his reform recommendations in January, and the FHFA Commissioner is brand new, so nobody knows what they have in mind. My bet is that there is more talk than action, but mortgage qualification will tighten nonetheless.
You get fools like Lawrence Yun claiming qualifying for a mortgage is already too difficult when in reality, we are only returning to sane lending practices of a bygone era. Qualification standards will tighten because they have to. Far too many borrowers are already giving up on their mortgage payments. Only the best loan candidates should be extended credit if the market is ever going to stabilize and rid itself of the foreclosures.
Us: OK. We love numbers. How much — in percentage points — will the median selling price of an Orange County home change in the coming year. What’s one thing that might alter that prediction — up or down?
John:We estimate that the median price in 2011 will be $480,000, which is 7% below our 2010 estimate of $515,000. Keep in mind that the median home price used to be a good number because it represented a typical 3-bedroom, 2-bath home in a typical neighborhood. In the last few years, transaction volumes plummeted and affordable areas such as Santa Ana were over represented, so the county’s price correction was overstated (it was $476,000 in 2009), and now that overrepresentation is being reversed by a shift back to typical, higher-priced neighborhoods. The right way to look at most neighborhood home values is to assume we will bottom at values that were achieved in 2003.
What would have been a 2001 pricing bottom in 2011 is probably going to be pushed back to a 2003 price-point bottom in 2013.
Us: What’s your top worry about the real estate climate for 2011? Why?
John: We are concerned that the pool of renters who can come up with a down payment and qualify for a mortgage is very low, and the government is likely to raise down payment requirements while mortgage rates rise, so most of the entry-level demand will end up in the apartment market. Also, the government intervention is likely to end with rapidly rising mortgage rates, probably after 2011.
Tightening requirements and rising interest rates does not sound like a good environment for house price appreciation.
Us: What will be the real estate surprise we’ll be talking about a year from now? Why?
John: Consumer research will drive brand new home designs that will be wildly successful. Home builders are already talking about the because the success at Woodbury was the biggest home building story of 2010, locally and nationally. The Irvine Co., which sets home building trends nationally year in and year out, set the trend in 2010 when they reopened Woodbury after conducting significant consumer research, and then exceeded everyone’s wildest expectations by selling far more homes at higher prices than anyone imagined. We are gearing up. Mollie Carmichael, our principal who worked at Irvine Co. for 10 years, is very busy leading our consumer research practice. She just managed a consumer survey with 10,000 participants to get the big picture changes in home buyers, and is finding that developers and builders are finally doing real research to figure out what the consumer wants before committing to spend millions in construction costs based on a hunch.
John is happy to have the Irvine Company as a client. Good for him. They were one of the few developers doing anything over the last two years.
What John has predicted is an extension of a process already underway:
December 30th, 2010, 11:00 am — posted by Jon Lansner
Sellers of pricier Orange County homes continue to feel stiff pricing pressures.
That’s from a slightly different view of the Orange County housing market from HousingTracker.net. It tracks trends in asking prices from brokers’ MLS system of homes for sale. In addition, HousingTracker breaks down its data into a pair of neat markers — the 25th and 7th percentiles that let us see how the market’s upper crust and more modest abodes are faring.
Orange County 25th Percentile, Median and 75th Percentile Home Price
From the December report we see …
At the 25th percentile — the median of the lower half of the price spectrum of local homes for sale, the selling price was $298,000. That is down 0.6% vs. the previous month, fourth consecutive dip. It’s also off 1% vs. a year ago, first such drop since November 2009. Over two years, there’s been an 0.1% increase in prices sought by sellers of more affordable local homes.
At the 75th percentile — the median of the upper half of the price spectrum of local homes for sale — price cuts were far steeper. December’s selling price was $648,250 — down 2.6% vs. the previous month, the 6th consecutive dip. Prcing is off 13.2% vs. a year ago, drop No. 9 in a row. Over two years, all told, there’s been an 13.4% decline in prices asked for higher-end housing.
This has narrowed the gap between these two price points. It was 118% this month vs. 122% in the previous month and 148% a year earlier. The gap peaked at 167% in June and July 2009.
The overall Orange County median listing price, by this math, was $423,722 – off 2.1% vs. the previous month and down 7.6% vs. a year ago. Over two years, there’s been a 4.6% decline in total.
Why are high end loan owners lowering their asking prices? Because they are too high! Incomes don't support high end pricing, so the prices have to come down to match the reality of what market participants make and what they can finance. It isn't more complicated than that. That is why the same high-end price drops can be seen in most California markets.
By Phillip Reese and Robert Lewis — Published: Sunday, Jan. 2, 2011
Within the gates of the exclusive Los Lagos development in Granite Bay, home to business executives and real estate magnates, the postman delivers almost one fresh home loan default notice a month.
Mortgage defaults are not just a problem of the poor. Sacramento's wealthiest residents are defaulting on their recent home loans at least as often as everyone else – and in some posh enclaves, more, according to a Bee analysis of federal mortgage data and figures from Foreclosures.com.
Banks have filed about 550 default notices on local home loans of more than $1 million since 2007. The total value of those loans is roughly $750 million.
Estates on the west side of Folsom Lake form the epicenter of the trend. In this strip of Placer County, banks have filed four default notices for every 10 home loans of more than $1 million issued during 2006 and 2007.
Forty percent of loans over $1,000,000 from 2006 and 2007 have received a notice. That is an astonishing number. Forty percent? How is that market going to replace 40% of the homeowners at the high end without crushing prices?
“Everyone always has delusions of grandeur. At some point you have to accept this is what it is,” said Folsom resident James Caramazza, who took a hit on his $1.4 million loan following a short sale.
One difference between the poor and the rich: Fewer expensive homes are actually going back to lenders. Instead, short sales abound; currently, there are 95 short sales priced over $600,000 in the region, according to MetroList MLS.
The amend-extend-pretend policy has created numerous mid to high end neighborhoods where many of the residents are squatters who continue to enjoy their entitlements. Whatever federal bailout moneys are used to cover these losses come right out of your wallet… Actually, since we are running huge budget deficits, the money is coming out of your children's wallets.
Banks are more likely to approve short sales on big loans because so much cash is at stake; because it's expensive to maintain a mansion; and because wealthy homeowners often have enough money to hire a real estate lawyer to negotiate, several local real estate experts said.
That is demonstrably not true. Have any of you noticed short sales going through at the high end? The main reason short sales are not effective with high end borrowers is because many of these people have other assets they are not willing to part with. A short sale generally requires the seller to prove they are broke. Although many do their best to hide their assets, lenders are not completely clueless when it comes to collections, so they demand endless paperwork in a cat-and-mouse game of hiding money.
Recent short sale attempts following mortgage defaults include radio personality Tom Sullivan and former Kings basketball stars Kevin Martin and Ron Artest. Martin and Artest could have covered their loans with a portion of their annual, multimillion salaries – a fact that angered some local residents.
“It's not fair and it's not right,” said Madelyne Moreno, a Rio Linda resident struggling to get her bank to approve a short sale on a more modest loan. “They can turn around and get another home immediately.”
But a lot of the region's largest defaults aren't strategic “walkaways.” The recession has hit the wealthy hard, too, and many couldn't afford to keep making payments on their big houses.
The number of local households earning more than $1 million annually fell 20 percent from pre-recession 2006 to midrecession 2008, from 1,434 to 1,135, according to the latest figures from the Franchise Tax Board.
I have to wonder how accurate the bubble numbers were on incomes. How many people were counting the “income” from their home price appreciation, and how many believed their liar loan applications?
The housing market was largely behind the earlier wealth influx, and its transitory nature.
Many newly flush real estate developers and brokers bought huge homes in the boom and quickly lost them in the bust – like winning a cake in a raffle and then falling into it face first.
'I thought I was real smart'
Leonard Brand, a longtime Tahoe-area real estate agent, said his default wasn't strategic but stupid.
Brand owned his $3 million home in South Lake Tahoe free and clear in 2005 when he decided to take out nearly $1.7 million to invest.
“I thought I was real smart,” Brand said.
Those investments tanked and Brand could no longer afford his loan payments.
That is perhaps the stupidest investment story of the housing bubble. He owned his home with no debt in 2005, a remarkable feat given the culture of the day, and he managed to borrow so much in the last couple of years of the bubble that he managed to lose it all.
So he enlisted a colleague in his office to work on a short sale, eventually reaching a bank vice president who approved a deal. The home sold for $1.4 million in April. Since then, Brand has managed to buy another home for $700,000 from someone he knew who helped with the financing.
Caramazza, whose family owned a development company felled by the market collapse, never even got to live in his swank Granite Bay home.
He and his wife took out a $1.4 million construction loan from Countrywide in May 2007 to build a house on 2.3 acres of land on Bella Terra Place in Granite Bay.
When the economy went south, Caramazza tried to sell his home in Folsom and move into the Granite Bay home.
The Folsom home, however, just sat on the market. So Caramazza tried to sell the Granite Bay home. He got some nibbles, but eventually dropped the price from $1.99 million to $1.59 million to $1.49 million.
Finally, he turned to a short sale and unloaded the Granite Bay home for $900,000, losing some equity. He also later sold his Folsom home and bought a smaller, 2,300-square-foot home, also in Folsom.
Caramazza and Brand are two of the dozens of real estate and investment professionals to default on large mortgage loans in the past few years, The Bee review found. The list is dotted with real estate agents, brokers, investment advisers, bankers and some high-profile developers.
People in real estate believed their own bullshit. Now they are paying the price.
Fewer houses priced in millions
During the housing boom, million-dollar home loans were a small, lucrative slice of the market.
In 2006 and 2007, banks approved about 1,400 home loans of $1 million or more in the four-county area, according to federal loan data. Since then, they've filed about 415 default notices on those loans, according to a Bee survey of listings from Foreclosures.com.
That's three default notices for every 10 big loans during that period, about even with the default rate for the rest of the region.
Today, with the market still depressed, there are far fewer houses selling for millions. Banks approved fewer than 150 home loans of $1 million or greater during 2009, an 80 percent drop from 2007.
So I ask you again, where is the money going to be coming from to support high end pricing? If the banks don't provide it, do you really believe there are enough foreign cash buyers to make up the difference?
Contributing to the malaise: tighter rules by lenders.
“You have to come up with a 30 to 35 percent down payment” to take out a jumbo loan, said Nick Sadek, a local real estate broker who specializes in high-end sales.
Sadek and others say homes that once sold for more than $1 million locally are now selling for at least 40 percent less. A large proportion of buyers these days, Sadek said, work in medicine, one of the few sectors still growing.
There's disagreement among real estate experts about how the sale of distressed mansions affects people trying to sell modest homes. Some called expensive homes a niche that operates in its own space. But Patrick Hake, a Placer County Remax Gold broker who sells a broad mix of homes, said everything's connected.
“If you have a home that used to be $1.5 million selling for $800,000, another home that used to be $800,000 will go for something less,” Hake said.
It's called the substitution effect, and it is very real. One high priced homes start coming on the market, prices are going to melt down.
Whatever its impact and causes, the million-dollar-home crash is likely not over. During 2010, banks issued about three default notices on $1 million home loans each week, a trend that continued through December.
Warren Adams, a real estate broker who specializes in foreclosures, thinks banks are holding a “shadow inventory” of high-end homes because they don't want to flood the market.
“I've been surprised that I have not seen more of the high-end stuff,” he said. “The banks are sitting on them. I keep saying that is going to be our next wave.”
It will be the next wave. Or perhaps we could call it the next slow leak. If the cartel collapses, the slow leak could become a torrent, but there are few signs that the cartel is ready to capitulate yet.
$1,068,600 in mortgage equity withdrawal
The higher up the housing ladder people reached, the more free money they were rewarded with by bankers. Now that lenders know they are out millions of dollars, they are choosing not to foreclose on squatters like the owners of today's featured property. The rich take the money and squat too.
Foreclosure Record
Recording Date: 08/06/2010
Document Type: Notice of Default
This house was purchased for $730,000 on 4/29/1999. The owners used a $583,900 first mortgage and a $146,100.
On 9/8/1999 they opened a HELOC for $50,000.
On 11/19/2002 they obtained a HELOC for $560,000.
On 11/28/2005 they got a new HELOC for $500,000.
On 5/3/2007 they refinanced with a $1,452,500 ARM and a $200,000 stand-alone second.
Total property debt is $1,652,500.
Total mortgage equity withdrawal is $1,068,600.
Total squatting time is 7 months so far.
Over $1,000,000 in mortgage equity withdrawal… That's a lot of money. Will someone buy this house and pay off this family's debts?
***TREMENDOUS OPPORTUNITY TO OWN A MINI-MANSION IN AWARD WINNING GATED ROSEGATE BY THE ORIGINAL TAYLOR WOODROW*** Up to 7 bedrooms, 6.5 baths with 4 car garage in almost 5,100 square feet. IMMACULATE UPAGREDS WITH MARBLE FLOORING, DESIGNER CARPET, GRANITE EVERYWHERE, TRAVERTINE SHOWERS, TWO GUEST SUITES DOWNSTAIRS, LESS THAN 1 MILE TO AWARD WINNING SCHOOLS, COMMUNITY POOLS, TENNIS, RECREATION AND SHOPPING.
The interest rate cycle is very long, and we are bouncing off historic lows. It is reasonable to think interest rates may go up based on reversion to the mean. The average over the full cycle (down, up, down) is 9%, and interest rates generally hover between 7% and 11%.
Back in early December, I noted Mortgage interest rates hit five-month high. Since then, other pundits are starting to proclaim the end of the era of mortgage interest rates below 5%.
By Les Christie, staff writer — January 1, 2011: 3:47 PM ET
NEW YORK (CNNMoney.com) — The era of near 4% mortgage rates has ended after a quick rate rise since early November. But some industry experts think that may be a good thing for the flagging housing market.
The average 30-year fixed mortgage rate has risen to 4.86% from 4.17%, according to Freddie Mac's weekly mortgage market survey. In the Bankrate.com weekly survey, the rate has risen to 5.02% — crossing the 5% mark for the second time in three weeks — after being as low as 4.42% as recently as early November.
Rates haven't been this high since May and forecasters now predict them to remain between 5% and 6% for all of 2011.
“You can kiss those record lows goodbye,” said Greg McBride, chief economist for Bankrate.com.
Is this a good contrarian indicator? Since everyone is starting to say interest rates are going much higher, will the market reverse and send interest rates back down?
Keith Gumbinger of HSH Associates, a provider of mortgage information said that the market reached a new plateau.
“I don't think we're going back to a 50-year low anytime soon without an economic collapse,” he said. “Rates will probably never revisit those levels.”
That is the essence of the argument: rates will not go back to ultra-low levels as long as their are competing investments where returns are attractive, something which requires an expanding economy.
The increase will push mortgage payments higher for homebuyers. When rates rise from 4.25% to 5% it takes away about 9% of buying power, according to McBride.
“That's nothing to sneeze at,” he said. “But it's still small relative to the steep drop in home prices over the past few years.”
He is right. In Las Vegas where prices are very affordable, a small decrease in affordability will not make much difference; however, in inflated California markets where every penny of affordability is needed to support pricing, rising interest rates will be a serious problem.
Good for the market?
Higher interest rates may even prove stimulating to the still quiet housing market in which sales volume and prices are scraping near their bottoms.
“The initial phase of an interest rate increase generally does not hurt markets,” said Lawrence Yun, chief economist for the National Association of Realtors. “In fact, it can help.”
The rapid rise introduces an element of urgency for potential homebuyers. They may now rush to buy before rates spurt even more.
The strength of the economic recovery will have far more impact on the housing market that this relatively modest increase in mortgage rates, according to Yun. If hiring gains momentum, housing markets should revive.
“If we add 2 million jobs as expected in 2011, and mortgage rates rise only moderately, we should see existing-home sales rise to a higher, sustainable volume,” said Yun.
Gumbinger said that demand for homes may be tempered somewhat by the increased mortgage costs and so affect home prices a bit but the improving job picture and better consumer confidence matter much more.
“If the other factors are aligned,” he said, “interest rates are not a big thing.”
Economists are correct to point out that jobs are the creator of all real estate demand. The unemployed may desire houses, but they don't effectively add to demand.
What follows will be repeated by the NAR often over the next several years. They will complain that “stringent” lending standards are hindering the market and squelching demand. Of course, realtors embraced the Option ARM because it stimulated demand, so we can't count on the NAR to be objective about what lending standards should be.
The real mortgage challenge, according to Yun, is to increase the number of loan applicants winning approvals. Too many potential homebuyers are still finding it difficult to qualify for loans.
“The current mortgage market is a unique situation” he said. “It's less about rates than it is about underwriting standards, which are, in my opinion, still too stringent.”
“If lenders return to more normal, safe underwriting standards for creditworthy buyers, there would be a bigger boost to the housing market and spillover benefits for the broader economy.”
So do you think the era of sub-5% mortgage interest rates is gone for good?
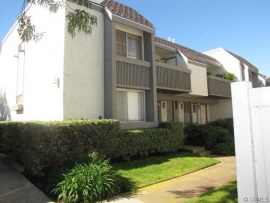
Fannie Mae shadow inventory
In 2011 we will see many properties emerge from shadow inventory. Lenders are not going to let these sit vacant and rot on their books forever. Fannie Mae is moving to liquidate the one that started as a default in mid 2009.
Foreclosure Record
Recording Date: 12/31/2009
Document Type: Notice of Sale
Foreclosure Record
Recording Date: 09/17/2009
Document Type: Notice of Default
Fannie Mae bought the property in May of 2010, and it took them 6 months to get it to market. It must be interesting to be a project manager for the banks. Usually a slow and inefficient project manager wouldn't last long, but they probably rise to the top in the bank's property management department.
The property was originally purchased on 11/2/2000 for $170,000. The owner used a $165,150 first mortgage and a $4,850 down payment.
On 12/31/2001 they refinanced with a $166,500 first mortgage.
On 12/13/2002 they refinanced with a $193,000 first mortgage.
On 8/3/2005 they refinanced with a $233,558 first mortgage.
On 1/4/2006 they refinanced with a $258,748 Fannie Mae first mortgage. The GSEs entered the bubble late as a response to losing market share. This was one of the stupid loans they made that we are now paying for in the GSE bailout.
On 1/12/2007 they obtained a $15,778 HELOC.
On 5/25/2007 they got a $42,663 HELOC.
Total property debt is $301,411.
Total mortgage equity withdrawal is $136,261. Not a lot, but enough to cost them their home.
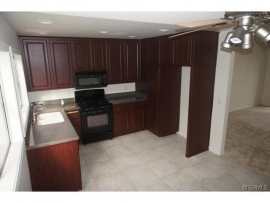
According to the listing agent, this listing is a bank owned (foreclosed) property.
Great opportunity at a great price! Come see this beautiful condo located in wonderful community! Rich dark wood cabinets bring the kitchen to life! New paint and carpet installed throughout makes the property feel like new! Beautiful views of the bay are within walking distance! Don't pass up on this great opportunity!
this is the one of the worst catastrophes in the world.
[indecipherable] its flames…
Crashing, oh!
Four- or five-hundred feet into the sky and it…
it's a terrific crash, ladies and gentlemen.
It's smoke, and it's in flames now;
and the frame is crashing to the ground,
not quite to the mooring mast.
Oh, the humanity!
Herbert Morrison — WLS radio
Housing bubbles are catastrophes. Like the Hindenburg or the Titanic, house prices had an aura of invincibility that came crashing down and sunk to an (under)watery grave.
If a mortgage product were to inflate a housing bubble, the pump and hose that primes the first stages are adjustable rate mortgages. These risky products give the market ability to weather interest rate shocks, but they also provide the air that inflates prices 10% to 15% above stable prices set by using fixed-rate mortgages.
Californians pay too much for their houses because many get trapped into adjustable-rate mortgages to borrow as much as possible. It becomes a rite-of-passage that your first purchase requires you to take on a risky loan and stretch to the max so your bank can extract as much money as possible from your working life.
Some wise up to the adjustable-rate mortgage trap, and they either refinance or move to a different home when their financial situation changes. They take with them the equity built up from the frightened masses that came after and inflated neighborhood values.
Adjustable rate mortgages are not a product I like because it forces borrowers to assume interest rate risk. Many people who use adjustable rate mortgages claim they understand interest rate risk, but in the last 30 years, interest rates have done nothing but go down. There has been no consumer risk in holding adjustable-rate paper.
That changes when interest rates hit the bottom of the cycle and begin to rise.
Each adjustment in rate going forward represents a larger cost to the borrower. Everyone stretching today to get into real estate using an adjustable rate mortgage will face an increasing payment without obtaining any appreciation to compensate. It's a lose – lose. Those using fixed rate mortgages with affordable payments can weather any storm.
Adjustable rate mortgages will burn most who use them over the next decade. Those with assumable fixed rate mortgages will fare the best.
Also, for those awaiting the return of HELOC riches, how much of that equity are you going to borrow at 7% when your primary mortgage is 4.5%?
The article that follows is a bit wonkish, but it provides a detailed explanation of how adjustable rate mortgages impact the California real estate market.
This article discusses how the ratio of adjustable rate mortgages (ARMs) to all loans originated in California can be used to determine the health and direction of California’s near-term real estate market.
Data Courtesy of MDA Dataquick, the US Federal Reserve, and Standard and Poor’s
The above charts present two real estate market perspectives on adjustable rate mortgage loan (ARM) volume in California. Both charts track ARM loans as a percentage of all mortgages recorded in California (the blue line), called the arms-to-loans (ATL) ratio. The first chart juxtaposes California’s ATL ratio with the fixed rate mortgage (FRM) rate for the Western Census Region (the green line), while the second chart joins the ATL ratio with the combined monthly tri-city average of low-tier home pricing in San Diego, Los Angeles and San Francisco (the red line).
The ATL ratio is a crucial measure of the relationship between ARMs and FRMs, and can be used to determine probable sales volume and price movements for 12 and 24 months forward (respectively). [For a more detailed look at home pricing in California, see the first tuesday Market Chart, California Tiered Home Pricing.]
In the top chart, notice the collapse of ARM lending after 2006. ARMs went from nearly 80% of the market down to 2%.
ARMs depend on FRM Rates
The availability of purchase-assist money is the single most powerful engine driving price movement in California real estate transactions, as shown by the boom in sales volume and pricing caused by excess funding in the mid-2000s; a phenomenon called the financial accelerator effect. Purchase-assist money is delivered almost exclusively by either ARMs or FRMs (except for the very few buyers who pay cash). [For more information about the financial accelerator, see the May 2010 first tuesday article, Cleaning up after the ruptured housing bubble.]
Because mortgage financing is so dominant in sales transactions, the friction in the movement between the 30-year FRM Rate and the ATL ratio is essential to the understanding of brokers who wish to hazard a prediction of what lies ahead for their real estate market.
Combined in analysis, these two factors – the FRM rate and the ATL ratio – have the power to predict California’s future home sales volume and price movement. Local market conditions, on the other hand, seem to have little influence on sales volume and pricing, since both are controlled by financing trends, which are moved only by the bond market and federal monetary policies. [For a more global review and critique of ARMs, see the March 2010 first tuesday article, The Danger of an ARMs Buildup.]
The FRM-ATL Connection
30-year FRMs are the most basic and essential form of financing for homebuyers in the real estate market. If FRMs are available at comparatively low rates, and the homebuyer is well-informed (and somewhat rational), the homebuyer will almost always choose the FRM over the much riskier ARM loan.
When ARMs became 80% of the market in 2006, nearly everyone forgot the common sense idea that fixed-rate debt is better. Now that ARMs are nearly extinct, some are lemanting their demise. Good bye and good riddance.
In a normally functioning purchase-assist and refinancing mortgage market, the percentage of ARMs – the ATL ratio – rises and falls only in direct response to changes in FRM rates, in sympathy until friction develops and leads to a deviation in movement between the ATL ratio and FRM rates. Such a deviation is a clear warning of an impending distortion in real estate sales volume and pricing.
As the top chart vividly indicates, observed rises in FRM rates tend to lead to increases in ARM volume, the normal situation. The reasons are intuitive, since ARMs allow borrowers to obtain more funding when the FRM rate increases (sellers refuse to lower their prices in response to FRM rates, so buyers are forced to either lower their standard of living or obtain a higher amount of funding).
Note that this normal dynamic is not present in a market laden with distressed properties. If affordability declines in a normal market, buyers often foolishly adjust by taking out ARM loans since sellers rarely come down on price. However, since so much of our current inventory is distressed, for this inventory to clear, prices must come down to whatever price level borrowers can obtain. In other words, it is different this time.
For instance, the number of ARMs jumped dramatically when FRM rates were raised in 1988, 1994 and 1999. Prices never moved down, as the ARM supported sellers’ demands by delivering more money than the buyers would otherwise be qualified to borrow.
It is useful to think of ARMs as bridge loans, spanning gaps in the availability of purchase money when FRM rates rise. Any rise in FRM rates immediately reduces the buyer’s purchasing power, since lenders do not permit buyers to make loan payments higher than 31% of their income. Higher interest rates always mean lower principal amounts are available to borrow. [For more on the influence of rates upon the buyer’s ability to get financing, see the first tuesday Market Chart, Buyer Purchasing Power.]
This is the point I have been making for months now. Lower borrowing amounts when coupled with excessive must-sell inventor leads to lower prices.
When FRM rates rise, ARMs tend to keep prices from falling. Unfortunately, ARMs originated in excess will quickly cause prices to rise during periods of flat or declining FRM rates. ARM financing permits sellers to raise prices beyond what buyers would otherwise be able to pay. Increased availability of funds from ARMs help stabilize the market in a time of temporarily high FRM rates, but they can just as quickly lead to a home pricing bubble and a potential market crash when the ATL ratio is running contrary to the FRM rate movement as occurred in 1993 and 2002.
ARMs are the cause of volatility in California's housing market. The Option ARM was the culprit that inflated the Great Housing Bubble because it allowed huge principal values with tiny payments. The same payment can finance two or more times the loan amount with an Option ARM as compared to a FRM.
In the past, ARMs in healthy markets have generally made up approximately 20% to 40% of the home loan market, while the remainder is made up of FRM loans. If the ATL ratio exceeds 40%, which normally happens when FRM rates rise too high, it is a sign of instability in the financing market, and forebodes potential problems for homeowners and homebuyers in the near future – weaker sales volume and home prices.
Forecasting the future
With FRM rate movements in mind, it is possible to forecast the future of sales volume and sales price trends by comparing FRM rates with movement in the ATL ratio. To do so, take a close look at the correlation from year to year between FRM rates and the ATL ratio on the first chart above.
Ordinarily, the ATL ratio rises and falls in tandem with FRM rates, roughly following it in a stable and nearly parallel relationship. However, this stable relationship can and does sometimes fail when external factors cause the ATL to move contrary the FRM rate. Such external factors may include:
increases in jumbo loan demand;
rapid shifts in demographic demands to buy or sell;
too much or too little construction activity; or
changes in government regulations on homeownership or mortgage financing.
You can develop an understanding of what will be the real estate sales volume for the next 12 months, and sales price movement for a full 24 months by following any failure in ATL/FRM relationship.
In the real estate market, home sales volume tends to rise and fall in a cyclical fashion corresponding to economic recessions (represented above by gray vertical bars on the charts) and booms. Home prices change primarily due to prior changes in sales volume, although the pricing inertia generated by rising sales volume tends to continue for 8 to 12 months after home sales volume reaches its apex (this delayed change in pricing, which is particular to SFR property, is referred to as the sticky pricing phenomenon). [For a more thorough analysis of sticky pricing, see the first tuesday December 2009 article, TheFlat Line Recovery: A Side-Effect of Sticky Housing Prices.]
To make an accurate and well-informed prediction of home sales volume and pricing in California, the only figures you need are the ATL ratio and the FRM rate for the past 12 months. When these two figures fail to move in tandem during the prior 12 months, the friction between them is predictive of the extent of the change in sales volume and pricing trends in future months. Which direction the trend will take depends upon whether the two rates become more closely aligned or more distant.
It is unnecessary to look to any information other than the correlation between the ATL ratio and the FRM rate for forecasting the next 12 months of sales volume and 24 months of pricing. All other factors either reflect the ATL and FRM rates, or are directly caused by the fluctuations in those rates. For instance, while the volume of notices of default (NODs) and trustee’s deeds (TDs) may appear to have an influence on price movement at the moment of analysis, in fact NOD/TD volume is merely a manifestation of prior price movements which are dictated by FRM and ATL frictions. [For more information on NODs in the current market, see the first tuesday Market Chart,NODs and Trustee’s Deeds.]
When the ATL ratio parallels the movement of FRM rates, both sales volume and prices will remain fairly constant in the future. This is the definition of a normal market: looking forward, readers can safely predict that neither a measurable boom in pricing nor a recession will take place in the two years following such conditions.
Instead, sales volume will continue much the same as at present for at least 12 months, and prices will remain reasonably steady, adjusting upward at approximately the rate of inflation in the consumer price index (CPI) for a longer period, another 6 to 12 months. [For the most current CPI figures, see the first tuesday Rates Page.]
However, any sustained period (12 months or more) in which the two factors are at odds with one another, as demonstrated by a widening or narrowing of the space between the two lines on the ATL/FRM chart, discloses a hazardous abnormality in the home financing market. Any such abnormality establishes a divergent trend going forward in real estate sales and pricing. Examples of such divergences are elucidated below.
I have used the loosly defined term “normal” market on many occassions. The definition above is a good one, if a bit technical.
Historical trends
To get a clear idea of the power of FRM rates and the ATL ratio to predict action in the real estate market, take a look at these illustrative instances:
1. Between 1996 and 2002, the ATL ratio moved in approximate synchronicity with FRM rates, in an example of the ideal lending conditions on the market. Thanks to stable and sane loan demands by homebuyers and homeowners, real estate prices rose at a slow and sustainable rate for the duration of this period.
2. Beginning in 2002, FRM rates dropped continuously for two years. In the meantime, the ATL ratio began to rise, thanks to deregulation of lenders and Wall Street Bankers which allowed them to push for increased use of ARM loans and the concurrent rise in asset prices. The unnatural rise in ARMs led to excessive home price increases, which continued to rise for one to two years even after a return to standard ATL/FRM synchronicity (the ATL ratio peaked in early 2005, but home pricing did not reach its apex until one year later).
3. Between 2005 and 2009, FRM rates remained flat, but the ATL ratio reversed course and dropped significantly. The declining ATL ratio, coupled with a flat FRM, presaged an inevitable decline in housing prices, and a similar drop in the amount of money available for homebuyers and homeowners to borrow. In short, the dropping ATL ratio (without a drop in FRM rates) was both a symptom and a cause of the catastrophic Great Recession. Lenders dropped FRM rates further, in early 2009, but the ATL ratio responded by dropping to almost zero, a condition that exists at the end of 2010.
The authors contention is backed up by the data. Although this indicator and explanation are hard to follow, it makes sense that sudden changes in financing behavior, particularly the use of risky ARM loans, will lead to market volatility and instability.
The current market
As of October 2010, adjustable rate mortgages (ARMs) made up only 5% of mortgage market originations statewide, compared to 77% at the height of the Millennium Boom (for comparison, the peak national rate was only 36% ARMs). This 5% ATL is very low, yet it is higher than the bottom of 2% in May 2009, and continues a downward trend from an ATL ratio of 6.5% in May 2010.
Both the ATL ratio and the FRM rates are bouncing around at about the same level, with the ATL ratio literally bumping along on the bottom (as it cannot go lower than zero). Yes, the FRM is artificially low and will move around depending on the effectiveness of Fed and congressional stimulus at end of 2010 which will take effect throughout 2011, but that is not the issue.
The ATL/FRM relationship has remained relatively normal for the past year, after a logical bounce at the end of 2009. Sales volume is thus likely to remain constant or drop over the next 12 months, and the same is true of prices for the next 18 to 24 months from now. Buyers need not expect any changes in market conditions until mid- to late 2012. Government programs to encourage ownership, or to create pre-foreclosure workout sessions, will not significantly alter this situation. It will change only if buyers return to the streets intent on scarfing up real estate.
History also helps us to predict how ARMs will behave at the end of a real estate recession. Historically, recessions have led to a restabilization of the ATL ratio between 20 to 40% levels, typically following the FRM rate closely for three to five years following the recession’s end. This rule is not absolute, however; most recently, the period of 2001 to 2004 violated this condition (due to government efforts to artificially bolster the homeownership rate in the US from 64% to 70%, at the expense of homebuyers who were financially unprepared for homeownership).
As the gatekeepers to real estate, brokers and their agents need to know the shift in mortgage preferences among homebuyers from fixed rate mortgage (FRM) to ARM financing in the absence of increased FRM rates means the real estate market is destabilizing.
ARMs are not a stable loan product, and although 20% to 40% may typically be present, that only means 20% to 40% of the buyers are taking foolish risks and remaining market participants must deal with it. The presence of ARMs is not helpful, but the product doesn't totally destabilize the market while ratios are in that range and prices are rising.
With insight to apply this information, they will be able to provide better advice to both sellers and homebuyers.
The author is assuming agents care enough to convey truthful information even when they have it. My observation is that agents don't care about the truth unless it is helpful in generating a commission.
ARMs and the dysfunctional real estate market
While an ATL of up to 40% indicates a healthy home sales market, we wish to clarify that ARMs are almost never beneficial to the individual homebuyer, and are in fact largely (if not totally) responsible for the Great Recession in the real estate market.
The weaknesses of the real estate market revealed by the recent Millennium Boom (and the associated GreatRecession)are tied inextricably to the prevalence of ARM originations during that period. Without ARMs, introduced in 1982 by authority of the US Treasury, the world of real estate would not be in its present dire condition. Financing the purchase of any type of real estate with ARMs points to several key instabilities in a momentum environment of increasing sales volume:
Homebuyers are over-anxious. Over-anxious homebuyers who cannot finance the purchase of homes with stable long-term FRM loans will make the myopic decision to resort to ARMs in order to get into the home immediately, even though this choice entails greatly over-extending their future finances. They are not being told, nor do they themselves properly consider, the true cost of ARM loans when short-term rates increase — as they invariably and often dramatically do in normal business cycles of recession and recovery. This overheating of the real estate market — its weakness — creates a breeding ground for speculators and ever more ARM borrowing.
Speculators have a large presence in the market. ARMs provide a free lunch for flippers: rates are cheap with minimum cash flow requirements in the short term, providing speculators with enough time to get in, wait for prices to go up — the rush delivered by a momentum-based market — and then sell, hoping all the time to take a profit. ARMs also lower origination costs: a great incentive for speculators.
Home prices are unnaturally inflated. As more speculators enter the market to suck out their share of rising equities, they bid up property without any need to consider the fundamentals of real estate valuation, and over-inflation of housing prices ensues.
All of these conditions point to a most financially pernicious condition: the asset bubble. Thus, whenever ARM loans — sometimes referred to as zero-ability-to-pay (ZAP) loans — inconsistently rise in popularity compared to movement in the FRM rate (as indicated by an aberrant increase in the ATL ratio and a flat or dropping FRM rate),
This is a brilliant insight. ARMs equal instability. The more ARMs dominate the market, the more unstable that market is and the deeper the potential correction.
it should raise a massive red flag in the face of industry professionals. Such a rise in ARMs means that the Federal Reserve (the Fed) will soon need to slam on the brakes of the speeding real estate market before the new bubble implodes.
If only real estate professionals cared enough to send a warning. Few in the industry would argue against a bubble when so many are making so much from its inflation. Besides, as I can attest, any such warnings will be largely ignored anyway. People are going to do what they are going to do, often irrespective of the information made available to them.
The Fed accomplishes this primarily by raising short-term rates, which determine ARM origination costs and rates, and by raising reserve requirements for private banks to discourage lending in the overheating real estate market. The Fed’s measures, in turn, result in upward payment adjustments on ARMs that discourage new purchases and put current homeowners at risk of loss by sale or by foreclosure.
The advice below is some of the best I have come across. Do you think anyone in the real estate industry is actually telling thier customers stuff like this:
Knowledge brokers can use
The old joke in lending is that when a borrower opts for an ARM loan, lenders not only get an ARM off the borrower, but eventually his leg, as well. The industry has long been aware of what borrowers cannot seem to take to heart: ARMs are great only for the lenders who gladly take the fees and for speculators who don’t care about long-term ownership or market stability.
Agents need to counsel their buyers not to succumb to the toxic ARM. Brokers and agents who keep a close eye on the ATL will have the knowledge(and as fiduciaries, the duty) to provide the warning bells to their clients by supplying up-to-date information and their opinions about the potential direction of ARM rates and the prices of real estate.
As ARMs become more popular during this recovery, as they will, potential buyers will become more confident. Faced with these conditions, prospective homebuyers will find it increasingly difficult to compete with their ARM-using peers, and will opt to use ARMs once more in spite of the untenable risk they present.
This is my greatest concern with the way properties are being released. Everyone will end up in an ARM. If every new buyer is forced to stretch to the max in order to make up for the bad debts at the banks, everyone still ends up paying a huge loan ownership tax to the banks. I don't feel like putting the maximum allowable DTI toward a house less comfortable than my rental for the privilege of paying huge interest payments in hopes of future appreciation. Forget it.
These buyers must be told that there is no wisdom in mortgaging their future financial solvency for what will amount to a short-term tenancy when they can no longer make mortgage payments on their ARM. The mistake of an ARM purchase will only be compounded by the fact the new owner has most likely paid too high a price, since ARMs are only useful when homes become unavailable at FRM rates.
The high purchase price, unfortunately, makes it impossible for the buyer to resell and recover any equity when things turn sour at the end of the virtuous cycle. Able, informed buyers drive speculators away, giving sellers a fair price for their properties and brokers and agents a stable income.
Routine house spender
Finding a loan owner with a quarter million dollars worth of HELOC abuse is routine. It has little impact any more. I am still astonished by how common these borrowers are. You wouldn't think all of them borrowed over $100K. They did.
This house was purchased on 9/22/2000 for $265,000. The owner used a $251,750 first mortgage and a $13,250 down payment.
On 4/12/2004 he refinanced with a $315,000 first mortgage.
On 9/16/2004 he refinanced again for $381,500.
On 3/30/2005 he opened a stand-alone second for $50,000.
On 1/5/2006 he refinanced the stand-alone second for $50,000 and obtained a $20,000 HELOC.
On 8/16/1006 he refinanced with a $119,100 stand-alone second mortgage.
Total property debt is $500,600.
Total mortgage equity withdrawal is $248,850.
Total squatting time two years and counting.
Foreclosure Record
Recording Date: 09/15/2010
Document Type: Notice of Sale
Foreclosure Record
Recording Date: 06/25/2009
Document Type: Notice of Sale
Foreclosure Record
Recording Date: 03/20/2009
Document Type: Notice of Default
This owner made it through all of 2009 and 2010 without making a payment. It appears he is still living there.
-$346 ………. Tax Savings (% of Interest and Property Tax)
-$458 ………. Equity Hidden in Payment
$28 ………. Lost Income to Down Payment (net of taxes)
$50 ………. Maintenance and Replacement Reserves
============================================
$1,776 ………. Monthly Cost of Ownership
Cash Acquisition Demands
——————————————————————————
$4,000 ………. Furnishing and Move In @1%
$4,000 ………. Closing Costs @1%
$3,860 ………… Interest Points @1% of Loan
$14,000 ………. Down Payment
============================================
$25,860 ………. Total Cash Costs
$27,200 ………… Emergency Cash Reserves
============================================
$53,060 ………. Total Savings Needed
Property Details for 14952 GAINFORD Cir Irvine, CA 92604
——————————————————————————
Beds: : 3
Baths: : 2
Sq. Ft.: : 1112
Lot Size: : 5,096 Sq. Ft.
Property Type:: Residential, Single Family
Style:: One Level, Other
View:: Faces Northwest
Year Built: : 1971
Community: : El Camino Real
County: : Orange
MLS#: : S632589
——————————————————————————
Come see this exquisite property in the El Camino Real area of Irvine! Property is a detached home close to 1200 sq feet and has a lot size of 5000 sq feet with a nice spacious backyard. Kitchen, Dining area, and Bathrooms were recently remodeled with new countertops and cabinetary in some areas. Some new additions to the house include a new fence in the back yard, new roof, crown molding in the master bedroom, vaulted ceilings in the living room, and laminate flooring in the family room and new tile in the kitchen. Best of all, no HOA or Mello Roos fees!

.png)


.jpg)


 In Las Vegas where prices are very affordable, a small decrease in affordability will not make much difference; however, in inflated California markets where every penny of affordability is needed to support pricing, rising interest rates will be a serious problem.