Category Archives: Real Estate Analysis

Payment affordability in Irvine hits an 11-year high

In August, prices dipped below rental parity for the first time in over a decade. In September, prices fell further below rental parity than any time in the 00s.

Irvine Home Address … 4051 ESCUDERO Dr Irvine, CA 92620

Resale Home Price …… $649,000

The sun is on my side.

Take me for a ride.

I smile up to the sky.

I know I'll be all right.

Natasha Bedingfield — Pocketful Of Sunshine

There have been few rays of sunshine for the local housing market over the last five years. Prices are down about 30% from the peak, and hopes of a bottom were crushed when a double dip ended the false rally of 2009 and 2010. The bad news can't go on forever. Prices won't fall to zero. Eventually, prices get low enough that people get a reason to buy other than dreams of capturing appreciation. Once prices fall below rental parity, people can buy to save money versus renting.

Payment affordability

When we talk about affordability, everything is relative. Incomes are a good measure, and using a 31% DTI applied to local incomes provides a useful measure of affordability. Another measure is local rents. Since rents and incomes are closely tethered (people don't typically borrow their rent), local rents are a good proxy for local incomes.

Since most house purchases are financed, the affordability of monthly payments is important. Since rents are paid on a monthly basis as well, the comparison of the monthly cost of ownership to rent is a very useful measure of affordability. Basically, if people can afford their rent, they could afford a payment equivalent to rent. Thus rental parity is a good measure of payment affordability.

Financing terms are important

When examining the cost of ownership, the financing terms become very important. The folly of the housing bubble was to abandon amortizing mortgages in favor of interest-only and negative amortization loan products. People used these Ponzi loan programs to lower their monthly payments and ostensibly lower their cost of ownership. While they did lower their payments for a time, the terms of these loans were not stable. At some point, they needed to recast to fully amortizing loans which would be paid off. The “payment shock” of this recast was a timebomb waiting to blow up a family's balance sheet. Most of these loans have already blown up, and the borrowers are waiting in shadow inventory for lenders to clear them out.

People sought ways to defuse the recast bomb by a process known as “serial refinancing.” Right before the bomb was due to go off, people assumed they would be able to refinance into a new loan and reset the clock. Most borrowers believed these financing terms would always be available, so they had little risk of being around for the explosion. As we all know now, these borrowers were all wrong.

When considering the cost of ownership for calculations of payment affordability, the cost of an amortizing mortgage must be considered. Interest-only and negative amortization loans artificially lower the cost of ownership, but these methods are not sustainable.

ARMs are dangerous too

Amortizing adjustable-rate mortgages are also a dangerous product. People select them because they carry a lower interest rate, and the payments are marginally more affordable. These loans work great when interest rates are falling, but when interest rates rise, loan payments go up, and the savings from early payments is more than made up for by increasing costs later on.

The real danger with an ARM loan is embedded into obscure terms of the promissory note. The loan is written with a contract interest rate that changes periodically. There is a contractual limit as to how high the interest rate can go. Unfortunately, affordability is only measured against the contract interest rate. If interest rates rise, the payments could very easily become unaffordable, and the borrowers could face the same problems with default and foreclosure many are dealing with today.

The worst part about ARMs is that the additional risk is not necessary. Fixed-rate mortgages also allow for refinancing when interest rates drop. Borrowers simply refinance into a new loan. There is no need to use ARMs to capture the benefit of falling interest rates.

Of course, despite the problems with ARMs, many people will still use them and assume the government will bail them out if the going gets tough. It's hard to argue with a borrower who believes that. So far, the government has shown every sign of bailing out even the most foolish of borrower behavior.

Interest rates and principal balance

Interest rate and purchase price matters little when the loan is held to term. If a borrower makes 360 (30 x 12) equal payments, the composition of principal and interest is irrelevant. However, very few borrowers hold a loan to term as many sell or refinance.

Whether interest rates are high or low benefits certain parties and hurts others.

Low interest rates hurt cash buyers or those who utilize large down payments. A cash buyer would prefer to pay a very low price. Unfortunately, low interest rates inflate prices, so cash buyers are adversely impacted by low rates. Conversely, borrowers with little down benefit the most from low interest rates. Price to them is mostly about monthly payment since they are financing most of the transaction. Further, low interest rates followed by high inflation (conditions likely in our future) works strongly in favor of those with who put little down and borrowed heavily as the dollars they are repaying are worth less than the dollars they borrowed.

High interest rates strongly favor cash buyers. High interest rates make for low principal balances and low prices. High interest rates hurt borrowers who put little down because most of their payment goes toward interest. High interest rates followed by declining interest rates favors those who can refinance into a lower rate to reduce the interest burden.

It's very difficult to predict what will happen with interest rates and inflation. We are at the bottom of the interest rate cycle now, and higher rates and higher inflation are a possible, perhaps even likely, scenario. In any case, locking in a cost of ownership lower than the cost of a comparable rental is usually a good idea. The danger being a rise in interest rates that causes further weakening of prices which makes it impossible to sell without taking a loss. Landlording becomes the logical alternative, but that isn't for everyone.

Irvine prices are finally below rental parity

The low interest rates and falling prices have finally pushed Irvine below rental parity. Not every house in every neighborhood, but a broad spectrum of housing options are now trading at or below rental parity. It still takes effort to find these properties, but they are common enough to warrant searching in Irvine if you are looking to buy now.

The chart above was part of the OC Housing Market Presentation from last Wednesday. When I first prepared this chart last month, I was quite surprised to see Irvine trading below rental parity. The reading for September was the lowest in the last 11 years. Much of this improvement is due to low interest rates engineered by the federal reserve, but with their commitment to keeping rates low for the foreseeable future, waiting for the next interest rate peak to buy may take a while.

I remember early astute observers on the blog who quipped, “Irvine has never traded at rental parity.” Well, actually it has. In fact, it traded well below rental parity during the late 90s, and it will likely dip below rental parity again for at least the next few years.

I calculate the rental parity formula by taking 90% of the comparable rent and computing a loan balance. From there, I tack on a 20% down payment. I use 90% of the comparable rent to allow for taxes, insurance, HOA, and adjust for tax savings. Since there is no private mortgage insurance (PMI), most of the rent goes toward the payment.

FHA buyers face different conditions, so rental parity for them is calculated differently. I only use 75% of the comparable rent, and I add on a 3.5% down payment. Based on that standard, Irvine is still out of reach.

FHA buyers only make up a small percentage of Irvine resales, mostly concentrated in condos which is why we have seen so many of those sporting low prices.

The table below shows the degree of price inflation relative to rental parity by zip code.

The most inflated zip code remains 92603 — Turtle Rock, Turtle Ridge and Quail Hill. This zip code is deflating fast as relative price inflation has declined 40% over the last two months. Falling prices and falling interest rates will do that.

Northwood (92620) is also inflated, but prices are coming down.

Oak Creek, Orangetree and Portola Springs are the anomaly. Prices have been rising there for the last three months and are currently above rental parity. Rents are also rising in that zip code. We speculate this is due to restricted supply, but for whatever reason, it is the only zip code showing strength in Irvine.

Most of the remainder of Irvine is showing falling prices and firming rents. When combined with falling interest rates, the result is improving affordability as prices fall below rental parity. We anticipate this trend will continue and reach its zenith for this year's cycle in January. Prices over the next 6 months will generally be affordable by rental parity standards. With the uptick in foreclosure filings, there is no guarantee of a spring rally to pull the market out of the doldrums.

The buying window is open

I have consistently maintained on this blog that buying when prices are below rental parity is a good idea. I still believe that to be true. Rising prices are not a requirement for being bullish. Long-term owners who want to lock in a cost of ownership lower than comparable rents have options bubble buyers do not. The below rental parity buyer will be saving money each month, and if they have to move while prices are below their purchase price, they will be able to rent the property and avoid making a sale.

Prices are generally sticky on the way down, but they become much stickier when underwater owners don't need to sell to patch a hole in their family's balance sheet. Once prices reach rental parity, unless there is a huge influx of supply (which is still possible), prices generally don't go much lower. Of course, rising interest rates could easily lower the value of rental parity, and eventually this will happen, but the federal reserve seems committed to preventing higher interest rates in the medium term.

Owner-occupant who bought a Ponzi's house at auction

One of the topics Shevy will cover tonight at the REO and Short Sale Workshop is buying at the auction. It is one method owner occupants have for obtaining real estate below current market costs. The current owner of today's featured property bought it at auction about three years ago on 10/30/2008. His $547,000 purchase price represented a significant discount at the time. Even with the ongoing weakness in pricing, he will still be able to sell without losing money.

The previous owner was a full-blown Ponzi:

  • The house was purchased on 7/2/2002 for $481,000. The owner used a $384,800 first mortgage, a $96,200 second mortgage, and a $0 down payment.
  • On 8/12/2003 he refinanced with a $487,000 ARM with a 4% rate, probably a 1/1 ARM.
  • On 9/17/2003 he obtained a $97,500 HELOC. After only one year of ownership, he was able to pull out over $100,000.
  • On 4/14/2004, about seven months later, he refinanced again with a $560,00 ARM with a 3.87% interest rate and obtained a $70,000 HELOC.
  • On 11/16/2004, about sevens months later, he obtained a $150,000 HELOC.
  • On 8/31/2005 he refinanced with a $612,500 Option ARM with a 1% teaser rate and obtained a $175,000 HELOC. I wonder if this guy was a mortgage broker?
  • On 4/24/2006 he traded in his HELOC for a $250,00 stand-alone second mortgage.
  • In three and one half years, after putting no money down, this Ponzi cashed out $381,500. That's an average of $109,000 per year!
  • He defaulted shortly thereafter and squatted for about 15 months.

Foreclosure Record

Recording Date: 02/22/2008

Document Type: Notice of Sale

Foreclosure Record

Recording Date: 09/17/2007

Document Type: Notice of Default

Since most of the worst HELOC abusers have already been flushed from the system, I haven't profiled many really bad cases lately. This guy was a real blast from the past. He's a good reminder of the problems of the housing bubble.

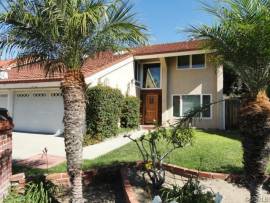
When I first saw this property, I felt it was one of the nicer properties we have seen trading below rental parity — unless you believe you can find a rental this nice for less than $2,500 per month. It's deal like this one on nicer properties that are becoming more prevalent, and the reinforce what I am seeing in the data. Much of Irvine is now at or below rental parity.

——————————————————————————————————————————————-

This property is available for sale via the MLS.

Please contact Shevy Akason, #01836707

949.769.1599

sales@idealhomebrokers.com

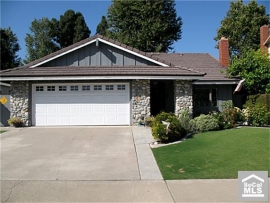
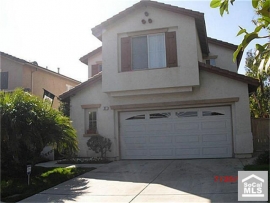
Irvine House Address … 4051 ESCUDERO Dr Irvine, CA 92620

Resale House Price …… $649,000

Beds: 4

Baths: 3

Sq. Ft.: 2344

$277/SF

Property Type: Residential, Single Family

Style: Two Level, Ground Level

Year Built: 1970

Community: Northwood

County: Orange

MLS#: T11134799

Source: CRMLS

Status: Active

On Redfin: 1 day

——————————————————————————

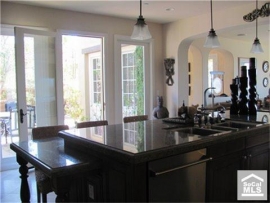
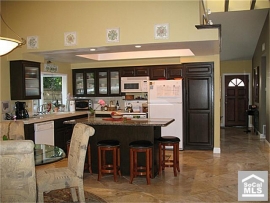
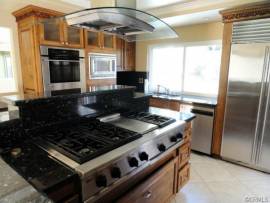
Welcome to the wonderful Northwood community in Irvine. This home features a remodeled kitchen with dual ovens, 6 burner cooktop and a Subzero fridge. The master suite features a balcony for you to relax on. The property also has jacuzzi and pool to enjoy those warm summer days. There are many other upgrades done to this home for you to come view.

——————————————————————————————————————————————-

Proprietary IHB commentary and analysis

Resale Home Price …… $649,000

House Purchase Price … $547,000

House Purchase Date …. 10/30/2008

Net Gain (Loss) ………. $63,060

Percent Change ………. 11.5%

Annual Appreciation … 5.7%

Cost of Home Ownership

————————————————-

$649,000 ………. Asking Price

$129,800 ………. 20% Down Conventional

4.20% …………… Mortgage Interest Rate

$519,200 ………. 30-Year Mortgage

$125,290 ………. Income Requirement

$2,539 ………. Monthly Mortgage Payment

$562 ………. Property Tax (@1.04%)

$0 ………. Special Taxes and Levies (Mello Roos)

$135 ………. Homeowners Insurance (@ 0.25%)

$0 ………. Private Mortgage Insurance

$0 ………. Homeowners Association Fees

============================================

$3,237 ………. Monthly Cash Outlays

-$416 ………. Tax Savings (% of Interest and Property Tax)

-$722 ………. Equity Hidden in Payment (Amortization)

$195 ………. Lost Income to Down Payment (net of taxes)

$182 ………. Maintenance and Replacement Reserves

============================================

$2,475 ………. Monthly Cost of Ownership

Cash Acquisition Demands

——————————————————————————

$6,490 ………. Furnishing and Move In @1%

$6,490 ………. Closing Costs @1%

$5,192 ………… Interest Points @1% of Loan

$129,800 ………. Down Payment

============================================

$147,972 ………. Total Cash Costs

$37,900 ………… Emergency Cash Reserves

============================================

$185,872 ………. Total Savings Needed

——————————————————————————————————————————————————-

Shevy Akason and Larry Roberts will host a short sale and REO workshop at 6:30 PM Wednesday, October 19, 2011, at the offices of Intercap Lending (9401 Jeronimo, Suite 200, Irvine, CA 92618). Register by clicking here or email us a sales@idealhomebrokers.com.

The real state of Irvine and Orange County real estate

Irvine Home Address … 30 ROCKROSE Way Irvine, CA 92612

Resale Home Price …… $475,000

And so I cry sometimes when I'm lying in bed

Just to get it all out, what's in my head

And I, I'm feeling a little peculiar

And so I wake in the morning and I step

Outside and I take deep breath

And I get real high

And I scream to the top of my lungs

What's goin' on?

4 Non Blondes — What's Up

Throughout my posts on the IHB, I make references to what I believe is happening in our local housing market. The IHB serves as a valuable market resource to people considering buying Irvine and Orange County real estate. The message for the first nearly 5 years has been simple: don't buy a home yet. Over the last couple of years as the plethora of market props have been removed, the message has evolved to the more nuanced advice: buy below rental parity if you have a long holding time. That advice will remain our mantra over the next few years until conditions in the market change.

Why are you afraid to buy?

If you have been reading the IHB regularly, you have a rational fear to buy local real estate. Prices are falling. Prices will continue to fall for a while.

People who buy today might be trapped underwater and unable to sell their homes without taking a significant loss. Further today's buyers may miss the opportunity to buy later at a lower price. These are not foolish fears, they are legitimate reasons to delay the purchase of a home anywhere in Orange County.

Why will prices keep falling?

There are five primary factors which will impact the balance of supply and demand in our local market:

  1. High mortgage delinquency rates translates to a large shadow inventory (supply).
  2. Large REO inventory of lender owned properties withheld from the market (supply).
  3. High unemployment has diminished the buyer pool (demand).
  4. Weak California economy has diminished employment and wage growth (demand).
  5. Higher future interest rates will lower aggregate loan balances (demand).

Each of the above factors will contribute to either increased supply or reduced demand. The existence of these factors is not conjecture. They are very real. The way each of them impacts the market is uncertain, but each of them will serve to pressure prices lower over the next several years.

What will cause prices to eventually go up?

Kool aid and the memories of the rewards of the housing bubble are part of our culture. There will always be plenty of desire for California real estate. Even as prices have fallen steadily for the last 5 years, hope springs eternal, every buyer believes they are buying at the bottom, and most believe unlimited wealth and HELOC spending money is just around the corner.

There are several factors beyond kool aid intoxication which will serve to reverse the fall of prices and cause real estate prices to rise again:

  1. Current interest rates are very low.
  2. Payment affordability is relatively high.
  3. The economy and the employment situation will improve.
  4. Supply pressures will abate.

Even neighborhoods which have not historically traded below rental parity are trading below their historic level of payment affordability. On a payment basis, prices in many neighborhoods are similar to what they were in the late 90s and early 00s before the bubble mania took over.

The California economy has been sputtering as it weans itself off the Ponzi borrowing money of the 00s. The transition has been difficult and painful which is why the economy is still so weak. A significant portion of the false demand of the 00s will never return.

When the economy and employment finally picks up, wages will increase, and new households will form. The higher wages will increase the amounts borrowed, and the new households will increase the numbers of loans demanded. Both factors are essential to a housing market recovery.

At some point, the overhead supply of shadow inventory and visible REO inventory will be liquidated. This will likely take several years as lenders sell into any price rallies to recover their capital. There are many ways this could play out.

Lenders hope consistently rising prices will allow them to sell their inventory for the prices they want, and this liquidation will be easily absorbed by the market. I think that scenario is wishful thinking by lenders. The inventories are simply too large for it to work out that way. If lenders can hold their REO indefinitely, they can meter out this inventory over the next decade or more, but I doubt all the banks will be that patient.

As some lenders hasten their liquidations (like the GSEs are now), the resulting sales will push prices lower. As lenders capitulate one-by-one, the collapsing cartel causes brief seasonal rallies followed by deep seasonal drops. This yearly cycle will see consistent year-over-year declines similar to what has occurred in 2011. I believe this is the most likely scenario.

Declines in the liquidation phase of a bubble are not as steep as the first phase when the credit crunch forces lenders to abruptly decrease loan balances, but as was demonstrated in Japan, the liquidation phase results in slow but steady declines in prices until the inventory is purged from the system. Let's hope our liquidation phase is not as protracted as Japan's.

What will the bottom look like?

The double dip will be the final decline, and I don't believe it will be that severe (expect perhaps at the high end). That being said, the bottom will be difficult to time. First, it's impossible to predict what foolish policies may emanate from Washington. With our current state of gridlock, I have some hope that nothing substantive will emerge from the bowels of government. Any government policy would likely have the effect of delaying the market bottom.

Housing markets nearly always exhibit a seasonal pattern of spring rallies and fall pullbacks with the low for the year in early January. This seasonal pattern will continue, but the spring rallies will be weaker, and the fall pullbacks will be more pronounced. The inventory is often reduced in fall in winter, but the sellers who remain are usually more motivated as many of them missed the prime selling season.

Due to the overhanging inventory, this seasonal pattern with a slightly lower bias will persist for 3 to 5 years. The two or three years following will show the same pattern but with a slightly upward bias. The bottom will form slowly for the reasons listed previously: inventory overhand, rising interest rates, persistent unemployment, and prudent lending standards.

Buyers should not feel a sense of urgency from the fear of being priced out. The window of opportunity will be open for years to buy during this liquidation-bottoming phase.

Get the latest news on the Irvine and OC housing markets

On the second Monday of each month, I will deliver a presentation on the current state of the housing market. Monday September 12, 2011, will be the first of these presentations.

Presentation nights will be busy for me, but we want them to be entertaining and informative for you. The proceedings will start at 5:00 with a registration happy hour. If you want to come out to meet Shevy and I informally and talk real estate or simply meet with other IHB readers, you are invited to show up at 5:00 and have a drink with us.

At 6:00 I will gather everyone together in the Brewmaster room at the back of JT Schmids for the presentation on the OC housing markets. It will be an expanded version of the post above plus the most recent monthly data from August. Each month, the presentation will have the latest monthly data, so even if you have seen the presentation once, it will always be fresh.

Later that evening, I will be giving a presentation on investing in cashflow properties in Las Vegas. More on that in an upcoming post.

Everyone is invited to come up for the happy hour, the OC housing market presentation, and the cashflow property presentation. You may come and go as you please selecting only those events you wish to see.

On August 24th, the first-time homebuyer presentation was attended by 29 interested readers. One of the attendees had this to say in the comments:

Astute Observation by Pascal

2011-08-24 09:29 PM

I just attended this, though I’m already familiar with the home buying process.

It was great, and I highly encourage anyone who was reluctant to go this time for whatever reason, to attend the next one.

And there will be free cookies.

Actually, there will be free drinks and appetizers this time around. I hope to see you on September 12.

Cleaning up after the Ponzis

The next few years in local real estate will be cleaning up the mess created by lax lending standards and the Ponzis who took advantage of it. Today's featured REO is a typical example of the properties which will make up a third or more of our resale market for the foreseeable future.

  • The previous owners paid $270,000 on 4/12/2000. They used a $242,730 first mortgage and a $27,270 first mortgage. About a year and a half later, they began periodic mortgage withdrawals to supplement their income.
  • On 1/23/2002 they refinanced with a $257,000 first mortgage.
  • On 7/23/2003 they refinanced with a $259,000 first mortgage.
  • On 1/12/2004 they obtained a $180,000 HELOC.
  • On 5/27/2005 they got a $242,000 HELOC.
  • On 9/24/2008 the wife obtains a $444,500 first mortgage and a $40,000 HELOC in her name.
  • She quit paying in late 2009 and was foreclosed on in November of 2010.

Foreclosure Record

Recording Date: 07/07/2010

Document Type: Notice of Sale

Foreclosure Record

Recording Date: 04/02/2010

Document Type: Notice of Default

For each one of these we see, there are dozens hiding on lender balance sheets and in shadow inventory. These properties must eventually be liquidated, and as they are, any meaningful appreciation will be elusive.

——————————————————————————————————————————————-

This property is available for sale via the MLS.

Please contact Shevy Akason, #01836707

949.769.1599

sales@idealhomebrokers.com

Irvine House Address … 30 ROCKROSE Way Irvine, CA 92612

Resale House Price …… $475,000

Beds: 4

Baths: 2

Sq. Ft.: 2130

$223/SF

Property Type: Residential, Single Family

Style: Two Level, Traditional

Year Built: 1966

Community: University Park

County: Orange

MLS#: P788492

Source: SoCalMLS

Status: Active

On Redfin: 48 days

——————————————————————————

GREAT IRVINE HOME. FLOOR PLAN IS OPEN AND SPACIOUS AND HAS SO MUCH TO OFFER. MASTER RETREAT. MIRRORED CLOSE DOORS. FABULOUS KITCHEN WITH TILED COUNTERTOPS AND BACKSPLASH. RECESSED LIGHTS. 2 CAR ATTACHED GARAGE. PRIVATE BACKYARD. LOTS OF STORAGE SPACE. THIS IS A MUST SEE.

——————————————————————————————————————————————-

Proprietary IHB commentary and analysis

Resale Home Price …… $475,000

House Purchase Price … $270,000

House Purchase Date …. 4/12/2000

Net Gain (Loss) ………. $176,500

Percent Change ………. 65.4%

Annual Appreciation … 4.9%

Cost of Home Ownership

————————————————-

$475,000 ………. Asking Price

$16,625 ………. 3.5% Down FHA Financing

4.19% …………… Mortgage Interest Rate

$458,375 ………. 30-Year Mortgage

$133,611 ………. Income Requirement

$2,239 ………. Monthly Mortgage Payment

$412 ………. Property Tax (@1.04%)

$0 ………. Special Taxes and Levies (Mello Roos)

$99 ………. Homeowners Insurance (@ 0.25%)

$527 ………. Private Mortgage Insurance

$175 ………. Homeowners Association Fees

============================================

$3,452 ………. Monthly Cash Outlays

-$352 ………. Tax Savings (% of Interest and Property Tax)

-$638 ………. Equity Hidden in Payment (Amortization)

$25 ………. Lost Income to Down Payment (net of taxes)

$79 ………. Maintenance and Replacement Reserves

============================================

$2,565 ………. Monthly Cost of Ownership

Cash Acquisition Demands

——————————————————————————

$4,750 ………. Furnishing and Move In @1%

$4,750 ………. Closing Costs @1%

$4,584 ………… Interest Points @1% of Loan

$16,625 ………. Down Payment

============================================

$30,709 ………. Total Cash Costs

$39,300 ………… Emergency Cash Reserves

============================================

$70,009 ………. Total Savings Needed

——————————————————————————————————————————————————-

Delinquencies TWO times, foreclosures EIGHT times historic norms

Delinquency rates are declining, but they are still double their historic norms. Foreclosure rates are temporarily declining, but they are still eight times their historic norms. Mortgage distress is very high.

Irvine Home Address … 27 GEORGIA Irvine, CA 92606

Resale Home Price …… $659,000

The party's over

It's time to call it a day

They've burst your pretty balloon

And taken the moon away

It's time to wind up the masquerade

Just make your mind up the piper must be paid

Nat King Cole — The Party's Over

The housing bust has entered a new phase; inventory liquidation. Lenders have been accummulating REO and delinquent loans for several years, but with fewer and fewer new delinquencies being added to the inventory, lenders are turning their focus on clearing out the debris. It's going to take a while.

LPS Mortgage Monitor June 2011

During the housing bubble, borrowers were given loans that were much too large and with terms which doomed them. When people began succumbing to the toxic debts they were given, delinquency rates began to rise. As delinquency rates went up, lenders realized they made a huge mistake, so they stopped underwriting stupid loans. Without Ponzi loans to bail out the overextended, delinquency rates rose to levels never before seen. Couple the mortgage distress that was built into the system with recession unemployment, and the delinquency rate peaked at 10.97% in January of 2010.

In the 18 months that followed, delinquency rates have declined as new delinquencies have slowed and foreclosures have begun clearing out the shadow inventory. At the current rate of decline, it will be at least another 18 months before the delinquency rate falls to 5.5% and re-enters its historic range. That assumes the double dip and strategic default doesn't cause fresh delinquencies and recent slowdowns in foreclosures doesn't slow the decline in the delinquency rate.

New delinquencies are still being added to the system at a lower but still alarming rate. Lingering unemployment and strategic default from the house price double dip are largely responsible for the high rate. Lax underwriting is no longer the driving force behind delinquencies.

Back in late 2008, the amend-extend-pretend dance caused the correlation between delinquency and foreclosure to break down. The result is a large backlog of foreclosures known as shadow inventory. Lenders have been metering out their REO as the highest rate they can which does not crash the market. The slower they sell their REO, the longer the problems will linger. The faster they sell their REO, the more prices will drop and more borrowers will opt to strategically default. It's a difficult balancing act.

Shadow inventory is full of delinquent mortgage squatters. Millions of people are occupying homes they are not paying for. The high end has more shadow inventory than the low end as lenders have been foreclosing on smaller loans while leaving larger loan balance borrowers alone.

Lenders are foreclosing on fresh delinquencies while allowing older delinquencies to remain in shadow inventory. However, they are making more headway on reducing shadow inventory as the percentage of foreclosures on old delinquencies is steadily rising.

The big problem for lenders is clearing out the backlog. As the chart above notes, the foreclosure starts relative to their delinquent inventory is still low. That number needs to rise from 10% to 100% before shadow inventory is clear.

The chart above is very revealing. In the summer of 2010, lenders reduced their foreclosures dramatically. The chart below reveals this slowdown is a result of problems in judicial foreclosure states.

California is a non-judicial state, so Robo-signer and other procedural delays have not impacted the foreclosure rate. In judicial foreclosure states like Florida or New York, many more borrowers are being given extra squatting time.

The above charts are a different way of looking at the same procedural delay problem in judicial foreclosure states.

It will take time to clear the inventory overhang

The important fact to take away from this post is that it will take a long time before the market is not burdened by homes that need to be sold. Let's take a look at some of the inventory overhang in Irvine.

Foreclosure Date — Amount — Address

Dec 16, 2008 — $856,029 — 78 Dovecrest Irvine, CA 92620

Jul 23, 2010 — $1,719,455 — 51 Summer House Irvine, CA 92603

Jul 21, 2009 — $711,000 — 85 Legacy Way Irvine, CA 92602

Nov 02, 2009 — $445,000 — 3131 Michelson Dr Unit 907 Irvine, CA 92612

Aug 11, 2008 — $742,500 — 5155 Scholarship, Irvine, CA 92612

Dec 16, 2008 — $458,739 — 19 Meadowsweet Way, Irvine, CA 92612

The above list is a small sample. Most of these were mortgages over $1,000,000, and many of them have been owned by lenders since 2008.

When are these properties coming to the market? If lenders are waiting for peak prices, they may own some of those properties for decades. Locally lenders have not capitiulated yet. At some point, these properties will be sold. The current supply is being temporarily constricted, and people are not being allowed to have the beneficial use of these properties. Most are sitting empty as if they didn't exist. However, they do exist, and at some point they will need to be sold.

I'm not the only one who has noticed this problem locally.

Distressed sales could last 5 years

By JEFF COLLINS / THE ORANGE COUNTY REGISTER — August 5, 2011

Jon Cook is president and CEO of the Prudential California Realty chain owned by HomeServices of America Inc., a Berkshire Hathaway affiliate. …

Us: What’s the outlook for the Orange County housing market down the road?

Jon: I’m optimistic that we have seen the toughest part of the distressed sales market. NOD’s/ Notices of Default are decreasing; however, I’m not saying we’re out of the woods yet. You still have trailing inventory that the banks are holding that hasn’t come to market yet.

We probably still have a couple of years to work through the distressed sales and they make up almost 50% of all sales in the county. It could be as long as an additional 5+ years to work through the distressed property inventory. …

Ponzis since 2001

Some people figured out Ponzi borrowing from their house earlier than others. The owners of today's featured property began with a small down payment in 1999, and parlayed that into several hundred thousand dollars of mortgage equity withdrawal and a few years of squatting. To them, housing is not a cost, it is a reliable source of income supplementation.

  • This property was purchased on 3/26/1999 for $290,000. The owners used a $275,450 down payment and a $14,550 down payment.
  • On 10/1/2001 they obtained a stand-alone second mortgage for $60,000 and obtained their first cash infusion.
  • On 5/30/2003 they refinanced with a $354,900 first mortgage.
  • On 9/18/2003 they got a $100,000 HELOC.
  • On 4/2/2004 they opened a $250,000 HELOC.
  • On 5/23/2006 they refinanced with a $650,000 first mortgage.
  • Total mortgage equity withdrawal is $374,550.
  • Total squatting time is over 30 months.

Foreclosure Record

Recording Date: 05/24/2011

Document Type: Notice of Default

Foreclosure Record

Recording Date: 07/23/2010

Document Type: Notice of Rescission

Foreclosure Record

Recording Date: 05/19/2010

Document Type: Notice of Sale

Foreclosure Record

Recording Date: 02/16/2010

Document Type: Notice of Rescission

Foreclosure Record

Recording Date: 02/16/2010

Document Type: Notice of Default

Foreclosure Record

Recording Date: 04/22/2009

Document Type: Notice of Default

These are the kinds of homeowners the system could do without. These people have gamed the system for maximum advantage. They will endure a serious fall from entitlement after their sale or foreclosure because for the first time in more than a decade, they will actually have to pay for housing rather than having their housing pay for them.

——————————————————————————————————————————————-

This property is available for sale via the MLS.

Please contact Shevy Akason, #01836707

949.769.1599

sales@idealhomebrokers.com

Irvine House Address … 27 GEORGIA Irvine, CA 92606

Resale House Price …… $659,000

Beds: 5

Baths: 3

Sq. Ft.: 2200

$300/SF

Property Type: Residential, Single Family

Style: Two Level, Modern

Year Built: 1999

Community: Walnut

County: Orange

MLS#: P791518

Source: SoCalMLS

Status: Active

On Redfin: 2 days

——————————————————————————

This gorgeous gated community home offers 5 bedrooms 3 full baths, downstairs bedroom is currently used as an office with accessible full bath, large family room with fireplace, downstairs ceramic tile flooring, tile kitchen counter tops with breakfast nook, upstairs laminated flooring, upstairs laundry room, vertical blinds throughout the home, oversized two car garage with extra storage space, security system, professionally landscaped front and back, low maintenance large back patio, largest floor plan. Association amenities include large swimming pool, basketball court, sand volleyball court, kid s playground, barbeque area, open green park. Minutes to great Irvine Schools and Shopping Centers and easy freeway access. Buyers must see this property !!!

——————————————————————————————————————————————-

Proprietary IHB commentary and analysis

Resale Home Price …… $659,000

House Purchase Price … $290,000

House Purchase Date …. 3/26/1999

Net Gain (Loss) ………. $329,460

Percent Change ………. 113.6%

Annual Appreciation … 6.6%

Cost of Home Ownership

————————————————-

$659,000 ………. Asking Price

$131,800 ………. 20% Down Conventional

4.31% …………… Mortgage Interest Rate

$527,200 ………. 30-Year Mortgage

$141,645 ………. Income Requirement

$2,612 ………. Monthly Mortgage Payment

$571 ………. Property Tax (@1.04%)

$217 ………. Special Taxes and Levies (Mello Roos)

$137 ………. Homeowners Insurance (@ 0.25%)

$0 ………. Private Mortgage Insurance

$122 ………. Homeowners Association Fees

============================================

$3,659 ………. Monthly Cash Outlays

-$616 ………. Tax Savings (% of Interest and Property Tax)

-$719 ………. Equity Hidden in Payment (Amortization)

$206 ………. Lost Income to Down Payment (net of taxes)

$102 ………. Maintenance and Replacement Reserves

============================================

$2,633 ………. Monthly Cost of Ownership

Cash Acquisition Demands

——————————————————————————

$6,590 ………. Furnishing and Move In @1%

$6,590 ………. Closing Costs @1%

$5,272 ………… Interest Points @1% of Loan

$131,800 ………. Down Payment

============================================

$150,252 ………. Total Cash Costs

$40,300 ………… Emergency Cash Reserves

============================================

$190,552 ………. Total Savings Needed

——————————————————————————————————————————————————-

An accurate view of the Irvine housing market by Global Decision and IHB

Over the last couple of months, IHB has teamed up with Global Decision to prepare an accurate and in-depth analysis of the Irvine housing market. Today's post is the first in a series that will illuminate the workings of the local market in a whole new way.

Irvine Home Address … 31 CLOUDS Pt Irvine, CA 92603

Resale Home Price …… $2,950,000

You can take a picture of something you see

In the future where will I be?

You can climb a ladder up to the sun

Or write a song nobody has sung

Or do something that's never been done

Coldplay — Talk

Back in March, I wrote about the future of IHB news and real estate analysis. In that post, i made the following observation:

Data is important, isn't it?

It's a shame the NAr has gone down the path it has. Few reliable sources of real estate analysis and information exist, and few signs the NAr is going to become one of them. That leaves a void. Uncharted waters buyers must navigate without a reliable guide. It's a void we seek to fill here at the IHB.

We are in the process of assembling our own private database of housing and related economic statistics. Over the next several weeks as I have time to digest the new information, I plan on a number of new analysis posts to truly illuminate the activity in our local housing market.

I have no agenda to spin the data. Let's see what is really going on. I want to be accurate. People can make their own decisions and draw their own conclusions from accurate data. If approached without the built-in bias of a realtor, data analysis can be revealing rather than deceiving.

I will still have a dog in this hunt. I do run a business that makes money from real estate transactions. I am subject to the same biases as any other human being. I sell real estate, but I am not a realtor. The truth needs no salesman. I will present data as accurately as I can. If reality motivates you to buy or rent, the IHB can help you. I have no desire to manipulate data in order to make a quick buck. This is a part-time hobby for me, not my livelihood.

After that post aired, I was contacted by Jaysen Gillespie of Global Decision, an analytics and consulting firm that has worked in the real estate industry. He shares my interest in determining what is really going on in the real estate market. As a professional data analyst, he is trained in special techniques I cannot perform.

In the weeks that followed, we have met several times and with the assistance of another data analyst, Brian Nadel, we have performed an in-depth analysis of the Irvine housing market. Today is the first in a series of posts on our findings. Today's post lays the groundwork for the detail to follow later. The basic model Jaysen developed is complex, and we felt it deserved a post on its own to ensure everyone understands what we did and why it is better than other measures of value currently available.

The following is the writing of Jaysen Gillespie. I have not set it off in block quote to make it easier to read.

A presentation by Jaysen Gillespie of Global Decision

info@globaldecision.com

Global Decision is an analytics consulting firm. While our methods are not industry-specific, our engagements are skewed towards specific industries in Southern California, such as real estate (along with online gaming and restaurant chains). We specialize in applying both foundational and advanced analytics to better understand business and economic issues.

Today’s post is an example of such an application, known as hedonic housing valuation. The goal of a hedonic housing valuation model is to use all information about a sale, including both the sale price and the characteristics of the home (number of beds, number of baths, square footage, etc.) to understand how the home’s value is derived from its constituent parts. Wikipedia offers a good overview of hedonic regression.

Unlike looking at comps, which relies on a small number of highly similar properties, a Hedonic model incorporates as much data as possible from a vast number of properties. The core mathematical construct behind a hedonic valuation model is a multiple regression, and for such regressions to produce statistically meaningful results, it’s helpful to have a large number of sales as inputs into the model. In non-technical terms, the regression procedure figures out how to best fit the values of all the pieces of a home to build a formula for the value of a home based on the characteristics of the home. A simple linear hedonic valuation model might, for example, conclude that each bathroom adds $15,000 of value to a home – or that each square foot of living space adds $250 of value to a home. Such values are calculated based on actual historical sales and represent the regression algorithm’s best estimate given the data.

For more details on the mathematics behind hedonic regression, along with plusses and minus of using hedonic models for housing valuation, please see the real estate section of the Global Decision website.

All regression methods – and in fact all mathematical models – suffer from one of the same drawbacks: factors not in the model may impact the dependent variable under study. In our example, housing values in Irvine, we might find that properties with an exceptional view sell for a premium. Our housing data does not reflect whether a property has an exceptional view – and our model would likely undervalue that specific home.

As it turns out, the Irvine dataset is the best of most possible worlds. The city itself is extraordinarily homogeneous: schools are uniformly good and crime is uniformly low. There are no “bad” areas, by typical American metropolitan standards. This homogeneousness allows us to construct a model that has a very strong ability to understand how Irvine homes derive value from their constituent parts – and is not overly swayed by factors not available for modeling. To further exclude data points that are not representative, we’ve excluded condos, “attached single family” properties. We’ve also excluded properties with unusual characteristics, such as a 15,000 sq. ft. lot, or 7 bedrooms. Unusual properties only represent about 2% of the Irvine sample and don’t detract from the model’s ability to trend home values over time.

With the data winnowed down to true resale single family detached houses with no unusual characteristics, we can then run the regression to determine how the value of homes has moved over time. Our Irvine dataset includes sales from 2000 through June 2011. The regression model calculates each quarter’s price change, relative to the initial quarter (2000Q1). Because there are only so many sales each quarter in Irvine, and because regression-based models need a certain number of data points to produce valid results, we are not able to generate a monthly price series of the same quality. Regression models require more data than some other approaches – but they also provide a deeper understanding of the data in exchange.

The above chart shows the actual median price for resale SFRs from the underlying dataset, along with the hedonic model’s estimate of how prices for those same properties have moved over time. The key insight is immediately clear: during the years of rapid appreciation, both the median and the hedonic trend were similar. However, between 2005 and 2008, the two series started to diverge and are presently at significantly different values.

A second observation is that the hedonic series is much smoother. The median price can gyrate wildly from quarter to quarter, as evidenced by the 10% drop from 2010Q3 to 2010Q4. The hedonic model, by contrast, dropped only 3.0% in the same period. A core benefit of a hedonic approach, versus a median-value approach, is that a hedonic model is not skewed by changes in the mix of product that sell each quarter. As sales move from larger to smaller homes and back again – or from one neighborhood to another – the median value is pushed and pulled by the changes in the mix of the underlying properties. Such changes do not indicate the actual home value trend and serve only to obscure the true change in home values in the mid-term.

So what’s driving the gap between the median value and the value implied by the hedonic analysis? As we mentioned earlier, changes in the mix of properties affect the median but not the true trend of real estate values. Foremost among such changes is the size of the median home sold. Clearly, with all else equal, if the homes that are selling increase (decrease) in size then the median value will rise (fall). For this reason, some analysts prefer the “price per square foot” summary metric. That metric also produces distortions, though in different ways.

You can see from chart 2 that the median size of homes sold in this particular dataset has risen over time. The rise over time is a general trend, but it also exhibits a visible discontinuity upwards around 2006Q4. Starting in that quarter, about 50% of the quarters have median home sizes that exceed 2,300 – a condition which did not occur between 2000Q1 and 2006Q3. The median home value series is pushed higher by the fact that larger homes are selling. The degree of the distortion is evident in the chart: the gap between the undistorted hedonic index and the median-based index is clearly visible from 2007 to present.

The other major factor that drives home values is location (regression models don’t need it repeated three times). Because Irvine experienced something of a building boom from 2000-2007, the percent of total sales represented by newer homes has also increased over time. This change in mix is another reason why using the median home value over time to represent the change in the true value of any given Irvine home yields distorted results.

An admittedly-leading question to ponder in the astute observations: if builders create housing that’s physically identical to the average existing housing stock, but those properties sell for a premium for being new, will using the median home value as a price index generally overstate the actual change in value? What if builders create housing with more (or less) favorable characteristics over time?

Using the Hedonic Model to Predict Future Prices

An interesting offshoot of the hedonic model is that one can use its relatively-stable quarter-over-quarter values to better understand whether the current price trend is deviating from historical norms. Home values have a seasonal component to them. Most major indexes, such as the Case-Shiller, offer “seasonally adjusted (SA)” and “non-seasonally adjusted (NSA)” series for this reason. The Irvine hedonic model is inherently not seasonally adjusted. In fact, one can use the results generated by the model to help understand the seasonality of price changes. The following graph shows the average change, quarter-over-quarter, in the Irvine hedonic price trend series.

The hedonic model provides solid evidence that prices are generally stronger in Q2, with weakness in Q4. This finding simply confirms conventional wisdom. However, if we couple this fact with the fact that 2011’s hedonic analysis shows a flat trend in Q2 2011, then de-seasonalized trend of Irvine home values in Q2 2011 was negative. Q3, on average, is about 1.8% worse than Q2 – and a typical Q4 is over 4% worse than a typical Q2. Only time (and actual data) will tell if Q3/Q4 2011 will follow these trends, but the implication is that Irvine home values could easily fall 5% in the coming quarters due to seasonal factors alone. If the underlying trend is actually negative, the drop will be exacerbated by seasonality. If the underlying trend is actually positive, the gains will appear muted in Q3/Q4 for the same reason. The Q3 and Q4 editions of the hedonic model will explain which scenario is the case. Stay tuned!

The Irvine hedonic housing model does not directly attempt to predict future home values. It does, however, more clearly show the true underlying value trends based on actual sales. Those true underlying trends can then be combined with other sets of data, such as default/foreclosure rates, loan-to-value ratios, job growth, and so forth to create model-based approaches to predict future home values. In that sense, if others can use the hedonic approach to refine their forecasting models, it does have predictive value.

IrvineRenter's commentary

When we first poured over the results, I was struck by how the model more accurately showed the decline in value since the peak without the distortion of product mix. I have noted on other occasions that the few transactions occurring in Irvine have been of the most desirable single-family detached homes, and in order to complete the transactions, buyers have put more money down.

The hedonic model shows both the increasing size of homes purchased as well those homes being the newer ones. As we will show in future posts, many of these sales have been in Turtle Ridge and Quail Hill were the premiums are astronomical. The flight to quality from cash-heavy buyers is apparent.

Armed with this new model, we dove into the details on various neighborhoods and even the components of the housing stock itself: beds, baths, square footage, age, garages. We also looked at condos and rentals. The results will be detailed in future posts.

Is Turtle Ridge really that nice?

Turtle Ridge is certainly a desirable community. Both rents and house prices carry a premium over the rest of Irvine. Of course, the rent-to-price ratio is still wildly distorted making prices completely unjustifiable on a cashflow basis, but since the market is always right, buyers have been willing to pay a premium on the premium to own here.

But isn't there a limit?

The owner's of today's featured property bought back in March of 2004. Based on county-wide metrics, they should be underwater.

Has Turtle Ridge appreciated nearly 50% since early 2004? Really?

If so, the supply of greater fools must be endless. Not that it's a bargain, but for $2,950,000, you can get an Laguna Beach home just off the beach.

Irvine House Address … 31 CLOUDS Pt Irvine, CA 92603

Resale House Price …… $2,950,000

House Purchase Price … $1,964,000

House Purchase Date …. 3/12/2004

Net Gain (Loss) ………. $809,000

Percent Change ………. 41.2%

Annual Appreciation … 5.5%

Cost of House Ownership

————————————————-

$2,950,000 ………. Asking Price

$590,000 ………. 20% Down Conventional

4.49% …………… Mortgage Interest Rate

$2,360,000 ………. 30-Year Mortgage

$511,875 ………. Income Requirement

$11,944 ………. Monthly Mortgage Payment

$2557 ………. Property Tax (@1.04%)

$0 ………. Special Taxes and Levies (Mello Roos)

$615 ………. Homeowners Insurance (@ 0.25%)

$0 ………. Private Mortgage Insurance

$395 ………. Homeowners Association Fees

============================================

$15,510 ………. Monthly Cash Outlays

-$1764 ………. Tax Savings (% of Interest and Property Tax)

-$3113 ………. Equity Hidden in Payment (Amortization)

$980 ………. Lost Income to Down Payment (net of taxes)

$389 ………. Maintenance and Replacement Reserves

============================================

$12,002 ………. Monthly Cost of Ownership

Cash Acquisition Demands

——————————————————————————

$29,500 ………. Furnishing and Move In @1%

$29,500 ………. Closing Costs @1%

$23,600 ………… Interest Points @1% of Loan

$590,000 ………. Down Payment

============================================

$672,600 ………. Total Cash Costs

$183,900 ………… Emergency Cash Reserves

============================================

$856,500 ………. Total Savings Needed

Property Details for 31 CLOUDS Pt Irvine, CA 92603

——————————————————————————

Beds: 5

Baths: 5

Sq. Ft.: 4400

$670/SF

Property Type: Residential, Single Family

Style: Two Level, Santa Barbara, Spanish, Villa

View: City Lights, City, Mountain, Ocean

Year Built: 2004

Community: Turtle Ridge

County: Orange

MLS#: P784881

Source: SoCalMLS

Status: Active

——————————————————————————

Panoramic City Lights, Ocean, and Mountain View. This Amberhill residence is located on a private Cul-de-sac with full bedroom/bath on first level, five bedroom total + 2 home office and playroom + master retreat. This home features a dramatic living room open to backyard with extensive use of natural stome hardscape, front and back. polished marble and upgrated carpet flooring, crown molding and custom window treatments, Large kitchen with granite counters/island, full backsplash, built-in subzero refrigerator, professional series six burner cooktop, double ovens, and bread-warmer. Spacious family room great for entertaining which includes integrated 5 speaker surround sound with custom media built-in. Very large dual master+ 8-head massage shower, hot tub, and large walk in wardrobe. private backyard with City lights / Ocean/ Mountain views with custom BBQ/pool/jacuzzi

stome hardscape? upgrated?

How large is the Irvine land premium?

Irvine is a premium Orange County Community, but how large is the premium for the land? Today we will take a look.

Irvine Home Address … 14132 MOORE Ct Irvine, CA 92606

Resale Home Price …… $559,900

We never lost control

You're face to face

With The Man Who Sold The World

Nirvana — The Man Who Sold The World

Has any man sold more homes than Donald Bren? I don't know, but I doubt it. He and his Irvine Company are planning to sell a few more. Any takers?

Irvine Co.: 1,350 homes sold, more coming

April 8th, 2011, 3:00 pm — Jon Lansner

The Irvine Co. — fresh from a remarkable 2010 where their Irvine villages were a top-selling new-home project in America — will officially launch four more North Irvine projects Saturday.

The company has sold 1,350 homes in North Irvine communities since January 2010 —

Perhaps the Irvine Company is not used to having fact checkers follow them around, but the sales numbers they throw out are not accurate. And I strongly suspect the sales numbers are intentionally exaggerated to create false urgency to sell more homes.

From January 2010 to February 2011, they closed on 642 home sales. The numbers they are reporting are double what really sold. Perhaps if I were dependent upon the Irvine Company for advertising revenue, perhaps I would let transparent lies pass by, but since I don't fear them pulling ad revenue from me, I will provide accurate numbers.

and officially launches 12 model homes in four neighborhoods (DETAILS HERE!) in the Stonegate neighborhood. All told, the four new projects — click on sketches above for larger images and details — consist of 486 homes from one-bedroom, 1,129-square-foot flats to 2,974-square-foot, 5-bedroom detached homes. Prices? From the mid-$300,000s to high-$700,000-plus.

Dan Young, Irvine Co.’s homebuilding chief, continues to credit detailed market research for the company’s success — a distinct rarity in a homebuilding world that elsewhere runs near historic lows.

He's right in pointing out that the Irvine Company is leading the way out of the home building recession. They restricted sales so much in 2008 and 2009, they didn't overbuild and saturate the market with product they couldn't move. The activity in 2010 stands in stark contrast to the rest of the industry.

“It’s got to be about the house,” he says of the projects continued focus, which he admits sounds simplistic — but it is not.

The Irvine Co.’s ongoing research found that the key buying group are young professionals who are picky — “they grew up in great homes” — and want something different than their parents’ house — “their expectations are higher.”

The long-vanished real estate boom, in Young’s eyes, made house selling so easy that bad homebuilding habits were born so that homes were “engineered not designed,” and that “took a lot of the romance out of the product.”

Having worked in architectural firms as a land planner for a number of years, I can attest to what Mr. Young is saying. When architects are busy, they are more concerned with putting out drawings and getting paid than they are about the nuances of the product. Plus, overly cost conscious builders end up stripping down the design to it's simplest and easiest to build form.

The new research helped the Irvine Co. plan homes that trade housing traditions — like a formal dining area– for large, kitchen-linked “great room” with a built-in “home management” area plus a covered, outdoor “California room” dining area. Buyer feedback has also led to further innovations, such as building bigger and more functional kitchen islands that are sculpted “more like a piece of furniture.”

It didn’t hurt the homebuilding endeavor that the Irvine Co. was blessed with a well-financed owner, billionaire Don Bren, who was able to put his own cash at risk on new homes when other builders still scramble for construction financing. ”We were in a position, financially, to take the large risk,” adds Young, who notes that the homebuilding effort has met or exceeded every financial plan including, “a good profit.”

The should be able to make a good profit considering they likely have less than $100/SF into the house itself, and the land basis is near zero.

The Irvine land premium

When the Irvine Company developed the Ranch, through good land planning and a commitment to quality, they have managed to create an enormous premium for Irvine compared to other inland Orange County communities. Only the beach communities carry a higher premium on the land.

I created the chart above by taking the median home prices and dividing it by the median lot size. Similar to a $/SF for houses, this reflects the value of the underlying land.

Irvine has always had a price premium, but when you factor in the fact that lots are also 20% to 30% smaller than surrounding communities, the $/SF of lot value is extraordinarily high. Creating this premium from nothing is the real genius and accomplishment of Donald Bren and the Irvine Company.

If you compared Irvine to the remainder of Orange County, how large is the Irvine land premium? How much more do buyers in Irvine pay on a per-square-foot basis than the Orange County median? Quite a bit.

From 1988 to 1994, the premium hovered around 50%, but in 1995 it began to climb. From 1995 to 2009, the Irvine premium hovered between 50% and 80%. When land values in the subprime areas crashed and took down the Orange County median, the Irvine land premium rose to unprecedented levels.

IMO, the elevated Irvine land premium reflects the fact that prices have not fallen in Irvine compared to surrounding communities. Perhaps Irvine has taken another step up from the crowd and the Irvine premium will remain above 80% permanently.

I doubt it.

It seems far more likely to me that resale asking prices in Irvine will continue to fall. Perhaps the Irvine Company will be able to hold pricing on its new product, but they may find sales goals elusive as the substitution effect drags down the high end and brings the Irvine land premium back into its historic stable range.

That check won't be very big

Sometimes when I comb through the property records, I feel like I am spinning the wheel of fortune. Some of these owners didn't spend their equity, so they leave the closing table with big equity checks. Most have some degree of Ponzi borrowing. My observation is that well over half have increased their mortgage. Some borrow a lot and some borrow a little, but most borrow something.

The owner of today's featured property borrowed enough to put a major dent in their closing check. At least they won't be a short sale.

Todays featured property was purchased on 7/22/1994 for $235,000. The owners used a $188,000 first mortgage and a $47,000 down payment. At first they behaved well, and when they first refinanced in 1997, they paid down the first mortgage to $186,000. However, on 12/10/2001, they opened a $50,000 HELOC and went Ponzi.

On 10/3/2002 they refinanced with a $232,500 first mortgage and got another $25,000 HELOC. They had gone Ponzi, and there was no looking back.

On 8/24/2004 they obtained another $75,000 HELOC, and they increased it to $100,000 on 4/18/2005.

On 7/26/2005 they refinanced with a $350,000 first mortgage, and finally on 4/24/2008 they obtained their final $100,000 HELOC. There is no way to be sure if they spent it. Either way, they already nearly doubled their initial mortgage and Ponzi borrowed at least $165,000 — money that won't be in their closing check.

Irvine House Address … 14132 MOORE Ct Irvine, CA 92606

Resale House Price …… $559,900

House Purchase Price … $235,000

House Purchase Date …. 7/22/1994

Net Gain (Loss) ………. $291,306

Percent Change ………. 124.0%

Annual Appreciation … 5.2%

Cost of House Ownership

————————————————-

$559,900 ………. Asking Price

$111,980 ………. 20% Down Conventional

4.84% …………… Mortgage Interest Rate

$447,920 ………. 30-Year Mortgage

$113,830 ………. Income Requirement

$2,361 ………. Monthly Mortgage Payment

$485 ………. Property Tax (@1.04%)

$0 ………. Special Taxes and Levies (Mello Roos)

$117 ………. Homeowners Insurance (@ 0.25%)

$52 ………. Homeowners Association Fees

============================================

$3,015 ………. Monthly Cash Outlays

-$401 ………. Tax Savings (% of Interest and Property Tax)

-$554 ………. Equity Hidden in Payment (Amortization)

$208 ………. Lost Income to Down Payment (net of taxes)

$70 ………. Maintenance and Replacement Reserves

============================================

$2,337 ………. Monthly Cost of Ownership

Cash Acquisition Demands

——————————————————————————

$5,599 ………. Furnishing and Move In @1%

$5,599 ………. Closing Costs @1%

$4,479 ………… Interest Points @1% of Loan

$111,980 ………. Down Payment

============================================

$127,657 ………. Total Cash Costs

$35,800 ………… Emergency Cash Reserves

============================================

$163,457 ………. Total Savings Needed

Property Details for 14132 MOORE Ct Irvine, CA 92606

——————————————————————————

Beds: 4

Baths: 2

Sq. Ft.: 1910

$293/SF

Property Type: Residential, Single Family

Style: One Level, Contemporary

Year Built: 1975

Community: 0

County: Orange

MLS#: S653562

Source: SoCalMLS

Status: Active

On Redfin: 4 days

——————————————————————————

Immaculately maintained open plan single story detached home in the Colony. STANDARD SALE! Master and 2 bedrooms on ground floor level, permitted addition includes loft currently used as 4th bedroom. Large family room and bay window views of a private, tree-lined, greenbelt. Peaceful cul de sac street. Adjacent to all shopping and the 5 freeway on/off-ramps. Many upgrades including: quiet, dual pane custom Anderson windows, 6 panel doors, Travertine 16' tiles and carpeting, landscaped bricked yard with built in grill. Roof is 2 yrs new Eaglelite Concrete tile, All appliances-insured and inspected plus replaced AC, Heat, Vents about 6 years ago. Annual Termite inspections. The Colony has the lowest HOA fees in Irvine-$52.00/month-NO Mello Roos, includes free clubhouse use w/ bbqs, pool/lifeguard/swim team, basketball, tennis, volleyball, serene tree-lined park with large tot-lot playground. Many community events. 4 Blocks-Irvine HS; 6 Blocks-College Pk. Elementary; 10 Blocks-Venado Middle.