Monthly Archives: August 2011

64% of Americans lack $1,000 for emergencies much less 3.5% for a down payment

If 64% of Americans don't have enough liquid savings for a down payment, they don't have a 3.5% down payment for an FHA loan either. Where are tomorrow's buyers going to come from?

Irvine Home Address … 180 GREENMOOR Irvine, CA 92614

Resale Home Price …… $232,800

I would give everything just for a taste

Everything's here, all out of place

Losing my memory, saving my face

KT Tunstall — Saving My Face

Last month I posed the question, “How are tomorrow’s buyers going to come up with a 20% down payment?” With the overhang of consumer debt and the lingering aftermath of the Great Recession, personal savings rate, at about 5%, are still well below the average of the last 50 years.

Realistically, your average would-be home owner is not going to save up 20% on their own.

The path to ownership and the property ladder

With a return to sane lending standards, most borrowers will obtain their down payment in the traditional manner — they will buy an FHA home and wait until it has gone up in value 20% or more.

Without a 20% down payment, borrowers need to pay private mortgage insurance or an FHA premium. This added cost of borrowing comes directly out of money available to make a payment. In a super-low interest rate environment like today's every dollar that comes out of the payment reduces the mortgage amount significantly. In fact, many of the properties I profile on the IHB are below rental parity for conventional buyers but above rental parity for FHA buyers.

Most people won't save 20% for a down payment from their wage income. It's too hard. Most people don't have the stomach for austerity high savings rates requires. It's far easier to buy a house and wait for it to increase in value.

Once the market bottoms, borrowers will have to wait five to seven years before appreciation adds enough value and amortization pays down the loan enough for them to sell their house and obtain a check after commissions large enough to serve as a 20% down payment on the next property.

By then, most borrowers will also be making more money as they will have progressed in their careers. The accumulated down payment from prior ownership equity and the increased borrowing power of a higher salary allow most buyers the luxury of bidding higher and moving up to a nicer property. That's the way the housing ladder really works.

Many times we have seen large down payments lost in the bubble deflation, but this money was most often a parlay bet with the appreciation of a prior sale. Very few people actually save the full amount a down payment from their wage income to buy property using 20% down.

The broken rungs

Borrowers climbing the property ladder face new challenges to accumulating the equity needed for a move-up. The biggest challenge is their own self discipline. Far too many borrowers avail themselves of the savings in their houses by taking out HELOCs to liberate their equity. Spent equity is not available to put down on a move-up property. Increased earnings is not enough. Without the 20% down payment, move ups are a smaller step than they should be.

The second major challenge to the move-up market is the ongoing decline in low end properties. If equity is disappearing rather than accumulating, move-up buyers are trapped in their starter homes. For the move-up market to function, low-end prices need to appreciate. It's only when these buyers have 20% down payments that the next level up the property ladder has significant buyer support.

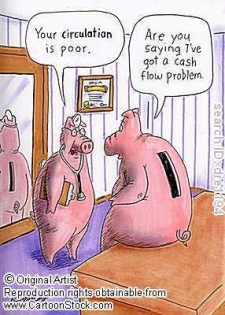
Contrary to popular media fiction, there is not a hoard of buyers sitting on the sidelines waiting to deploy their 20% down payments. The reality is the buyer pool is largely broke. Their savings was wiped out in the housing collapse or the stock market crash (or both). Even those who missed those two fiascoes likely have their money sitting in bonds or CDs with yields south of 3%. The money is relatively safe, but it isn't earning much.

Without the requisite down payments, sales volumes will continue to be very weak, and as the major source of funding for mortgages with less than 20% down, the FHA will have a very large market share for the foreseeable future, despite the onerous cost of its insurance.

Besides the chart of personal savings rates above, there is survey evidence that backs up my contention borrowers simply don't have the savings necessary to buy houses.

Most Americans can't afford $1,000 emergency expense

Jessica Dickler, On Wednesday August 10, 2011, 1:40 pm EDT

When the unexpected strikes, most Americans aren't prepared to pay for it.

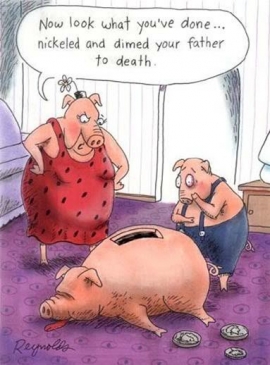
A majority, or 64%, of Americans don't have enough cash on hand to handle a $1,000 emergency expense, according to a survey by the National Foundation for Credit Counseling, or NFCC, released on Wednesday.

Only 36% said they would tap their rainy day funds for an emergency. The rest of the 2,700 people polled said that they would have to go to other extremes to cover an unexpected expense, such as borrowing money or taking out a cash advance on a credit card.

Most people take the view that credit cards are emergency savings. It's one of the reasons credit card write-offs are so large now. Many people during the recession relied on their credit cards to maintain their entitlements. When the emergency turned into chronic unemployment or loss of income, the credit card debt grew out of control, and many have opted not to pay them.

“It's alarming,” said Gail Cunningham, a spokeswoman for the Washington, DC-based non-profit. “For consumers who live paycheck to paycheck — having spent tomorrow's money — an unplanned expense can truly put them in financial distress,” she noted.

That's the case for Allyson Curtis, 35. “I think about it every day,” she said.

Curtis was unemployed for only three months last year, but in that time she accumulated $5,000 in credit card debt that she's now struggling to pay down.

Do you think that $5,000 in debt was to pay for food, water, and shelter? How many indulgent entitlements were included in the bill?

In the case of an emergency, Curtis said she would likely postpone other payments and pile on additional debt.

In other words, she would go Ponzi.

She is already putting off $450 in dental work and a car inspection due to a crack in her windshield, which will cost $300 to replace, she said.

Many respondents, 17%, said they would borrow money from friends or family. Another 17% said they would neglect other financial obligations — like a credit card bill or mortgage payment — in order to free up some funds.

It must be horrifying for bankers to realize so many view mortgage payments as optional, like Peggy Tanous of OC Housewives fame who got a boob job instead of paying her mortgage.

Budgeting for an emergency fund

Alternatively, 12% of the respondents said they would have to sell or pawn some assets to come up with $1,000 and 9% said they would need to take out a loan. Another 9% said they would get a cash advance from a credit card, according to the NFCC.

Cunningham finds that particularly troubling. Neglecting other debt obligations — or worse piling on more debt — “really exacerbates the problem,” she said.

An earlier study by the same organization found that 30% of Americans have zero dollars in non-retirement savings. A separate study by the National Bureau of Economic Research found that 50% of Americans would struggle to come up with $2,000 in a pinch.

Annndd it's gone….

Cost of ownership lower than the 00s

Very low interest rates certainly do make properties less expensive to own. Today's featured property is priced to reflect 3.4% annual appreciation. That is about the rate of wage growth in Irvine. The property was purchased in 1999 which was before prices got ridiculous in the housing bubble.

The monthly cost of ownership for these owners back in 1999 would have been similar to the cost of ownership today with most of the modest increase in price being compensated by the enormous reduction in borrowing costs. In fact, most of the appreciation in this property could be attributed to declining borrowing costs rather than increasing area wages. If Bernanke holds to his promise to keep rates low for at least two more years, condo prices will likely bottom soon, if they haven't already.

——————————————————————————————————————————————-

This property is available for sale via the MLS.

Please contact Shevy Akason, #01836707

949.769.1599

sales@idealhomebrokers.com

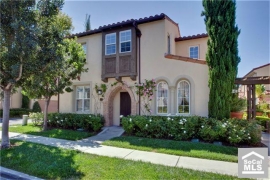
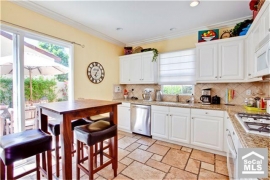
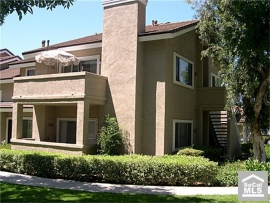
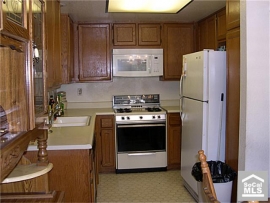
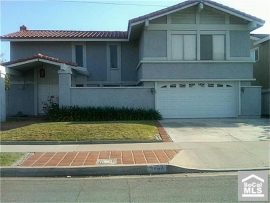
Irvine House Address … 180 GREENMOOR Irvine, CA 92614

Resale House Price …… $232,800

Beds: 2

Baths: 1

Sq. Ft.: 889

$262/SF

Property Type: Residential, Single Family

Style: Two Level, Other

Year Built: 1985

Community: Woodbridge

County: Orange

MLS#: S669455

Source: SoCalMLS

Status: Active

On Redfin: 3 days

——————————————————————————

WONDERFUL OPPORTUNITY. RESORT STYLE LIVING IN WOODBRIDGE. CLOSE TO UCI. EASY ACCESS TO 405 AND 5 FREEWAYS. BLUE RIBBON SCHOOLS. CLOSE TO SOUTH LAKE. BRAND NEW CARPET.

——————————————————————————————————————————————-

Proprietary IHB commentary and analysis

Resale Home Price …… $232,800

House Purchase Price … $156,500

House Purchase Date …. 11/24/1999

Net Gain (Loss) ………. $62,332

Percent Change ………. 39.8%

Annual Appreciation … 3.4%

Cost of Home Ownership

————————————————-

$232,800 ………. Asking Price

$8,148 ………. 3.5% Down FHA Financing

4.19% …………… Mortgage Interest Rate

$224,652 ………. 30-Year Mortgage

$71,492 ………. Income Requirement

$1,097 ………. Monthly Mortgage Payment

$202 ………. Property Tax (@1.04%)

$0 ………. Special Taxes and Levies (Mello Roos)

$48 ………. Homeowners Insurance (@ 0.25%)

$258 ………. Private Mortgage Insurance

$241 ………. Homeowners Association Fees

============================================

$1,847 ………. Monthly Cash Outlays

-$173 ………. Tax Savings (% of Interest and Property Tax)

-$313 ………. Equity Hidden in Payment (Amortization)

$12 ………. Lost Income to Down Payment (net of taxes)

$49 ………. Maintenance and Replacement Reserves

============================================

$1,423 ………. Monthly Cost of Ownership

Cash Acquisition Demands

——————————————————————————

$2,328 ………. Furnishing and Move In @1%

$2,328 ………. Closing Costs @1%

$2,247 ………… Interest Points @1% of Loan

$8,148 ………. Down Payment

============================================

$15,051 ………. Total Cash Costs

$21,800 ………… Emergency Cash Reserves

============================================

$36,851 ………. Total Savings Needed

——————————————————————————————————————————————————-

Tonight we will deliver our first-time homebuyer's presentation. Admission is free and open to everyone.

I hope to see you there.

Lenders delay market bottom, extend squatting benefits by reducing foreclosure activity

In an effort to stop the double dip from getting worse, lenders are slowing foreclosure activity nationwide. Their efforts will delay the market bottom and extend squatting benefits.

Irvine Home Address … 219 TALL OAK Irvine, CA 92603

Resale Home Price …… $550,525

Now if you're feelin' kinda low 'bout the dues you've been paying

Future's coming much too slow

And you wanna run but somehow you just keep on stayin'

Can't decide on which way to go

I understand about indecision

But I don't care if I get behind

People livin' in competition

All I want is to have my peace of mind.

Boston — Peace of Mind

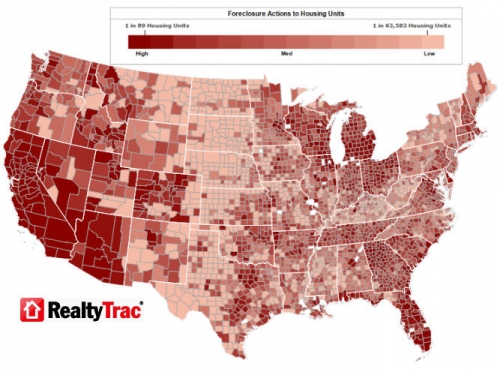
Do you ever find yourself getting impatient with the way lenders have dragged out the housing crash? I do. It isn't merely that I want to see lower house prices as those are prevalent across most of the country. I want to see the economic wounds heal. That isn't going to happen until lenders foreclose on all the delinquent mortgage squatters and resell the resulting REO.

While we wait for lenders to do what needs to be done, the homebuilding industry remains in the doldrums, lending remains at anemic levels, and overall economic activity is feeble. None of that will change until our zombie banks are put out of their misery and recapitalized. In the meantime, lenders are slowing foreclosures and dragging out the economic morass. Academics in the United States used to criticize Japan for the way they dealt with this same problem in the 1990s. We are going down the same path.

U.S. Foreclosure Activity Falls to 44-Month Lows in July; Artificially Slowed by Banks

Posted by Michael Gerrity 08/11/11 8:00 AM EST

According to RealtyTrac's U.S. Foreclosure Market Report for July 2011, foreclosure filings — default notices, scheduled auctions and bank repossessions — were reported on 212,764 U.S. properties in July, a 4 percent decrease from June and a 35 percent decrease from July 2010. The report also shows one in every 611 U.S. housing units with a foreclosure filing during the month of July.

Foreclosures are essential to the economic recovery. There is little debate that the housing market will not clear and house prices will not enjoy sustained appreciation until the foreclosure backlog is cleared out. As long as shadow inventory or REO inventory is present, lenders will sell into any rally thus stopping it cold.

The fact that lenders are slowing the rate of foreclosure simply means the bottom is being pushed back further in time. Also, since the delinquency rate is still very high, a slowdown in foreclosure rates means more and more people are squatting for longer periods of time.

July foreclosure activity dropped 35 percent from a year ago, marking the 10th straight month of year-over-year decreases in foreclosure activity and the lowest monthly total since November 2007,” said James J. Saccacio, chief executive officer of RealtyTrac.

“This string of decreases was initially triggered by the robo-signing controversy back in October 2010, which forced lenders to substantially slow the pace of foreclosing, but the downward trend in foreclosure activity has now taken on a life of its own.

This should be no surprise to IHB readers. I have long contended that robo-signer was merely a ruse, the excuse-of-the-day, to delay foreclosures and avoid writing down more bad loans. Lenders will continue this behavior as long as they believe there is no buyer demand to sell into. Eventually, lenders will realize the buyer demand they are waiting for will never materialize. When they do, they will capitulate and sell for whatever they can get.

It appears that the foreclosure processing delays, combined with the smorgasbord of national and state-level foreclosure prevention efforts — including loan modifications, lender-borrower mediations and mortgage payment assistance for the unemployed —may be allowing more distressed homeowners to stave off foreclosure.

No, it is allowing more delinquent mortgage squatters to stay in homes that should be resold to those who are willing and able to pay for them.

Unfortunately, the falloff in foreclosures is not based on a robust recovery in the housing market but on short-term interventions and delays that will extend the current housing market woes into 2012 and beyond,” Saccacio continued.

Yes, the slowdown in foreclosure activity will delay the bottom and allow more squatting.

A stabilizing economy and improving job market are the long-term keys to a housing market recovery.”

Persistent unemployment is an ongoing drain to the economy and to the housing market.

Foreclosure Activity by Type

Default notices (NOD, LIS) were filed for the first time on a total of 59,516 U.S. properties in July, a 7 percent decrease from the previous month and a 39 percent decrease from July 2010. July's default notice total was 58 percent below the monthly peak of 142,064 default notices in April 2009.

Foreclosure auctions (NTS, NFS) were scheduled for 85,419 U.S. properties in July, a decrease of 5 percent from June and a decrease of 37 percent from July 2010. July's foreclosure auction total hit a 36-month low and was 46 percent below the monthly peak of 158,105 scheduled auctions in March 2010.

Lenders repossessed a total of 67,829 properties (REO) in July, a 1 percent decrease from the previous month and a 27 percent decrease from July 2010. The July REO total was 34 percent below the monthly peak of 102,134 bank repossessions in September 2010.

As i noted in a previous post, the dramatic declines are almost exclusively in judicial foreclosure states.

Nevada, California, Arizona post top state foreclosure rates

Nevada posted the nation's highest state foreclosure rate for the 55th straight month in July, with one in every 115 housing units receiving a foreclosure filing during the month. A total of 9,930 Nevada properties had a foreclosure filing in July, a 1 percent decrease from the previous month and a 28 percent decrease from July 2010.

Nevada also boasts one of the largest action postponement and cancelation percentages of any state. Locally, about 87% of auctions are delayed or canceled, but in Nevada the number is closer to 95%. It's a classic example of kicking the can down the road.

Despite a 16 percent year-over-year decrease in foreclosure activity, California registered the nation's second highest state foreclosure rate in July, with one in every 239 housing units with a foreclosure filing during the month.

With one in every 273 housing units with a foreclosure filing, Arizona posted the nation's third highest state foreclosure rate, after holding the No. 2 spot for seven straight months ending in June. A 39 percent month-over-month drop in REO activity pulled Arizona's total foreclosure activity in July down 25 percent from the previous month and down 38 percent from July 2010.

Other states with foreclosure rates ranking among the top 10 were Georgia, Utah, Florida, Michigan, Idaho, Illinois and Wisconsin.

10 states account for more than 70 percent of U.S. total

10 states accounted for 73 percent of U.S. foreclosure activity in July, led by California, where 56,193 properties had a foreclosure filing during the month — up 4 percent from the previous month but still down 16 percent from July 2010. Initial default notices in California were down 6 percent from the previous month, but REOs increased on a month-over-month basis for the second straight month and scheduled auctions were up 11 percent from the previous month. …

Foreclosure activity spikes in some hard-hit cities

Las Vegas continued to post the nation's highest foreclosure rate among metropolitan areas with a population of 200,000 or more, with one in every 99 housing units with a foreclosure filing in July.

But spiking foreclosure activity in some of the other cities with foreclosure rates in the top 20 narrowed the gap between those cities and Las Vegas. Seven of the cities in the top 10 and 14 of the cities in the top 20 posted monthly increases in foreclosure activity.

Foreclosure activity in the Stockton, California metro area increased 57 percent from June to July, giving it the nation's second highest metro foreclosure rate — one in every 124 housing units with a foreclosure filing during the month. Stockton foreclosure activity in July was still down 7 percent from July 2010.

With one in every 140 housing units with a foreclosure filing, the Vallejo-Fairfield, Calif., metro area posted the nation's fourth highest metro foreclosure rate in July thanks in part to a 33 percent month-over-month increase in foreclosure activity.

Foreclosure activity increased 83 percent on a month-over-month basis in the Naples-Marco Island, Fla., metro area, which posted the nation's 15th highest metro foreclosure rage, and foreclosure activity was up 60 percent on a month-over-month basis in the Ocala, Fla., metro area, which posted the nation's 17th highest metro foreclosure rate.

I find it interesting that lenders are continuing to push through foreclosures at a high rate in the hardest hit areas. To me this is a clear sign of capitulation. In Las Vegas, they have given up on trying to support prices. They are selling for whatever they can get for their properties — which isn't very much.

In over their heads from the start

There were a whole group of borrowers during the housing bubble who bought houses they had no business being in. Many imported down payments from a previous bubble property sale, and many used 100% financing. Most of these borrowers could never afford the property with the sane underwriting standards we require today.

  • The previous owners of today's featured REO paid $627,000 on 9/15/2004. They used a $500,000 first mortgage and a $127,000 down payment.
  • A scant four months later, they refinanced with a $510,000 Option ARM and obtained a $197,000 HELOC.
  • If they maxed out the HELOC, they regained their down payment plus obtained $80,000 in HELOC booty.
  • The stopped paying in August of 2008 at the latest and managed to squat for over two and one half years.

Foreclosure Record

Recording Date: 05/06/2010

Document Type: Notice of Sale

Foreclosure Record

Recording Date: 03/12/2009

Document Type: Notice of Sale

Foreclosure Record

Recording Date: 12/09/2008

Document Type: Notice of Default

The bank owns this property now, the former owners lost their down payment (or HELOCed and spent it) and now their credit is trashed.

——————————————————————————————————————————————-

This property is available for sale via the MLS.

Please contact Shevy Akason, #01836707

949.769.1599

sales@idealhomebrokers.com

Irvine House Address … 219 TALL OAK Irvine, CA 92603

Resale House Price …… $550,525

Beds: 3

Baths: 3

Sq. Ft.: 1600

$344/SF

Property Type: Residential, Condominium

Style: 3+ Levels, Contemporary

View: City Lights, Hills, Mountain, Peek-A-Boo, Yes

Year Built: 2004

Community: Quail Hill

County: Orange

MLS#: S664118

Source: SoCalMLS

On Redfin: 56 days

——————————————————————————

HUGE REDUCTION! Excellent corner location across from the park and pool. Vantage point views – panoramic of city lights and mountains. Modern style Tri Level with 3 bedrooms (one lower level and two on third level) with 3.5 baths. Each bedroom has access to full bath, while guests have access to 1/2 bath on main floor (2nd). Balcony with BBQ gas line, large wrap around side yard for entertaining. Walking distance to Alderwood Basics Plus school and Association Amenities – Pools, gym, parks, etc.

——————————————————————————————————————————————-

Proprietary IHB commentary and analysis

Resale Home Price …… $550,525

House Purchase Price … $627,000

House Purchase Date …. 9/15/2004

Net Gain (Loss) ………. ($109,507)

Percent Change ………. -17.5%

Annual Appreciation … -1.9%

Cost of Home Ownership

————————————————-

$550,525 ………. Asking Price

$110,105 ………. 20% Down Conventional

4.19% …………… Mortgage Interest Rate

$440,420 ………. 30-Year Mortgage

$120,515 ………. Income Requirement

$2,151 ………. Monthly Mortgage Payment

$477 ………. Property Tax (@1.04%)

$183 ………. Special Taxes and Levies (Mello Roos)

$115 ………. Homeowners Insurance (@ 0.25%)

$0 ………. Private Mortgage Insurance

$187 ………. Homeowners Association Fees

============================================

$3,113 ………. Monthly Cash Outlays

-$353 ………. Tax Savings (% of Interest and Property Tax)

-$613 ………. Equity Hidden in Payment (Amortization)

$165 ………. Lost Income to Down Payment (net of taxes)

$89 ………. Maintenance and Replacement Reserves

============================================

$2,401 ………. Monthly Cost of Ownership

Cash Acquisition Demands

——————————————————————————

$5,505 ………. Furnishing and Move In @1%

$5,505 ………. Closing Costs @1%

$4,404 ………… Interest Points @1% of Loan

$110,105 ………. Down Payment

============================================

$125,520 ………. Total Cash Costs

$36,800 ………… Emergency Cash Reserves

============================================

$162,320 ………. Total Savings Needed

——————————————————————————————————————————————————-

Lenders stop conforming loans above $625,000 in July, home sale fall

Most major lenders stopped processing on loans over the conforming limit intended for sale to the GSEs. In July, both sales and prices declined statewide. Is there a connection?

Irvine Home Address … 3742 CLAREMONT Irvine, CA 92614

Resale Home Price …… $659,500

There was no help, no help from you (Thunder)

Sound of the drums

Beatin' in my heart

The thunder of guns!

Tore me apart

You've been – thunderstruck!

Rode down the highway

Broke the limit, we hit the ton

AC/DC — Thunderstruck

The heartbeats of sellers are racing a little faster. Prices are falling and sellers are becoming more motivated to sell before prices fall further. The high end of the market has been thunderstruck. The conforming limit broke, and the market is hit by a ton of inventory. The high end collapse has finally begun.

New lower conforming loan limit impact on Irvine, CA

The above chart shows the distribution of home prices for all sales under $2M in Irvine, CA from 1/1/2010 through 7/31/2011. Irvine, CA is an expensive sub-market of an expensive region (Southern California). As a result, it is likely to feel any impact from lower conforming home limits more than most other places.

Based on the chart above, it's hard to argue that tighter loan standards and more expensive debt will not impact the upper third of the Irvine home market. Just wait until the increase in the conforming limit enacted in 2008 is completely removed and every loan over $417,000 is subject to jumbo financing. That will impact over half of the Irvine market.

With that in mind, we’ve identified two potential price ranges that could be most impacted by the new limits. The green band represents homes that have selling prices where a 3.5% down payment represents a loan between the old limit ($729,000) and the new limit ($625,000). These properties represent 13.0% of all home sales in Irvine, CA.

For the sake of clarity, this is not to say that 13% of sales used FHA financing. But this is the price range were FHA financing will no longer be bidding on properties. Fewer bidders make for less buyer competition and lower prices.

For the taxpayer’s sake, let’s hope that not many of the buyers in this price range are using only a 3.5% down payment. Those buyers are likely to be underwater soon as we predict continued downward drift in higher end home values in Southern California. These buyers represent one end of the spectrum.

FHA buyers in this price range are candidates for strategic default. They will almost certainly submerge beneath their debts, and they may not breathe the air of equity for many years.

realtors have been creating a false sense of urgency with these buyers cajoling them into buying by stoking fears of being priced out. I pity those who fall for that bullshit. Any of those buyers will be priced-in for years trapped in their homes as prices fall to the new equilibrium of affordability.

On another point (but not the end, which would be “all cash” buyers) of the spectrum, we have buyers who put down 20%. At current Irvine, CA valuations, this is a substantial down-payment of around $170,000. For this level of royalty, we’ve used a purple band in the chart above. Using a 20% downpayment, 8.4% of sales in Irvine, CA would be impacted by the gap between the old and new conforming loan limits.

The purple band is the market segment most at risk. The buyer pool in this segment is very thin, and the supply is very large.

These are estimates — buyers in the green and purple bands have a few options. In order of long-term common sense for the buyer they are:

1. Pay less. Leverage seller fear that the loan limits really will reduce demand and correspondingly demand a lower price.

For sellers who are not delusional, the reality of the situation should increase their motivation. Sellers have stoked fears in buyers for years with nonsense like “buy now or be priced out forever.” The reality today is sellers are facing lower future prices. If they don't sell today, it will be several years before they can obtain today's prices again.

2. (tie) Put more down. Buy down the loan amount so that it becomes conforming.

3. (tie) Delay the purchase. The price-lowering impact from this change will be slight, but will occur over time. With an ongoing slow economy and prices above rental parity, there are no upward drivers for Irvine, CA home values.

4. Use “creative” financing. Pay the asking price but increase your monthly carrying cost for the term of the debt obligation.

I never advise anyone to use any form of creative financing. It is an option one should never consider.

Even though the higher limits don’t go into full effect until 1 Oct 2011, the delays involved in funding a loan will require that banks and brokers use the new limits as soon as possible.

I have heard reports from buyers that B of A and Wells Fargo have already stopped underwriting loans above $625,000 except as jumbo loans. It is likely the dramatic drop in sales in July was exacerbated by this fact.

Mitigating factor: long-term rates, paradoxically, plunged after the US downgrade. One can argue that it makes little sense that a downgraded asset class would be seen as safer after the downgrade, but that’s what Mr Market has said. Because rates are so low, investors will likely be interested in more non-comforming loans as the government makes its slow but necessary disengagement from being the mortgage underwriter of last resort.

Southern California home sales and prices fall again in July

August 15, 2011

Home sales in Southern California fell to their lowest level for a July in four years — though the decline from a year earlier was the smallest in 13 months. The median price was down 4% to $283,000.

This is July. House prices and sales typically do not decline in July. What is going to happen this fall in winter if we are seeing declining sales and prices in July?

The drop in sales from June was more pronounced, especially for houses that cost more than $500,000,

I believe this is directly related to the change in the conforming limit. High end sales were weak before because (1) prices are too high relative to incomes, (2) asking prices have been declining as a sign of seller capitulation, and (3) an abundance of high-end inventory greatly exceeds the depth of the buyer pool.

In reality, what is prices as high-end homes here in Orange County are not really high end. Many houses in many neighborhoods were elevated to high-end price levels from the foolishness of the bubble, and prices are yet to fully deflate. The market for high-end houses only appears weak because so many houses are delusionally priced as if they are high end when they really aren't. The correction in pricing is one of seller's perceptions. The market will force reality on the delusional masses in time.

as the job market sputtered, economic uncertainty intensified and some potential homebuyers got cold feet, real estate information service Dataquick said.

A total of 18,090 new and resale houses and condos sold in Los Angeles, Riverside, San Diego, Ventura, San Bernardino and Orange counties in July. That was down 11.9% from 20,532 in June and down 4.5% from 18,946 in July 2010, according to San Diego-based DataQuick.

Those are very bad numbers. The declines this fall and winter should be substantial, particularly at the high end.

“The latest sales figures look a bit worse than they really are, given this July was a fairly short month, but they still suggest some potential homebuyers got spooked,” said John Walsh, DataQuick president. “Reports on the economy became increasingly downbeat and, no doubt, some people fretted over the possibility the country would default on its obligations.”

July was a fairly short month? Last I checked the calendar, July still had 31 days. WTF is he talking about? John Walsh's consistent market cheerleading has all but eliminated his credibility as a market commenter. He has embraced his role as a realtor shill.

Some wise renters likely did chose to sit on the sidelines, but the drop in sales is more likely a reflection of the fact that the buyer pool is diminished, and prices are too high relative to incomes in most of Coastal Southern California.

Prices also continued to slide. The median, the point at which half the homes sold for more and half for less, has declined year-over-year for the past five months. It has been unchanged or lower than a year earlier each month since last December, when it posted a 0.3% annual increase.

Take a look at the bar graph above again. The first and second quarters of the year are the two which historically post the largest gains in prices, yet prices have declined steadily during that time. There are no signs sales or prices will pick up during the fall and winter when they usually decline.

“If there’s a shred of good news in the data it’s that last month’s sales weren’t much worse than a year earlier,” Walsh said. “For the first time in many months, we get an apples-to-apples comparison to year-ago sales, given that in July 2010 the market lost its crutch — federal homebuyer tax credits.

Yes, we have our first apples-to-apples comparison, and according to Dataquick's data, sales were down 4.5% from last July's weak numbers and prices are also lower. Most market analysts noted the figures for June and July 2010 were very low because the summer demand was pulled forward to April and June 2010 due to the tax credits. Therefore, we are below what was already and artificially low number. That can't be good.

Ponzi borrower gets over two years of squatting

Today's featured property falls in the no-man's land above the new conforming limit. FHA buyers can no longer afford this property with 3.5% down.

The former owner managed to quadruple their mortgage, then they got to squat for over two years when they couldn't make the payments. Rather than selling the house for a half-million dollar gain and walking way with a sizable check, they endured a foreclosure, they are flat broke, and their credit is trashed.

  • This property was purchased on 2/20/1987 for $170,000. The owners original mortgage information is not available, but it's safe to say it was less than $170,000. In all likelihood, they put 20% down back in 1987.
  • On 10/1/1999, they refinanced with a $292,000 first mortgage. They had already gone Ponzi with over $122,000 in mortgage equity withdrawal.
  • On 3/30/2001 they refinanced again with a $340,000 first mortgage.
  • On 3/15/2002 they obtained a $75,000 stand-alone second mortgage.
  • On 3/17/2003 — do you see a yearly pattern here? — they refinanced with a $448,000 first mortgage.
  • On 1/26/2004 they got a $520,000 first mortgage.
  • On 2/25/2005 they were approved for a $130,000 HELOC.
  • On 5/14/2007 they obtained a $554,000 first mortgage and a $240,700 HELOC.
  • Assuming they maxed out the HELOC, total mortgage debt was $794,700.
  • Total mortgage equity withdrawal was $624,700.
  • Assuming the NOD followed after 90 days of delinquency, total squatting time was at least 27 months.

Foreclosure Record

Recording Date: 04/22/2011

Document Type: Notice of Sale

Foreclosure Record

Recording Date: 08/11/2009

Document Type: Notice of Sale

Foreclosure Record

Recording Date: 05/06/2009

Document Type: Notice of Default

The bank finally took this one back on 5/25/2011 for $492,109. They dropped their opening bid to find a third-party, but nobody stepped up to buy the place. The lender must really believe they have a gem as they are pricing it about 30% higher than they paid at auction. If they get anywhere near their asking price, the flippers missed a good deal. Given the plethora of negatives with this property, I doubt they get over $600,000.

——————————————————————————————————————————————-

This property is available for sale via the MLS.

Please contact Shevy Akason, #01836707

949.769.1599

sales@idealhomebrokers.com

Irvine House Address … 3742 CLAREMONT Irvine, CA 92614

Resale House Price …… $659,500

Beds: 5

Baths: 4

Sq. Ft.: 2754

$239/SF

Property Type: Residential, Single Family

Style: Two Level, Other

Year Built: 1970

Community: Westpark

County: Orange

MLS#: S660785

Source: SoCalMLS

Status: Active

On Redfin: 82 days

——————————————————————————

This Two Story Home Features Five Bedrooms and Four Baths, No Mello Roos, Low HOA Dues And An Association Pool And Spa, Tennis Courts And Clubhouse.

——————————————————————————————————————————————-

Proprietary IHB commentary and analysis

Resale Home Price …… $659,500

House Purchase Price … $492,109

House Purchase Date …. 5/25/2011

Net Gain (Loss) ………. $127,821

Percent Change ………. 26.0%

Annual Appreciation … 123.0%

Cost of Home Ownership

————————————————-

$659,500 ………. Asking Price

$131,900 ………. 20% Down Conventional

4.19% …………… Mortgage Interest Rate

$527,600 ………. 30-Year Mortgage

$129,520 ………. Income Requirement

$2,577 ………. Monthly Mortgage Payment

$572 ………. Property Tax (@1.04%)

$0 ………. Special Taxes and Levies (Mello Roos)

$137 ………. Homeowners Insurance (@ 0.25%)

$0 ………. Private Mortgage Insurance

$60 ………. Homeowners Association Fees

============================================

$3,346 ………. Monthly Cash Outlays

-$422 ………. Tax Savings (% of Interest and Property Tax)

-$735 ………. Equity Hidden in Payment (Amortization)

$197 ………. Lost Income to Down Payment (net of taxes)

$102 ………. Maintenance and Replacement Reserves

============================================

$2,488 ………. Monthly Cost of Ownership

Cash Acquisition Demands

——————————————————————————

$6,595 ………. Furnishing and Move In @1%

$6,595 ………. Closing Costs @1%

$5,276 ………… Interest Points @1% of Loan

$131,900 ………. Down Payment

============================================

$150,366 ………. Total Cash Costs

$38,100 ………… Emergency Cash Reserves

============================================

$188,466 ………. Total Savings Needed

——————————————————————————————————————————————————-

First-time homebuyer’s presentation 6:30 Wednesday, August 24, 2011

Everyone is invited to our first-time homebuyer presentation. Put it on your calender for Wednesday evening. I look forward to seeing you there.

First-time homebuyer's presentation 6:30 Wednesday, August 24, 2011

First-Time homebuyer presentation

Larry Roberts, Shevy Akason, and Milaad Forootan are hosting a first-time homebuyer's presentation at 6:30 Wednesday evening on August 24, 2011, at the offices of Intercap Lending (9401 Jeronimo, Suite 200, Irvine, CA 92618).

We developed this presentation assuming those who attend know nothing about the home buying process. We will go through step-by-step showing you what happens at each point along the journey. We will stay after the presentation to answer any and all questions one-on-one to make sure you are comfortable with what you will encounter as you start looking for your OC home.

We look forward to seeing you at the offices of Intercap Lending, 9401 Jeronimo, Suite 200, Irvine, CA 92618 on Wednesday evening on August 24, 2011, at 6:30.

The folly of negative-cashflow investment

Many people speculated on appreciation in the housing bubble without considering the possibility that real estate does not always go up. Now they are stuck with a black hole on their family's balance sheet. What should they do?

Irvine Home Address … 43 BOWER TREE Irvine, CA 92603

Resale Home Price …… $369,000

Everybody's bitching

'cause they can't get enough

And it's hard to hold on

When there's no one to lean on

Bon Jovi — Keep the Faith

Real estate investors during the housing bubble put their money to work on faith. There is no logical reason to believe house prices only go up. In fact, there have been two prior periods in California's recent history where house prices did, in fact, go down. However, with kool aid intoxication, otherwise known as faith-based investing, reality is ignored.

If you truly believe house prices only go up, no price is too high, and you don't have to worry about a backup plan if house prices don't go up. There is only one viable backup plan when a speculative play on appreciation does not pan out: renting the property until you get out at breakeven.

For some people, this was as far as they took their analysis. A glib idea of renting it out gave them all the assurance they needed to pull the trigger on a foolish deal. If they had stopped to do the math, they would have quickly realized rents would only cover a portion of their monthly cost of ownership. A wise person would have recognized this risk and passed on the speculative bet. Investors during the housing bubble were not very wise.

I have read many accounts where everyone claims a collective ignorance. “Nobody could have seen the crash coming” or some other such nonsense. Any investor who bothered to consider their plan B would have quickly realized the risk of an extended period of negative cashflow was an unacceptable risk. Prices didn't have to crash to make this risk a pocketbook-burning reality. Even a flattening of prices for an extended period would have been a problem.

The people who ignored this risk and bought properties are now bagholders. They own property consuming their income and providing no benefit to them whatsoever. Many still cling to their denial and hope for rapid appreciation to bail them out, but many others capitulate to the market and sell. As they sell they keep prices from rising and discourage others. One by one, each market participant moves from denial to acceptance and capitulates by selling at a loss.

When to cry ‘uncle’ on an investment property

August 16th, 2011, 6:00 am — posted by Marilyn Kalfus, real estate reporter

Christine Donovan, a Realtor and attorney who does the weekly “Huntington Beach real estate minute” on listings, homes in escrow and sales, offers some advice in her blog about when to unload real estate bought as an investment that’s failed to pay off.

She writes:

“Have you been watching the value of your investment property go down and wondering what you should do about it?

“It likely depends on what your goals are. If you have lost value, are living in the home, can afford the payments, and it meets your needs, you’re one of the lucky ones, and you should probably just stay where you are. Perhaps when you’re ready for your next home, your home will have regained some of the lost value.

Or perhaps you are just a fool in denial.

“If on the other hand, your investment property is underperforming, perhaps you need to look at it carefully. For instance, let’s look at the following scenario.

“You have equity in your home …

  • But, it’s $250,000 less than it was in 2006.
  • You put money down on the home, and you’ve made payments for several years.
  • You feel that selling it would result in a loss.
  • It’s a rental, and you’re losing $600/month after your mortgage payment.

This is the folly of negative cashflow investment. Nobody should ever be in this circumstance. Nobody who follows my advice ever will be. I advise owner occupants not to pay more than rental parity for the same reason. Negative cashflow is a black hole on your balance sheet sucking the money out of your family never to be returned.

“At this point in time, you may want to do a few things:

Actually, you only need to do one thing: sell. Any rationalization you come up with is foolish denial.

  1. Review rental rates and see if you can increase rates to limit the loss or make the property cashflow
  2. Sit down with your accountant and see if you need the loss for income purposes.
  3. If you don’t need the loss and still can’t make it cashflow, it might be time to consider selling the property and reinvesting in a better performing one.
  4. Some people don’t want to “give up” and think that holding it might make more sense.
  5. But, if you’re losing $7,200 per year, you need to gain that amount in equity plus the amount that you lost when the market values fell, especially if you bought it for less than current market value.

I doubt many investors can review the rental comps and find they are under the market by $600 a month or more. Nice idea, but not very practical.

This woman claims to be a financial advisor, yet she perpetuates the myth that anyone should take a loss for tax reasons. Perhaps tax implications may favor taking the loss this year or next, but waiting several months or years will usually make for larger losses as the negative cashflow eats you up.

The people who doesn't want to “give up” are the ones still in denial. Holding a negatively cashflowing investment never makes sense. Her final point is a good one. For an negative-cashflow investment to make sense, the appreciation must compensate for the negative cashflow. If you examined such an investment's internal rate of return, it would be horrendous because the ongoing negative cashflow compounds against you. It isn't just the lost money, it is the lost opportunity cost on the lost money that really hurts.

“So, when is it time to cry “uncle” on your home? When the loss on your investment property just doesn’t make sense any more.

Anyone in a negative cashflow investment should dump it as soon as possible. It was a bad idea when it was purchased, and holding it makes it even worse.

Follow Huntington Homes and other real estate stories on Twitter @mkalfus

This is really about investor psychology. Many, many speculators in Orange County are sitting on negatively cashflowing investments waiting for the magic appreciation fairies to wave a wand and make them whole again. It isn't going to happen.

So how do you recognize capitulation when you see it? From the comments on the OC Register post:

InTheSameboat says:

Sounds like the situation my wife and I are in. Bought a condo in 2006 at the price peak (sigh). Lived in it for 2.5 years then started renting it out while renting out a bigger place for ourselves and new baby hey not so bad right? 2.5 years later and the loan modification (discount) expired when you add up the taxes, insurance, hoa. It looses 400 a month. $800 a year for the corporation to lease it under of course. Pay for those taxes filed separely of course. Like a lot of young couples on the move fast and making decisions fast we never really factored in all the costs to rent it out in a professional manner. Now with a second child on the way its more like good grief as long as we have a mortgage on this condo we don’t live in and loose so much money on we will never be able to buy a home for 25 years unless we drop it.

So we cried uncle, after 6 months of thinking about it and stubbornly thinking “just keep it” we just couldn’t shake the feeling that rents are going to go up, but only a little bit. The value will go up, but only a little bit. You can call it a recession, and recession part 2 but I think this is the new norm. The painfull and humbling decision was made to short sell it.

With noteable employers leaving the state its going to slow down the recovery and price increases we all prayed for the last few years. Jobs came back and values went up… just not around here. Accepting this reality strenghtened this decision and suppresed the remorse feeling.

I would like to know more about this (if you lived in it 2 years of the past 5 you won’t have to pay capital gain taxes) Our CPA told us otherwise, he said we would have to move back in for 6 months and then sell it to avoid the heavy taxes. Other than that we’ll just have to eat it.

That is capitulation.

The games listing agents play

Three days ago, this property was for sale for $769,000. Today it is being offered for $369,000. So what's up with that?

So what is the real asking price? Who knows.

The buyers paid $590,000 a few weeks ago. It looks like they are hoping to flip it. Since they were the most aggressive bidders in the market, it doesn't seem likely this marketing ploy to create a bidding war to get someone to pay more is going to materialize.

The listing agents are hoping that a hoard of clueless FCBs will bid the price up well beyond what was just paid so everyone can make a quick buck. If there is an auction, you can be sure most of the bidders are shills used to create a false sense of competition. If people are that stupid, more power to these guys. Personally, I find this kind of cheesy, shill-dominated, fake auction a form of real estate sales on par with used car salesmen. Their listings pollute the MLS.

The initial asking price was WTF crazy, and now the price reduction is equally stupid. It probably triggered many searches and ended up in the email inboxes of many market watchers. Perhaps some of them will show up to the auction to see if they can be duped.

If you attend, see if you can pick out the shills and the patsies. And remember, if you can't identify the patsy, it is probably you.

——————————————————————————————————————————————-

This property is available for sale via the MLS.

Please contact Shevy Akason, #01836707

949.769.1599

sales@idealhomebrokers.com

Irvine House Address … 43 BOWER TREE Irvine, CA 92603

Resale House Price …… $769,000

Beds: 3

Baths: 2

Sq. Ft.: 1500

$513/SF

Property Type: Residential, Single Family

Style: Two Level, Other

Year Built: 2003

Community: Turtle Ridge

County: Orange

MLS#: P792545

Source: SoCalMLS

Status: Active

On Redfin: 1 day

——————————————————————————

THIS BEAUTIFUL HOME IS WELL LAID OUT AND VERY SPACIOUS IN THE PRESTIGOUS TURTLE RIDGE COMMUNITY. .. .THIS IS A MUST SEE HOME. .. OFFER FORMS WILL BE ON SITE AND WILL BE ACCEPTED ONE DAY ONLY. .. THIS SATURDAY, AUGUST 20TH!! FROM 11AM-4PM. .. RAIN OR SHINE. .. HOME WILL BE SOLD TO THE BEST BUYER/OFFER WHO PLACES A BID/OFFER ON THAT DAY ONLY. .. THE LIST PRICE IS THE RESERVE OR MINIMUM BID SUBJECT TO THE SELLERS ACCEPTANCE. PLEASE CALL YOUR AGENT IF YOU HAVE ANY QUESTIONS. AUCTION SALE . .. NOT A SHORT SALE, REO OR DISTRESSED PROPERTY.

——————————————————————————————————————————————-

Proprietary IHB commentary and analysis

PRESTIGOUS? NOT A SHORT SALE, REO OR DISTRESSED PROPERTY… just a delusional seller.

Resale Home Price …… $769,000

House Purchase Price … $590,000

House Purchase Date …. 8/8/2011

Net Gain (Loss) ………. $132,860

Percent Change ………. 22.5%

Annual Appreciation … 364.1%

Cost of Home Ownership

————————————————-

$769,000 ………. Asking Price

$153,800 ………. 20% Down Conventional

4.19% …………… Mortgage Interest Rate

$615,200 ………. 30-Year Mortgage

$164,923 ………. Income Requirement

$3,005 ………. Monthly Mortgage Payment

$666 ………. Property Tax (@1.04%)

$250 ………. Special Taxes and Levies (Mello Roos)

$160 ………. Homeowners Insurance (@ 0.25%)

$0 ………. Private Mortgage Insurance

$179 ………. Homeowners Association Fees

============================================

$4,261 ………. Monthly Cash Outlays

-$704 ………. Tax Savings (% of Interest and Property Tax)

-$857 ………. Equity Hidden in Payment (Amortization)

$230 ………. Lost Income to Down Payment (net of taxes)

$116 ………. Maintenance and Replacement Reserves

============================================

$3,046 ………. Monthly Cost of Ownership

Cash Acquisition Demands

——————————————————————————

$7,690 ………. Furnishing and Move In @1%

$7,690 ………. Closing Costs @1%

$6,152 ………… Interest Points @1% of Loan

$153,800 ………. Down Payment

============================================

$175,332 ………. Total Cash Costs

$46,600 ………… Emergency Cash Reserves

============================================

$221,932 ………. Total Savings Needed

——————————————————————————————————————————————————-