What is Past is Prologue

In my last post “How Sub-Prime Lending Created the Housing Bubble,” I went through a thought experiment to demonstrate how the psychological and technical factors interrelate to create a speculative mania. In this post I intend to examine the details of the most recent Southern California residential real estate bubble to deflate, and see what it portends for the future.

Today, we are just past the market top. Predicting when a top will occur is very difficult, but recognizing when one has occurred is not: The market has topped. Volume is down as the pool of buyers is exhausted, and inventories are increasing. Flippers are looking for renters, and everyone is praying for the big spring selling season to bail them out. Denial and bargaining dominates the mindset of sellers.

Since prices are softening, there will be one last push of buyers entering the market: those who felt they were “priced out” but see this softening as an opportunity. These buyers actually believe in the fantasy of continual appreciation. They just missed out on the rally. They are classic “bitter renters.” That is why the first selling season after the top gets the most robust bear rally. Many will call the bottom, and many more will be duped into buying this false rally. The strength of the first selling season gets weighed down by the large volume of inventory that ultimately reverses prices and pushes prices lower.

Early 90’s House Prices

Owners move from denial and bargaining to anger after seeing the failure of the spring selling season and even lower prices than the year before. Many begin to recognize they have a real problem, but many hold out hope that things will turn around “next year.” The second year after the peak, the spring selling season is even weaker than the first, mostly because sellers are more motivated and buyers less so. In year two the remaining sellers who were in denial have moved to anger and acceptance. By the end of year two, all the market participants know prices are declining and will continue to do so.

The third year after the top, selling really gets panicky. Prices are falling quickly and volume is increasing. There is no spring bounce, and prices decline every month of the year. Everyone has accepted that prices are going to fall, and owners are very depressed. This may continue for multiple years if prices remain above fundamental valuations.

In the fourth year, if prices have fallen low enough to be close to the upper range of fundamental valuations, buyers begin to enter the market. The market may even experience its first price rally in two years. However, the large number of foreclosures and large overall inventories prevent this rally from taking hold. Prices resume their descent after the spring push. At this point in the decline, most participants in the market see residential real estate as a bad investment. Why wouldn’t they, most just lost money? People believe that renting is better than buying, and the belief in appreciation is dead.

LA Prices vs. Rents

In the years that follow, market prices enter the range of fundamental valuations where they find support. Prices may continue to decline somewhat, perhaps even overshooting the fundamentals due to the foreclosure inventory, but if prices fall low enough, cashflow investors will enter the market in force and create a durable bottom. However appreciation will not return quickly. The market will flatten at the bottom as the Rent Savers and Cashflow Investors absorb the market inventory. The inventory will remain high. All of the ARM’s issued during the rally are now resetting, and most of the borrowers are underwater. This forces a sale, and generally another bankruptcy.

.

“What is past is prologue.” William Shakespeare. The Housing Bubble vs. The Great Depression

How Sub-Prime Lending Created the Housing Bubble

A real estate market decline, like any market decline, is part technical, part fundamental, and part psychological. In my previous post “How Inflated are House Prices?” I discussed the fundamental value of real estate and described how and why prices fall to their fundamental values once a bubble has burst. In this post, I intend to describe the technical and psychological factors at work during a speculative mania, and demonstrate how sub-prime lending created this bubble.

A Thought Experiment

I would like to start with a thought experiment. Imagine a room with 100 people representing the pool of sub-prime borrowers. These are new entrants to the market. They were previously unable to buy due to bad credit, lack of savings, etc. All of them are told they are going to bid on an asset that never goes down in value, and they will be given the ability to borrow unlimited funds (stated income loans, aka “liar loans”) The only caveat is the borrowed money must be paid back when the asset is sold (not that they would care, they already have bad credit). Imagine what would happen?

People would start to buy the asset, and prices would rise. Others in the room seeing the rising prices would come to believe that indeed the value of the asset never declines. They would then join in the bidding. As the bidding drives prices even higher, a manic quality takes over the bidding and people compete with each other, often bidding higher than the asking prices. Nobody wants to be left out. There are fortunes to be made. Greed drives prices upward at a staggering rate. As the last of the 100 people buy, prices are very high, everyone has made money, and it looks as if prices will continue to rise forever . . .

Then something strange happens: there is nobody left to buy. (A key indication of the end of a speculative mania is a huge decline in sales, just as we have witnessed over the last year or two.)

Transaction volume drops off dramatically, and prices stop their dizzying ascent. Nobody is particularly alarmed at first, but a few of the more cautious sell their asset to pay off their loan. Since there are no more buyers, the first selling actually causes prices to drop. This is unprecedented: Prices have never declined! Most write it off as an aberration and comfort themselves with the past history of rising prices; however, a few are spooked by this unprecedented drop and sell the asset. This selling drives prices even lower.

Subprime Mortgage Percentage of Market

(This brings us up to today in the local real estate market. But what about tomorrow?… Let’s continue our thought experiment.)

Now those who still own the asset become worried, some maintain denial that there is a problem, and some get angry about the price declines. Some of the late buyers actually owe more than they paid for the asset. They sell the asset at a loss. The lenders now lose some money and refuse to loan any more money to be secured against the asset (notice the recent implosion of sub-prime lending). Now there are even fewer buyers and a large group of owners who all want to sell before prices drop any lower. Panic selling ensues.

Everyone wants to sell at the same time, and there are no buyers to purchase the asset. Prices fall dramatically. This asset which was sought after at any price is now for sale at any price, and there are few takers. People in the market rightfully believe the asset will continue to decline. Owners of the asset have accepted the new reality; they are depressed and despondent.

In any group of people, there are always a few who don’t believe the “prices always rise” narrative. Some recognize that asset prices cannot rise indefinitely and cannot stay detached from their fundamental valuations. These people witness the rally and the resulting crash without participating. They wait patiently for prices to drop back to fundamental values, and then these people buy. As these new buyers enter the market, prices stop their steep decent and market participants start to hope again. It takes a while to work off the inventory for sale in the market, so prices tend to flatten at the bottom for an extended period of time; however, just as spring follows winter, appreciation returns to the market in time, and the cycle begins all over again.

What is written above is true of any asset whether it be stocks, bonds, houses or tulips. In our case, it is the local housing market, and the room of new buyers are sub-prime borrowers, but the concepts are universal. One phenomenon somewhat unique to the housing market is the forced sale due to foreclosure (stocks have margin calls). Even if the psychological factors at work during the panic could somehow be quelled, the forced sales from foreclosures would drive down prices anyway. True panic is not required to crash a housing market, only dropping prices and an inability to make payments. Sub-prime lending was the leading cause of this market bubble, and its implosion will exacerbate the market decline.

.

P.S. A special thanks to OC FlipTrack for the Stages of Grief.

How Inflated are House Prices?

One of the main contentions of the bearish argument is that house prices are overvalued. To determine whether or not that premise is true, there must be some way to appraise the fundamental value of a house. Once determined, this fundamental value serves as a point of comparison to the prices at which houses are currently being bought and sold. If current prices are shown to be above fundamental value, it establishes that house prices are inflated, and it also provides a measure of the degree of that inflation.

The corollary argument made by housing bears is that inflated housing prices have not historically remained inflated and have for good reason fallen back to fundamental valuations at each market decline. If this corollary argument can also be demonstrated to be true, it provides a way of projecting the market decline we can expect to see in the future.

The fundamental value of all housing prices is comparative rents. Rents define the fundamental value of real estate because rental is a direct proxy for ownership; both rental and ownership provide for possession of property. In a normal real estate market, when prices go up and the cost of ownership exceeds the cost of rental, people choose to rent rather than own, and the resulting drop in demand depresses home prices: The inverse is also true. Therefore, the proxy relationship between rental and ownership generally keeps home prices tethered to rental rates.

Rental rates tend to keep pace with wages because you normally pay rent out of current income. As people make more money, they compete for the available rentals and drive prices up at a rate about 1% greater than the overall rate of inflation. There are times when supply and demand issues in local markets create fluctuations in this relationship, but as a rule, rents track wages pretty closely.

Since house prices are tied to rents, and rents are tied to wages, house prices are indirectly tied to wages. When house prices increase faster than wage growth, the price levels become unsustainable, and if the differential is too great, you get a bubble.

Two Levels of Buyer Support

There are two categories of buyers that will enter the market and purchase real estate without regard to appreciation: Rent Savers and Cashflow Investors. These are the buyers that will buy houses even if prices are declining; therefore, they are the ones who call the bottom. Rent Savers are buyers, like me, who enter the market when it is less expensive to own than to rent. It doesn’t matter to these people what houses trade for in the market in the future. They are not buying with fantasies of appreciation. They just know they are saving money over renting, and that is good enough for them.

Cashflow Investors have a different agenda; they want to turn a monthly profit from ownership. For them, the cost of ownership must be less than prevailing rent for them to make a return on their equity investment. Cashflow Investors form a durable bottom. If prices drop low enough for this group to get into the market, the influx of investment capital can be extraordinary.

In a declining market, a market where by definition there is more must-sell inventory than there are buyers to absorb it, it takes an influx of new buyers to restore balance. Since it is foolish to buy with the expectation of appreciation in a declining market, the buyers who were frantically bidding up the values of properties in the rally are notably absent from the market. With the exception of the occasional knife-catcher, these potential buyers simply do not buy. This absence of buyers perpetuates the decline once it starts. Add to that the inevitable foreclosures in a price decline, and you have an unending downward spiral. It takes Rent Savers and Cashflow Investors to enter the market to provide support, break the cycle and create a bottom.

Calculating a House’s Fundamental Value

Let’s evaluate the fundamental value of a house I found at 51 Sanctuary with a rental rate of $5,000 a month and a purchase asking price of $1,589,000. Assuming both the rental rate and the asking price are reasonable in today’s market, how much could you afford to pay and keep the cost of ownership to $5,000 a month using a conventional 30-year mortgage? The first debatable, simplifying assumption I am going to make is that the income tax savings will offset the cost of taxes, insurance and HOA fees. The second debatable, simplifying assumption I am going to make is that you could obtain 100% financing at 6% interest. IMO, both of these assumptions do not change the math significantly except in cases of exceptionally high HOA fees. To end up with a monthly payment of $5,000, you would be limited to a mortgage of $834,000. If you were willing to put up a 20% downpayment (and give up your interest at the bank) to purchase this property, you could pay $1,000,000. How does this house price compare to its fundamental value? If you factor in a dead-money downpayment, this house is overvalued by 58.9%. If you assume 100% financing, this house is overvalued by 90.5%. If mortgage interest rates rise, the numbers get even worse. At 7% interest, which is closer to historic norms, the mortgage is limited to $750,000 making this house more than 100% overvalued.

So what about the Cashflow Investor, how low do prices have to go before they buy? They can borrow $580,000 at 6% with a $3,500 a month payment. This leaves $500 a month for vacancy loss and expenses and $1000 a month to provide a return on their investment. If they put $120,000 down, they would be getting a 10% return on their money ($12,000 / $120,000 = 10%). This puts the purchase price at $700,000. To the cashflow investor, this house is 127% overvalued.

As you can see there are two price areas where new buyers enter the market, depending on the assumptions used and the costs specific to the property, these numbers can vary, but they will fall within general ranges. Rent Savers will pay from 180 to 150 times monthly rent, and Cashflow Investors will pay from 120 to 150 times monthly rent based on today’s financing terms. If credit tightens, and mortgage interest rates go up, these ranges will decline making prices seem even more inflated.

In summary, I would argue that house prices in Irvine are at least 60% overvalued and probably closer to 100%. Price declines of 35% to 50% are required to bring prices back in alignment with their fundamental values. Since price declines of this magnitude will take time, and since rents and wages will continue to rise while home prices are declining, expect price declines of 30% to 40% over the next three to five years before new buyers will enter the market and form a durable bottom.

Financially Conservative Home Financing

In my first post, I said I was financially conservative. What does that mean with respect to financing a home purchase? It occurred to me that exotic financing terms are not exotic anymore. Interest-only, adjustable rates, and negative amortization have become so ubiquitous that nobody seems to remember why 30-year fixed-rate mortgages are used (or were used, they aren’t common in OC anymore). That is the focus of this post.

To be financially conservative is to be risk adverse. A fixed-rate conventionally-amortized mortgage is the least risky kind of mortgage obligation. If you can make the payment – a payment that will not change over time – you get to keep your home. A 30-year term is most common, but if you make bi-weekly payments (makes two extra per year), you can pay the loan off in 22 years. If you can afford a larger payment in the future, you can increase your payment and amortize over 15 years and pay off your mortgage quickly. The best insurance you can have to deal with unemployment or disability is a house that is paid off. As you can see, stabilizing or eliminating your mortgage payment reduces your risk of losing your house or facing bankruptcy. Unfortunately, payments on fixed-rate mortgages are higher than other forms of financing.

The interest-only, adjustable-rate mortgage (IO ARM) became popular early in this bubble when fixed-rate mortgage payments were too large for buyers to afford. In the bubble of the late 80’s, these mortgages did not become common, and the bubble did not inflate beyond people ability to make fixed-rate conventional mortgage payments. This is also why prices were slow to correct in the deflation of the early 90’s because most sellers didn’t need to sell, so they just waited out the market. It was a market correction characterized of large inventories, but this inventory was mostly not the “bad” inventory of must-sell homes. The few must-sell homes that came on the market in the early 90’s drove prices lower, but not catastrophically because the rally in prices did not get too far out of control; however, this bubble is different.

IO ARMs are risky because they increase the likelihood of losing your home. IO ARMs generally have a fixed payment for a short period followed by a rate and payment adjustment. This adjustment is almost always higher, and sometimes, it is much higher. At the time of reset, if you are unable to make the new payment (your salary does not increase), or if you are unable refinance the loan (home declines in value), you will lose your home. It’s that simple. These risks are real, as many homeowners are about to find out. People try to minimize this risk by extending the time to reset to 7 or even 10 years, but the risk is still present. If you had bought in 1990 with 100% financing on an interest-only loan and had to refinance in 1999, your house was probably worth less than you paid, and you would not be given the new loan. Even a 10 year term is not long enough if you buy at the wrong time. As the term of fixed payments gets shorter, the risk of losing your home becomes even greater.

The advantage of IO ARMs is their lower payments. Or put another way, the same payment can finance a larger loan. This is how IO ARMs were used to drive up prices once the limit of conventional loans was reached (somewhere in 2003 in OC). A bubble similar to the last bubble would have reached its zenith in 2003/2004 if IO ARMs had not entered the picture. In any bubble, the system is pushed to its breaking point, and it either implodes, or some new stimulus pushes it higher. Enter the negative amortization (Neg Am) mortgage (aka – option ARM).

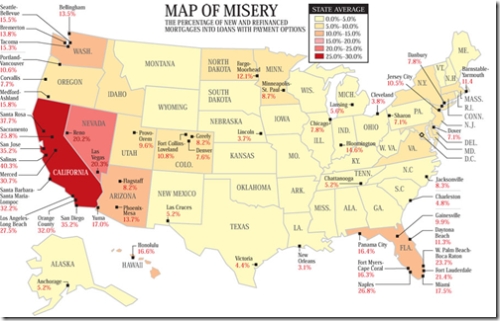
The Neg Am / option ARM loan is the riskiest possible loan imaginable. It has all the risks of an IO ARM but with the added risk of an increasing loan balance. Using this loan, not only do you have the risk of not being able to make the payment at reset, but you are much more at risk of being denied for refinancing because your loan balance can easily exceed your house value. In either case, you lose the home. (According to Businessweek’s Map of Misery, 32% of new and refinanced mortgages in Orange County were of this type. See article Nightmare Mortgages)

The risk management measure not related to the mortgage terms is the downpayment. Most people don’t think of downpayments as a way of managing risk, but banks do. Downpayments reduce your risk in two ways: first, they lower your monthly payment, and second, they give you a cushion ensuring you can refinance (if necessary) should your house value decline. The problem with downpayments is obvious: few people save enough money to have one.

Eliminating downpayments through the use of 80/20 combo loans was another massive stimulus to the housing market. Lenders used to require downpayments because it required a borrower to demonstrate the ability to save. At one time, saving was considered a reliable indicator as to a borrower’s ability to make timely mortgage payments. Once downpayments became optional, a whole group of potential buyers who used to be excluded from the market suddenly had access to money to buy homes. Home ownership rates increased about 5% nationally due in part to the elimination of the downpayment barrier.

The combination of IO ARMs, Neg Am / option ARMs, and 80/20 combo loans took what would have been a bubble like the 90’s and turned it into an uberbubble (look at it as a bubble built on top of a bubble). In the early 90’s in California the median home price dropped from around $200K to $175K, about a 12.5% decline. The current bubble is about three times as large. Does that mean a 37.5% decline is coming? Only time will tell.

When I say I am financially conservative, I am saying I will only finance a home with a fixed-rate conventionally-amortized mortgage and a sizable downpayment. The reason for this is simple stress management: I don’t want to spend the next several years worried about my loan reset or house value or future salary raises. I will buy someday, not because I want to make a fortune in Southern California real estate, but because I want to have a stable housing payment, and a stress-free life.

.

.

P.S. For all of you who see this entire post as common sense (which it is), check this out: Don’t Buy Stuff You Can’t Afford

Bainbridge – A 6 month flip in Northwood Pointe

Address: 7 Green Hollow, Irvine, CA 92620 (Northwood Pointe)

Plan: 3004 sq ft – 5bd/4ba

MLS: S470910 DOM: 51

Sale History: 7/28/2006: $1,230,000

6/6/1997: $337,000

Current Price: $1,249,900

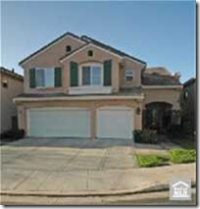
Here we’ve got a plan 3 in the Bainbridge tract built by California Pacific Homes in Northwood Pointe. It was purchased at the peak(?) in the summer of 2006 for $1,230,000 and subsequently listed 5 months later at $1,249,900. Ummm… prices have gone DOWN in the last 5 months, not UP. But sure, I understand that no one wants to lose money. From what I can gather, it was purchased with 20% down and in December 2006 they refinanced the 80% and took out a 10% HELOC. There’s definitely some room to bring the price down on this depending upon how motivated the sellers are.

{adsense}

Is this is a greedy flip or a corporate relo? Who knows? But I do know that the pictures put up for this home on MLS are of horrible quality which is surprising since the agent is a pretty big producer in Irvine. If you are going to sell your home for $1.25mil, you need to make sure that the agent you are paying a fat commission to is spending money on marketing your property correctly – one small part of that is putting up high quality pictures on MLS.

If sold for the asking price of $1,249,900 and assuming 6% in selling costs, the sellers are looking at a $55,000 loss! Surprisingly (at least to me), another plan 3 sold for $1.35 mil in April 2006. Maybe these sellers tried to catch a falling knife when they bought this past summer.