Category Archives: News

The housing crash and foreclosures are causing major health problems

The emotional toll of financial distress is causing health problems for many in the aftermath of the housing bubble.

Irvine Home Address … 1 GREENFIELD #18 Irvine, CA 92614

Resale Home Price …… $363,000

If I was sick like you,

I would feed the fire

I would light it up

And watch it all drop down

Adelitas Way — Sick

Not long ago, I wrote the post The housing bubble and crash is causing great psychological harm. It isn't only emotionally that people are being hurt by the collapsing housing bubble. The emotional distress is leading to real physical symptoms.

Tying Health Problems to Rise in Home Foreclosures

By S. MITRA KALITA — AUGUST 31, 2011

The threat of losing your home is stressful enough to make you ill, it stands to reason. Now two economists have measured just how unhealthy the foreclosure crisis has been in some of the hardest-hit areas of the U.S.

New research by Janet Currie of Princeton University and Erdal Tekin of Georgia State University shows a direct correlation between foreclosure rates and the health of residents in Arizona, California, Florida and New Jersey. The economists concluded in a paper published this month by the National Bureau of Economic Research that an increase of 100 foreclosures corresponded to a 7.2% rise in emergency room visits and hospitalizations for hypertension, and an 8.1% increase for diabetes, among people aged 20 to 49.

Each rise of 100 foreclosures was also associated with 12% more visits related to anxiety in the same age category. And the same rise in foreclosures was associated with 39% more visits for suicide attempts among the same group, though this still represents a small number of patients, the researchers say.

Teasing out cause and effect can be delicate, and correlation doesn't necessarily mean foreclosures directly cause health problems. Financial duress, among other issues, could lead to health problems—and cause foreclosures, too.

Foreclosures are a symptom of overall financial distress. Many people quit making payments because they lost their jobs. However, many people couldn't afford the houses they were in because the loans they took out. Lenders who peddled Option ARMs and other toxic loan products are directly responsible for the financial distress and foreclosures these loans caused.

The economists didn't find similar patterns with diseases such as cancer or elective surgeries such as hip replacement, leading them to conclude that areas with high foreclosures are seeing mostly an increase of stress-related ailments.

Tuesday brought news of further weakness in the housing market as the closely watched S&P/Case-Shiller home-price index came in 5.9% lower for the second quarter from a year earlier. Continued job losses and economic uncertainty could weigh on home prices and make for another wave of foreclosures, economists say.

The double dip will make for another wave of foreclosures, but it won't be from the newly unemployed, it will be from the legions of overextended borrowers who finally capitulate. The bear rally of 2009-2010 was the last gasp of denial these people had. The ugly truth of a weak economy and a huge overhang of supply is becoming common knowledge, and the market bulls are having difficulty maintaining their denial.

It may not just be foreclosure victims arriving at hospitals—but neighbors also grappling with depleting equity in their biggest investment.

“You see foreclosures having a general effect on the neighborhood,” Ms. Currie says. “Everybody's stressed out. There is a connection between people's economic well being and their physical well being.”

The situation got so bad for Patricia Graci, a 51-year-old Staten Island, N.Y., resident, that she canceled a recent court appearance related to the foreclosure on her house because she couldn't get out of bed. After her husband lost his job as a painter in 2008, the Gracis relied on savings to pay their mortgage for two years.

“Everything was going downhill. My savings were going down to nothing,” says Ms. Graci. “When I realized the money wasn't there anymore, I started getting very anxious and depressed.”

Being broke will do that.

She says her lender advised her to default on her mortgage to qualify for a loan modification. Ms. Graci, who was an assistant bank manager and already had rheumatoid arthritis, says she began seeing a therapist and landed in the hospital with difficulty breathing in December 2009. A few weeks later came the foreclosure notice from the bank.

“They told me it was more anxiety and stress that made me wind up in the hospital than the arthritis,” Ms. Graci says. After repeatedly missing work due to illness, Ms. Graci went on long-term disability.

Sad case. She should feel better once the foreclosure is complete. Her attachment to her old home which is causing her so much suffering will be broken. Perhaps it sounds heartless but I believe the foreclosure is the most compassionate outcome for this woman now. She and her husband can no longer afford their home.

The areas that have the highest foreclosure rates also tend to have a large portion of their population unemployed, underemployed or uninsured. Ms. Currie says the research accounted for this by instituting controls for persistent differences among areas, such as poverty rates, as well as for county-level trends. Much of the 2005-2009 period examined came before unemployment peaked, too, she says. The researchers examined hospital-visit numbers and foreclosure rates in all ZIP Codes that had those data available.

They found that areas in the top fifth of foreclosure activity have more than double the number of visits for preventable conditions that generally don't require hospitalization than the bottom fifth.At the local hospital in Homestead, Fla., a city of mostly single-family, middle-class homes about 30 miles from Miami, the emergency room has been bustling. Emergency visits to the hospital in 2010 more than doubled from 10 years earlier to about 67,000, and emergency department medical director Otto Vega says they will surpass 70,000 this year. Homestead has the highest rate of mortgage delinquencies in the U.S.—in June, 41% of mortgage holders in the hardest-hit ZIP Code of Homestead were 90 days or more past due on payments, according to real-estate data firm CoreLogic Inc.

Nearly half the city is delinquent on their mortgage and squatting in their homes. That's an astonishingly high number.

While the most common ailments are respiratory problems and pneumonia, Dr. Vega notes an increase in psychosomatic disorders, such as patients with chest pain and shortness of breath, and others who feel suicidal. “A lot of young people, less than 50 years old, have chest pain. You know it's anxiety,” he says.

Nationwide, overall emergency-room visits have also been rising, growing 5% from 2007 to 127.3 million in 2009, according to the American Hospital Association. But inpatient stays have largely kept pace with population growth over the last decade, says Beth Feldpush, a vice president for policy and advocacy at the National Association of Public Hospitals.

The number of people covered by employer-sponsored insurance has been falling, she says. “When people don't have insurance, they put off seeking care for too long and end up in the emergency room.

The lack of preventative care is likely the real cause for the dramatic increase in emergency room visits.

And some of those seeking treatment had medical conditions before foreclosure—but the stress of losing their homes has exacerbated their ailments.

In 2008, Norman Adelman of Freehold, N.J., called his lender to ask for a forbearance of three or four months, saying he was about to undergo knee-replacement surgery. The lender complied and Mr. Adelman, who runs a home-energy business, says he began scaling back his work. He underwent needed tests and doctor visits.

After two months of not paying his mortgage, he successfully applied for a loan modification, taking his monthly payment from $2,700 to $1,900. But then the loan was sold—and a new servicer didn't recognize the terms of the arrangement, he says.

Whether he deserved the modification or not, if the lender sold the loan to a new lender who didn't honor the agreement, this borrower has good cause to be angry.

Mr. Adelman is fighting the new lender but says he has been in and out of the hospital for the last two years. He never had his knees replaced and is now on antidepressants and antianxiety medication.

“He's deteriorated. He's had sleepless nights,” says his wife, Shulamis. “You always have this fear of being thrown out. He's just gotten worse and worse from not sleeping.”

Earlier this month, after working with the nonprofit Staten Island Legal Services, Ms. Graci received a trial loan modification. “I'm happy but I am still scared,” she says. “I want a permanent solution. I don't know if I am in the clear.”

Write to S. Mitra Kalita at mitra.kalita@wsj.com

There is unquestionably an increase in anxiety caused by the recession, and foreclosures are a part of that problem. These reports leave me with mixed emotions. Part of me feels bad for the circumstances these people find themselves in. But part of me gets annoyed at the typical American whiner who can't put on a stiff upper lip and deal with the problems life throws at them.

Financial distress is self inflicted — I know because I inflict it on myself as well. Giving up attachments and entitlements makes financial distress go away. People who are unwilling to accept a decrease in their standard of living when their income declines create their own misery. At least this story wasn't the lead in for a proposal for a massive government subsidy designed to preserve the entitlements of borrowers at the expense of the rest of us.

$8,000 in; $193,000 Out

The foreclosed former owner of today's featured property demonstrates why California housing is so appealing to commoners. This property was purchased for $160,000 on 5/12/1999. The owner used a $152,000 first mortgage and a $8,000 down payment. That's 5% down.

On 11/27/2002, the owner refinanced with a $212,000 first mortgage, and on 7/31/2003 refinanced again with a $211,000 first mortgage. With only $50,000 in mortgage equity withdrawal, the owner was at least attempted to manage the growth in their mortgage.

On 6/29/2004 the owner obtained a $150,000 HELOC. Any prudence was abandoned.

On 5/15/2007 Bank of America gave this borrower a $345,000 first mortgage. I say gave because this loan was really stupid, and the borrower defaulted a few years later.

Foreclosure Record

Recording Date: 03/29/2011

Document Type: Notice of Sale

Foreclosure Record

Recording Date: 12/22/2010

Document Type: Notice of Default

Bank of America moved quickly through the foreclosure process once they issued the NOD. They tried to lower the bid to get a third party to buy the property at auction, but their $257,200 opening bid still resulted in another REO.

I suspect Bank of America listened to an exuberant listing agent who led them to believe the property is worth $363,000. If it really were worth that much, a third party would have stepped up to buy it. Expect to see discounts on this one before it finally sells. Recent model-match comps are selling for $30,000 to $40,000 less.

——————————————————————————————————————————————-

This property is available for sale via the MLS.

Please contact Shevy Akason, #01836707

949.769.1599

sales@idealhomebrokers.com

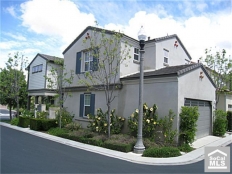
Irvine House Address … 1 GREENFIELD #18 Irvine, CA 92614

Resale House Price …… $363,000

Beds: 2

Baths: 2

Sq. Ft.: 1140

$318/SF

Property Type: Residential, Condominium

Style: Two Level, Contemporary

Year Built: 1984

Community: Woodbridge

County: Orange

MLS#: S670865

Source: SoCalMLS

Status: Active

On Redfin: 13 days

——————————————————————————

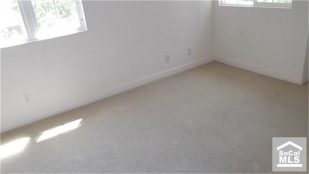
This lovely upper, corner Alders condo features 2 bedrooms, 2 full bathrooms, a spacious kitchen with newer appliances, recessed lighting, crown molding throughout, newer paint and carpet, indoor laundry, and an enclosed exterior storage space near entrance. The community features a swimming pool and beautiful, well-maintained grounds, and is conventiently located to John Wayne Airport, shopping, schools (UC Irvine), parks and more!

——————————————————————————————————————————————-

Proprietary IHB commentary and analysis

Resale Home Price …… $363,000

House Purchase Price … $160,000

House Purchase Date …. 5/12/1999

Net Gain (Loss) ………. $181,220

Percent Change ………. 113.3%

Annual Appreciation … 6.6%

Cost of Home Ownership

————————————————-

$363,000 ………. Asking Price

$12,705 ………. 3.5% Down FHA Financing

4.26% …………… Mortgage Interest Rate

$350,295 ………. 30-Year Mortgage

$114,788 ………. Income Requirement

$1,725 ………. Monthly Mortgage Payment

$315 ………. Property Tax (@1.04%)

$0 ………. Special Taxes and Levies (Mello Roos)

$76 ………. Homeowners Insurance (@ 0.25%)

$403 ………. Private Mortgage Insurance

$447 ………. Homeowners Association Fees

============================================

$2,965 ………. Monthly Cash Outlays

-$273 ………. Tax Savings (% of Interest and Property Tax)

-$482 ………. Equity Hidden in Payment (Amortization)

$19 ………. Lost Income to Down Payment (net of taxes)

$65 ………. Maintenance and Replacement Reserves

============================================

$2,296 ………. Monthly Cost of Ownership

Cash Acquisition Demands

——————————————————————————

$3,630 ………. Furnishing and Move In @1%

$3,630 ………. Closing Costs @1%

$3,503 ………… Interest Points @1% of Loan

$12,705 ………. Down Payment

============================================

$23,468 ………. Total Cash Costs

$35,100 ………… Emergency Cash Reserves

============================================

$58,568 ………. Total Savings Needed

——————————————————————————————————————————————————-

Using rental parity to find bargain properties

I use rental parity analysis to find neighborhoods where cashflow properties abound in Las Vegas. Owner occupants can also take advantage of this analysis to narrow their search to the cities and zip codes with the best bargains.

Irvine Home Address … 214 TUBEROSE Irvine, CA 92603

Resale Home Price …… $704,900

The power of equality

Is not yet what it ought to be (ought to be)

It fills me up like a hollow tree (hollow tree)

The power of equality

Right or wrong

My song is strong

Red Hot Chili Peppers — The Power of Equality

Equality has power. Rental parity is a powerful price point because the cost of ownership is equal to the cost of rental. Theoretically, buyers should be indifferent at rental parity, but in the real world kool aid intoxication prompts many buyers to bid prices up above rental parity. The true power of this threshold doesn't become apparent until prices fall and owners find themselves paying far more than comparable rentals for properties worth less than they paid.

Today's post will be heavy on math, but I want to give everyone a look inside the black box of aggregate rental parity calculations. I use this analysis in Las Vegas to locate neighborhoods with the best rental property deals, but owner occupants can also take advantage of this analysis to narrow their search for properties to those cities or zip codes with the best bargains. In our deflating housing market, rental parity analysis is a useful tool for identifying which areas have deflated and which ones have not. I will be presenting the data for Irvine and select Orange County cities in my September 12 presentation at JT Schmids.

Rental Parity defined

Rental parity is the price point where the cost of ownership is equal to the cost of rental. Rental parity is an important price level because buyers who pay more than rental parity risk being trapped in a negative cashflow situation if they should need or want to move before the resale value has appreciated enough to cover their transaction costs on the sale. When people pay more than rental parity, they don't have a viable plan B to get out of their property.

Because rental parity is such an important threshold, evaluating the costs of ownership relative to rentals is an excellent way to measure value. If a property is trading above rental parity, the price is inflated above reasonable valuation. Perhaps in a few of the most desirable communities where move-up buyers bring equity from previous sales, properties can trade consistently above rental parity. However, for the vast majority of the housing stock, valuations at or below rental parity are the norm and define fundamental value.

If a property is reselling below rental parity, it can be rented for a profit. If it selling well below rental parity, it may be a good cashflow investment. The only way to be certain is to perform a property-specific analysis taking account of recent comps for both resales and rentals and inputting specific property information for HOAs, Mello Roos, and other costs.

I developed the analysis I will cover today to identify areas in Las Vegas where cashflow properties are common. Rather than try to analyze all 40,000 properties on the MLS, I developed this technique to narrow my search to specific areas of town or specific zip codes. It also enables me to give a rough idea of cap rates and cash-on-cash returns in any area based on aggregate numbers.

Using Rental Parity Analysis to find bargains

I performed a detailed analysis of the Las Vegas housing market (PDF of analysis here). I use it to identify which zip codes and which areas of town provide the greatest returns to cashflow investors. However, this is a useful tool to anyone looking for a home, not just investors. Nobody wants to overpay, and its difficult to get a broad overview of prices and values across the whole of Orange County by browsing properties on Redfin.

A rental parity analysis will reveal if a specific property you are looking at is a good deal or just average for the area, it may prompt you to look in areas you previously never considered, or it may reinforce your desire to keep looking in your area of choice. It's one more tool you can use to be sure you have made the correct decision on buying a home.

Patrick.net has a great rental parity calculator you can use to analyse properties. Check it out.

Rental parity analysis and the returns on real estate

Rental parity analysis gives me a broad overview of the market, but the point of the analysis is to direct me toward individual properties which yield results equal to or better than the rest of the neighborhood. Once I have identified the property, I put the information into an IHB Fundamental Value Report to calculate the cost of ownership and returns from the property as an investment.

The return on real estate is measured in three ways: capitalization rate, cash-on-cash return, and internal rate of return. Each of those is described in detail below.

Calculating capitalization rates

The basic calculation I perform is the capitalization rate, the net operating income divided by price. The capitalization rate is the return an all-cash investor would obtain from the property. It is always wise to examine the unleveraged returns of any investment as extreme leverage can exaggerate the returns of nearly any investment and disguise the underlying risk.

To obtain the capitalization rate for an entire zip code, I obtain four values from the MLS:

  • Average rents over last 30 days
  • Average square feet of rentals
  • Median sales price
  • Average square feet of resales

The square footage is necessary to normalize the numbers. Although not perfect, normalization by square footage is far superior than simply taking the raw rental number and dividing it by the median home price.

From these four pieces of data, I calculate the capitalization rate as demonstrated below.

Below is an example from the 89031 Zip Code in Las Vegas:

Cap Rate Avg Rent Avg Rent SF Avg Rent

Per SF

Avg Sale Price Avg Sale SF Avg Sale

Per SF

8.0% $1,148 1,751 $0.66 $116,335 1,817 $64.04

So how does that compare with the reality of individual properties in that zip code?

The capitalization rate analysis correctly predicted where I could find properties with desirable characteristics.

Cash-on-Cash return calculations

The cash-on-cash return is more important than capitalization rates for the average investor who uses debt to acquire real estate. The cash-on-cash return compares the down payment to the cashflow remaining after interest is paid (includes positive cashflow plus amortization).

The calculation for cash-on-cash uses the capitalization rate calculated above and magnifies it — both up or down — based on the financing terms. The lower the down payment, the greater the returns are magnified. This is why speculators were keen to use 100% financing when it was made readily available during the bubble. Returns were infinite, and the risk of loss was passed on to the lender.

The debt ratio is the magnifying factor of leverage. The down payment is divided into 1 to obtain the multiplying factor.

The fulcrum point of leverage is the interest rate. The interest rate must be lower than the capitalization rate for debt to have a positive effect. This was one of the key mistakes investors made during the bubble. People were buying properties with 4% capitalization rates using 6.5% debt. That's crazy. No sane investor would apply debt that is more expensive than the capitalization rate — insane speculators do this all the time, but the moment prices go down, and the property cannot be sold for a profit, the negative cashflow of inappropriately leveraged real estate eats people up.

The above property with a 7.7% capitalization rate yields 17.3% to an investor using leverage.

Internal Rate of Return

Current cashflows are not the only ways investors profit from real estate. The housing bubble was characterized by an overly exuberant opinion of future appreciation, and I have consistently decried considering appreciation as a reason to buy real estate in direct response to the foolishness of bubble-buyer attitudes. However, real estate can and does appreciate, and resale at a higher price in the future does have value. The best way to calculate this value is through a discounted cashflow analysis. When examining the rate of return of real estate, the internal rate of return is the best method available.

I won't attempt to walk anyone through the math of the internal rate of return calculation. Like everyone else in finance, I use a spreadsheet to calculate it for me. The concept of internal rate of return is not nearly as difficult to understand as the math used to calculate it.

Imagine you are buying a house for $123,000 you believe will be worth $215,000 10 years from now. What is the current value of the $93,000 profit you will obtain in 10 years? It depends on the interest rate. That calculation is what finance people call net present value.

Now Imagine you could put $123,000 in a bank account earning a high interest rate (I know you can't today, but just imagine). What interest rate would be required to have your $123,000 grow into $215,000 at the end of 10 years? That interest rate would be like the internal rate of return on the property that increased in value by the same amount over the same period.

Internal rate of return considers more than just the lump sum at the end. Internal rate of return compares the amount and timing of all the cash inflows and compares it to the initial investment amount to compute an overall rate of return on the investment. Internal rate of return is the most accurate measure of the financial performance of real estate.

A Las Vegas investment property

The property below is an property offered by the investment fund I manage. The second presentation on September 12 will focus on how investors can get involved with cashflow properties in Las Vegas. One of these methods is direct ownership and management of rental properties such as the one below.

Most properties in Las Vegas are trading below rental parity, even in the nicest neighborhoods in Summerlin. If you invest in areas outside of the ones most desired by owner occupants, the prices fall off quickly, but the rents do not. This creates opportunity to pick up properties with outstanding current cashflow and potential for rebound appreciation to rental parity many years from now.

The first page of the report shows the asking price and the rate of return as an unleveraged investment. This is followed with a detailed look at the returns on a financed purchase. Many properties in Las Vegas generate such good cashflow they can cover the payment on a 15-year mortgage.

The second page of the report gives greater detail on the cost of ownership. It provides a list of comparable resales and rentals to verify current value.

The third page examines the current valuation relative to rental parity, and it considers the possibility of rebound appreciation over 10 years taking prices back to rental parity (nowhere near the peak, but to where prices should be). Assumptions on appreciation impact the internal rate of return, but not the current cashflow. If you don't believe Las Vegas housing prices will ever recover, it will not impact the cash returns you receive while owning the property.

The final chart is a graphical representation of the thousands of scenarios you can run to test different financing terms. If you develop your own spreadsheet and go through the exercise, you will find lower interest rates increase returns, and lower down payments increase returns — assuming the interest rate is lower than the cap rate.

Nicer and newer properties typically don't provide the best cashflow. The property above is an 1814 SF 4/2 built in 2003. Owner occupants have kept these prices up to where cap rates are near 8%. An 8% cap rate is unheard of in Orange County, except perhaps for undesirable properties in Santa Ana, but 8% cap rates are quite common in Las Vegas.

If you are willing to own a smaller, older property in a less desirable but not bad neighborhood, the returns in Las Vegas are truly outstanding.

If you are interested in learning more about rental parity analysis and investing in cashflow properties, I suggest you come to the presentations on September 12. I will be available before and after the presentations to answer any questions you might have.

It didn't go up enough to Ponzi the payments

The former owners of today's featured property paid $534,000 on 9/26/2003. They used a $421,900 first mortgage, a $79,000 second mortgage, and a $33,100 down payment. They withdrew their down payment about 5 months later when they refinanced with a $555,000 first mortgage. They also got $21,000 in HELOC booty to go with their down payment. The refinanced again on 4/29/2004 for $563,000 and obtained another $8,000. They were foreclosed on 7/22/2011 with a balance due of $652,500.

Apparently the bank hasn't gotten the memo about prices being back at 2003 levels. Like a delusional seller of the post-bubble era, they have priced this property to get everything they are owed on the deal after commissions. Good luck with that.

——————————————————————————————————————————————-

This property is available for sale via the MLS.

Please contact Shevy Akason, #01836707

949.769.1599

sales@idealhomebrokers.com

Irvine House Address … 214 TUBEROSE Irvine, CA 92603

Resale House Price …… $704,900

Beds: 4

Baths: 3

Sq. Ft.: 2100

$336/SF

Property Type: Residential, Condominium

Style: Two Level, Contemporary

Year Built: 2003

Community: Quail Hill

County: Orange

MLS#: S671457

Source: SoCalMLS

Status: Active

On Redfin: 1 day

——————————————————————————

Excellent corner location in Solstice – Quail Hill. Two story home with one bed/bath downstairs. Numberous highlights including custom neutral paint and carpet. Granite countertops in kitchen, walk in pantry, light, bright and open floor plan. .. Upstairs has large loft and balcony as well as upstairs laundry room. One of top school districts in the state.

——————————————————————————————————————————————-

Proprietary IHB commentary and analysis

Numberous?

Resale Home Price …… $704,900

House Purchase Price … $534,000

House Purchase Date …. 9/26/2003

Net Gain (Loss) ………. $128,606

Percent Change ………. 24.1%

Annual Appreciation … 3.5%

Cost of Home Ownership

————————————————-

$704,900 ………. Asking Price

$140,980 ………. 20% Down Conventional

4.19% …………… Mortgage Interest Rate

$563,920 ………. 30-Year Mortgage

$152,599 ………. Income Requirement

$2,754 ………. Monthly Mortgage Payment

$611 ………. Property Tax (@1.04%)

$200 ………. Special Taxes and Levies (Mello Roos)

$147 ………. Homeowners Insurance (@ 0.25%)

$0 ………. Private Mortgage Insurance

$230 ………. Homeowners Association Fees

============================================

$3,942 ………. Monthly Cash Outlays

-$645 ………. Tax Savings (% of Interest and Property Tax)

-$785 ………. Equity Hidden in Payment (Amortization)

$211 ………. Lost Income to Down Payment (net of taxes)

$108 ………. Maintenance and Replacement Reserves

============================================

$2,831 ………. Monthly Cost of Ownership

Cash Acquisition Demands

——————————————————————————

$7,049 ………. Furnishing and Move In @1%

$7,049 ………. Closing Costs @1%

$5,639 ………… Interest Points @1% of Loan

$140,980 ………. Down Payment

============================================

$160,717 ………. Total Cash Costs

$43,300 ………… Emergency Cash Reserves

============================================

$204,017 ………. Total Savings Needed

——————————————————————————————————————————————————-

The real state of Irvine and Orange County real estate

Irvine Home Address … 30 ROCKROSE Way Irvine, CA 92612

Resale Home Price …… $475,000

And so I cry sometimes when I'm lying in bed

Just to get it all out, what's in my head

And I, I'm feeling a little peculiar

And so I wake in the morning and I step

Outside and I take deep breath

And I get real high

And I scream to the top of my lungs

What's goin' on?

4 Non Blondes — What's Up

Throughout my posts on the IHB, I make references to what I believe is happening in our local housing market. The IHB serves as a valuable market resource to people considering buying Irvine and Orange County real estate. The message for the first nearly 5 years has been simple: don't buy a home yet. Over the last couple of years as the plethora of market props have been removed, the message has evolved to the more nuanced advice: buy below rental parity if you have a long holding time. That advice will remain our mantra over the next few years until conditions in the market change.

Why are you afraid to buy?

If you have been reading the IHB regularly, you have a rational fear to buy local real estate. Prices are falling. Prices will continue to fall for a while.

People who buy today might be trapped underwater and unable to sell their homes without taking a significant loss. Further today's buyers may miss the opportunity to buy later at a lower price. These are not foolish fears, they are legitimate reasons to delay the purchase of a home anywhere in Orange County.

Why will prices keep falling?

There are five primary factors which will impact the balance of supply and demand in our local market:

  1. High mortgage delinquency rates translates to a large shadow inventory (supply).
  2. Large REO inventory of lender owned properties withheld from the market (supply).
  3. High unemployment has diminished the buyer pool (demand).
  4. Weak California economy has diminished employment and wage growth (demand).
  5. Higher future interest rates will lower aggregate loan balances (demand).

Each of the above factors will contribute to either increased supply or reduced demand. The existence of these factors is not conjecture. They are very real. The way each of them impacts the market is uncertain, but each of them will serve to pressure prices lower over the next several years.

What will cause prices to eventually go up?

Kool aid and the memories of the rewards of the housing bubble are part of our culture. There will always be plenty of desire for California real estate. Even as prices have fallen steadily for the last 5 years, hope springs eternal, every buyer believes they are buying at the bottom, and most believe unlimited wealth and HELOC spending money is just around the corner.

There are several factors beyond kool aid intoxication which will serve to reverse the fall of prices and cause real estate prices to rise again:

  1. Current interest rates are very low.
  2. Payment affordability is relatively high.
  3. The economy and the employment situation will improve.
  4. Supply pressures will abate.

Even neighborhoods which have not historically traded below rental parity are trading below their historic level of payment affordability. On a payment basis, prices in many neighborhoods are similar to what they were in the late 90s and early 00s before the bubble mania took over.

The California economy has been sputtering as it weans itself off the Ponzi borrowing money of the 00s. The transition has been difficult and painful which is why the economy is still so weak. A significant portion of the false demand of the 00s will never return.

When the economy and employment finally picks up, wages will increase, and new households will form. The higher wages will increase the amounts borrowed, and the new households will increase the numbers of loans demanded. Both factors are essential to a housing market recovery.

At some point, the overhead supply of shadow inventory and visible REO inventory will be liquidated. This will likely take several years as lenders sell into any price rallies to recover their capital. There are many ways this could play out.

Lenders hope consistently rising prices will allow them to sell their inventory for the prices they want, and this liquidation will be easily absorbed by the market. I think that scenario is wishful thinking by lenders. The inventories are simply too large for it to work out that way. If lenders can hold their REO indefinitely, they can meter out this inventory over the next decade or more, but I doubt all the banks will be that patient.

As some lenders hasten their liquidations (like the GSEs are now), the resulting sales will push prices lower. As lenders capitulate one-by-one, the collapsing cartel causes brief seasonal rallies followed by deep seasonal drops. This yearly cycle will see consistent year-over-year declines similar to what has occurred in 2011. I believe this is the most likely scenario.

Declines in the liquidation phase of a bubble are not as steep as the first phase when the credit crunch forces lenders to abruptly decrease loan balances, but as was demonstrated in Japan, the liquidation phase results in slow but steady declines in prices until the inventory is purged from the system. Let's hope our liquidation phase is not as protracted as Japan's.

What will the bottom look like?

The double dip will be the final decline, and I don't believe it will be that severe (expect perhaps at the high end). That being said, the bottom will be difficult to time. First, it's impossible to predict what foolish policies may emanate from Washington. With our current state of gridlock, I have some hope that nothing substantive will emerge from the bowels of government. Any government policy would likely have the effect of delaying the market bottom.

Housing markets nearly always exhibit a seasonal pattern of spring rallies and fall pullbacks with the low for the year in early January. This seasonal pattern will continue, but the spring rallies will be weaker, and the fall pullbacks will be more pronounced. The inventory is often reduced in fall in winter, but the sellers who remain are usually more motivated as many of them missed the prime selling season.

Due to the overhanging inventory, this seasonal pattern with a slightly lower bias will persist for 3 to 5 years. The two or three years following will show the same pattern but with a slightly upward bias. The bottom will form slowly for the reasons listed previously: inventory overhand, rising interest rates, persistent unemployment, and prudent lending standards.

Buyers should not feel a sense of urgency from the fear of being priced out. The window of opportunity will be open for years to buy during this liquidation-bottoming phase.

Get the latest news on the Irvine and OC housing markets

On the second Monday of each month, I will deliver a presentation on the current state of the housing market. Monday September 12, 2011, will be the first of these presentations.

Presentation nights will be busy for me, but we want them to be entertaining and informative for you. The proceedings will start at 5:00 with a registration happy hour. If you want to come out to meet Shevy and I informally and talk real estate or simply meet with other IHB readers, you are invited to show up at 5:00 and have a drink with us.

At 6:00 I will gather everyone together in the Brewmaster room at the back of JT Schmids for the presentation on the OC housing markets. It will be an expanded version of the post above plus the most recent monthly data from August. Each month, the presentation will have the latest monthly data, so even if you have seen the presentation once, it will always be fresh.

Later that evening, I will be giving a presentation on investing in cashflow properties in Las Vegas. More on that in an upcoming post.

Everyone is invited to come up for the happy hour, the OC housing market presentation, and the cashflow property presentation. You may come and go as you please selecting only those events you wish to see.

On August 24th, the first-time homebuyer presentation was attended by 29 interested readers. One of the attendees had this to say in the comments:

Astute Observation by Pascal

2011-08-24 09:29 PM

I just attended this, though I’m already familiar with the home buying process.

It was great, and I highly encourage anyone who was reluctant to go this time for whatever reason, to attend the next one.

And there will be free cookies.

Actually, there will be free drinks and appetizers this time around. I hope to see you on September 12.

Cleaning up after the Ponzis

The next few years in local real estate will be cleaning up the mess created by lax lending standards and the Ponzis who took advantage of it. Today's featured REO is a typical example of the properties which will make up a third or more of our resale market for the foreseeable future.

  • The previous owners paid $270,000 on 4/12/2000. They used a $242,730 first mortgage and a $27,270 first mortgage. About a year and a half later, they began periodic mortgage withdrawals to supplement their income.
  • On 1/23/2002 they refinanced with a $257,000 first mortgage.
  • On 7/23/2003 they refinanced with a $259,000 first mortgage.
  • On 1/12/2004 they obtained a $180,000 HELOC.
  • On 5/27/2005 they got a $242,000 HELOC.
  • On 9/24/2008 the wife obtains a $444,500 first mortgage and a $40,000 HELOC in her name.
  • She quit paying in late 2009 and was foreclosed on in November of 2010.

Foreclosure Record

Recording Date: 07/07/2010

Document Type: Notice of Sale

Foreclosure Record

Recording Date: 04/02/2010

Document Type: Notice of Default

For each one of these we see, there are dozens hiding on lender balance sheets and in shadow inventory. These properties must eventually be liquidated, and as they are, any meaningful appreciation will be elusive.

——————————————————————————————————————————————-

This property is available for sale via the MLS.

Please contact Shevy Akason, #01836707

949.769.1599

sales@idealhomebrokers.com

Irvine House Address … 30 ROCKROSE Way Irvine, CA 92612

Resale House Price …… $475,000

Beds: 4

Baths: 2

Sq. Ft.: 2130

$223/SF

Property Type: Residential, Single Family

Style: Two Level, Traditional

Year Built: 1966

Community: University Park

County: Orange

MLS#: P788492

Source: SoCalMLS

Status: Active

On Redfin: 48 days

——————————————————————————

GREAT IRVINE HOME. FLOOR PLAN IS OPEN AND SPACIOUS AND HAS SO MUCH TO OFFER. MASTER RETREAT. MIRRORED CLOSE DOORS. FABULOUS KITCHEN WITH TILED COUNTERTOPS AND BACKSPLASH. RECESSED LIGHTS. 2 CAR ATTACHED GARAGE. PRIVATE BACKYARD. LOTS OF STORAGE SPACE. THIS IS A MUST SEE.

——————————————————————————————————————————————-

Proprietary IHB commentary and analysis

Resale Home Price …… $475,000

House Purchase Price … $270,000

House Purchase Date …. 4/12/2000

Net Gain (Loss) ………. $176,500

Percent Change ………. 65.4%

Annual Appreciation … 4.9%

Cost of Home Ownership

————————————————-

$475,000 ………. Asking Price

$16,625 ………. 3.5% Down FHA Financing

4.19% …………… Mortgage Interest Rate

$458,375 ………. 30-Year Mortgage

$133,611 ………. Income Requirement

$2,239 ………. Monthly Mortgage Payment

$412 ………. Property Tax (@1.04%)

$0 ………. Special Taxes and Levies (Mello Roos)

$99 ………. Homeowners Insurance (@ 0.25%)

$527 ………. Private Mortgage Insurance

$175 ………. Homeowners Association Fees

============================================

$3,452 ………. Monthly Cash Outlays

-$352 ………. Tax Savings (% of Interest and Property Tax)

-$638 ………. Equity Hidden in Payment (Amortization)

$25 ………. Lost Income to Down Payment (net of taxes)

$79 ………. Maintenance and Replacement Reserves

============================================

$2,565 ………. Monthly Cost of Ownership

Cash Acquisition Demands

——————————————————————————

$4,750 ………. Furnishing and Move In @1%

$4,750 ………. Closing Costs @1%

$4,584 ………… Interest Points @1% of Loan

$16,625 ………. Down Payment

============================================

$30,709 ………. Total Cash Costs

$39,300 ………… Emergency Cash Reserves

============================================

$70,009 ………. Total Savings Needed

——————————————————————————————————————————————————-

2009 bear rally knife catchers consistently overprice their homes

Bear rally buyers are in denial. When selling their homes, they consistently price over the market and far higher than bubble era buyers who have capitulated.

Irvine Home Address … 41 SMALL Grv Irvine, CA 92618

Resale Home Price …… $1,550,000

Why bother? it's gonna hurt me

It's gonna kill when you desert me

This happened to me twice before

It won't happen to me anymore

Weezer — Why Bother

Home prices in California are notoriously volatile. Stoked by their realtor's advice and enabled by foolish lenders, buyers get motivated by greed and fear to bid prices up to the stratosphere. When the inevitable crash occurs, everyone is surprised. Many people believe trees really can grow to the sky.

The psychological stages of loss are the same for all bubble buyers. Most people buy because they believe prices are going up. This was particularly true for bubble buyers, but bear rally buyers from 2009 fell victim to the same faulty thinking.

The buyers from 2004-2006 have already gone through denial and fear, and most have capitulated and either let the property go to foreclosure or sold short. Bear rally buyers are still in the initial stages. They believe they bought at the bottom, so the are still in the denial stage we watched most bubble buyers go through in 2007. The most obvious indicator of denial is the initial asking price of a bear rally knife catcher. According to a study by Zillow, buyers from the bear rally consistently overprice their properties.

Sellers Who Bought Post-Bubble More Likely to Over-Price Home

July 14th, 2011

Imagine two identical houses built in the same year in the same neighborhood. House A was last purchased in 2006 and House B in 2008. House A is listed at its estimated fair market value of $300,000. Although it would be logical to assume that House B would list with a similar asking price, new research shows that it would, in fact, list at $350,000 on average, a $50k premium! Why the 16 percent price difference?

Because bear rally buyers are still in denial. It's the only explanation which is consistent with what we know about human behavior.

An analysis of seller behavior reveals that homeowners who bought after the peak of the national market in June 2006 dramatically over-price their homes relative to its estimated market value. In a separate survey fielded by Zillow, 17 percent of sellers who purchased post-bubble claim that their primary factor in pricing their house is their original purchase price. This compares with 9 percent who bought during the run-up to the bubble and 4 percent who bought before that.

It's human nature to price a property at break even and see what happens. Just like winning the lottery, a wouldbe seller might get lucky and find a foolish buyer who is willing to overpay.

In the chart below, the blue line is showing the difference between the current list price and the estimated market value of the home with the year the house was last sold running along the X axis. The green line represents the difference between the current list price and the prior purchase price. Notice in the green line that current sellers that purchased their home since 2009 have been pricing their house at 10% higher than what they purchased it for just 1-2 years ago. This is in spite of the fact that over the last two years the national real estate market has depreciated by 10 percent. This difference is represented in the blue line which shows that sellers who bought during this period are pricing around 20% above market rate. Not only are these sellers ignoring the losses they have taken since purchase, but they’re trying to claw back all of their closing costs too it seems!

Obviously the idea that your largest asset has been devalued significantly is difficult to accept, however, people who bought in the run-up to the bubble are seemingly more willing to confront this reality than those who purchased after the peak.

The further along the seller is in the process of accepting their loss, the more likely they are to price their property to sell. Selling for whatever one can get is the essence of capitulation.

In fact, relative to sellers who purchased their home before 2002, those who bought while the bubble was expanding rapidly are comparatively underpriced. When first placed on the market, the typical house is priced at roughly 10 percent above its estimated market value, but sellers from 2006 touch as low as 6.4 percent. Looking at sellers who bought on either side of the market peak nationally reveals stark differences between these two groups. Sellers who bought in January 2006 overprice their home by only 8 percent, while those who bought in January 2009 overprice by 22 percent.

Many keystrokes have been devoted to the downward stickiness of prices. Fortunately, the bear rally buyers bought closer to the bottom than to the top, and most of them used conservative conventional financing because it was the only financing available at the time. These people will still be trapped in their homes for years, but they should be able to afford the payments.

Sellers who bought post-bubble seem to think that since their home purchase occurred after the peak of the market, and thus home values were already significantly discounted relative to the peak, the seller escaped the worst of the bubble. The problem is that “The Bubble” didn’t pop so much as steadily deflate for the better part of 5 years now, and current home values now represent what they were worth in 2003.

Said differently, assuming your market followed the national trend, unless you bought your house before 2003, you should be selling it at a loss now. The closer to 2006-2007 you bought, the bigger that loss should be.

This fact is why I felt such a sense of urgency to write for the IHB. I started in February of 2007 and tried to warn everyone that the market was on the edge of a major fall. Those who listened to me are not trapped in an underwater home right now. Those who didn't….

We know there are a million numbers to keep in your head when looking at a potential property, and that by no means does every property purchased in 2008-2010 is dramatically overpriced. However, I humbly suggest that when looking at properties, you keep one more very important, and very simple, statistic in mind: Previous Year of Purchase.

Methodology:

Zillow’s analysis was done by taking one million currently for sale homes with prior sale data since 1999 and looking at the difference between the current list price and the previous sale price. We then compared the change in the Zillow Home Value Index of that property’s zip code from when it was previously sold to now. These data were grouped by month and the median value, as well as the median difference between the two metrics, was then calculated. The resulting graph and data as well as the survey information yielded the above conclusions

The takeaway from this article is when negotiating to buy a house as we enter this bottoming phase, be wary of bear rally sellers. They will not be as motivated, so they will be less likely to lower price to make a deal happen. It's the bubble buyers who have capitulated that you should be looking for.

An Irvine bear rally buyer-seller

Portola Springs has become the forgotten village. Built at the peak, all homeowners there have properties worth less than they paid, and the Irvine Company seems in no hurry to build this community out. The seller of today's featured property paid $1,362,500 on 11/14/2008, and now he believes the property has appreciated 15%. Since this property has actually declined in value, this asking price is consistent with the Zillow study referenced above which noted sellers who bought since 2006 tend to overprice their homes by 22%.

——————————————————————————————————————————————

This property is available for sale via the MLS.

Please contact Shevy Akason, #01836707

949.769.1599

sales@idealhomebrokers.com

Irvine House Address … 41 SMALL Grv Irvine, CA 92618

Resale House Price …… $1,550,000

Beds: 3

Baths: 4

Sq. Ft.: 3577

$433/SF

Property Type: Residential, Single Family

Style: Two Level, Tuscan

View: Catalina, Coastline

Year Built: 2008

Community: Portola Springs

County: Orange

MLS#: S664038

Source: SoCalMLS

On Redfin: 67 days

——————————————————————————

Modern Luxury and Prime Location with Panoramic Views. Irvine's prestigious Portola Springs absolute best lot. Unique 180 degree views to the coast and Catalina. Set up as 3 bedroom but can easily be made 4 or 5 bedroom. 3577 sq ft of feature-laden luxury in this 3 year old extensively upgraded home. Six figures in upgrades put into the house. Knotted wood floor, downstairs resort-like master suite with room-sized closet. Laundry rooms upstairs and down. Huge kitchen/family area, relaxing atrium, security system, cat 5 wiring with 7 outlets. Teen/Bonus room upstairs with 2 bedrooms and bathrooms. Kitchen has large range, built-in fridge and a huge island for entertaining. Energy-efficient lights. Back yard has amazing panoramic views impossible to match in the area. Built in Bar-B-Q, and elec retractable awning for hot summer days. This really is luxury with prime location. Superb Irvine School District. Community Jnr Olympic pool, 18 N'hood parks, Basketball Ct, community cntr.

——————————————————————————————————————————————-

Proprietary IHB commentary and analysis

Resale Home Price …… $1,550,000

House Purchase Price … $1,362,500

House Purchase Date …. 11/14/2008

Net Gain (Loss) ………. $94,500

Percent Change ………. 6.9%

Annual Appreciation … 4.6%

Cost of Home Ownership

————————————————-

$1,550,000 ………. Asking Price

$310,000 ………. 20% Down Conventional

4.19% …………… Mortgage Interest Rate

$1,240,000 ………. 30-Year Mortgage

$322,135 ………. Income Requirement

$6,057 ………. Monthly Mortgage Payment

$1343 ………. Property Tax (@1.04%)

$450 ………. Special Taxes and Levies (Mello Roos)

$323 ………. Homeowners Insurance (@ 0.25%)

$0 ………. Private Mortgage Insurance

$149 ………. Homeowners Association Fees

============================================

$8,322 ………. Monthly Cash Outlays

-$1354 ………. Tax Savings (% of Interest and Property Tax)

-$1727 ………. Equity Hidden in Payment (Amortization)

$463 ………. Lost Income to Down Payment (net of taxes)

$214 ………. Maintenance and Replacement Reserves

============================================

$5,918 ………. Monthly Cost of Ownership

Cash Acquisition Demands

——————————————————————————

$15,500 ………. Furnishing and Move In @1%

$15,500 ………. Closing Costs @1%

$12,400 ………… Interest Points @1% of Loan

$310,000 ………. Down Payment

============================================

$353,400 ………. Total Cash Costs

$90,700 ………… Emergency Cash Reserves

============================================

$444,100 ………. Total Savings Needed

——————————————————————————————————————————————————-

Government's expensive idea to reward imprudent borrowing

Washington is recycling a dumb idea from 2008 to reduce the interest rate on underwater loan owners. It's an expensive plan that rewards imprudent borrowing.

Irvine Home Address … 9 GERANIUM Irvine, CA 92618

Resale Home Price …… $416,900

everybody in town was nowhere to be seen

so I parked near a house that was marked thirteen

I went up to the door, but there was no one there

I had an eerie feeling in my very bones

and soon it started to rain, and there was no way out

maybe this was a bad idea

oh no

maybe this was a bad idea

oh no

Lemon Demon — Bad Idea

Government intervention in financial markets is typically a bad idea. The usual result is to shift the consequences (losses) from those who deserve to bear the brunt of their mistakes — in this case lenders and borrowers — on to those who don't deserve to pay a price — in this case renters and ordinary taxpayers. What compelling reason is there to force renters who did not participate in the bubble mania to pay the bills?

The people who benefit from this ripoff will justify their actions by claiming it was necessary to save the broader economy. We need stimulus, right? Perhaps we do, but creating stimulus by giving money to the least deserving isn't my idea of good public policy.

U.S. May Back Refinance Plan for Mortgages

By SHAILA DEWAN and LOUISE STORY

Published: August 24, 2011

The Obama administration is considering further actions to strengthen the housing market, but the bar is high: plans must help a broad swath of homeowners, stimulate the economy and cost next to nothing.

The proposed plan will only help the most indebted (least prudent) borrowers. It wil stimulate the economy, but it will be very costly.

One proposal would allow millions of homeowners with government-backed mortgages to refinance them at today’s lower interest rates, about 4 percent, according to two people briefed on the administration’s discussions who asked not to be identified because they were not allowed to talk about the information.

A wave of refinancing could be a strong stimulus to the economy, because it would lower consumers’ mortgage bills right away and allow them to spend elsewhere.

This would be a good thing for the economy; however, the same result happens if the house is foreclosed on and resold at a lower price to a less indebted borrower. In fact, since the debt is even lower, the economic stimulus is much greater. The government solution helps banks keep their bad debts alive.

The foreclosure solution is obviously superior. The reduced debt and associated debt service would be a larger stimulus, and banks will endure more of the losses they deserve.

But such a sweeping change could face opposition from the regulator who oversees Fannie Mae and Freddie Mac, and from investors in government-backed mortgage bonds.

You think? The cost of this proposal is absorbed entirely by investors in the GSEs which is mostly the US government. This is a tax subsidy to irresponsible loan owners intended to benefit banks who are even less deserving of assistance. That meets my definition of a lose-lose transaction.

Administration officials said on Wednesday that they were weighing a range of proposals, including changes to its previous refinancing programs to increase the number of homeowners taking part. They are also working on a home rental program that would try to shore up housing prices by preventing hundreds of thousands of foreclosed homes from flooding the market. That program is further along — the administration requested ideas for execution from the private sector earlier this month.

The REO rental program is an even worse idea. It delays clearing the market, and makes the government one of the biggest landlords in the country. Government owned housing is typically among the worst managed in the country, and the large projects they already mismanage are easier to manage than hundreds of thousands of individual homes. There is no reason to believe the government could manage this portfolio successfully.

But refinancing could have far greater breadth, saving homeowners, by one estimate, $85 billion a year.

That $85 billion in savings they are touting will be added to the billions of losses the government has already covered since taking over the GSEs. This is not a low-cost program. That $85 billion in revenue would have helped offset losses at the GSEs. Instead it will go to benefit banks and loan owners. That isn't the way I want my tax dollars squandered.

Despite record low interest rates, many homeowners have been unable to refinance their loans either because they owe more than their houses are now worth or because their credit is tarnished.

Exactly how a refinancing plan might work is still under discussion. It is unclear, for example, whether people who are delinquent on their mortgages would be eligible or whether lenders would administer it. Federal officials have consistently overestimated the number of households that would be helped by their various housing assistance programs.

Why would we give this benefit to delinquent mortgage squatters? I find the idea outrageous.

A working group of housing experts across several federal agencies could recommend one or both proposals, or come up with new ones. Or it might decide to do nothing.

We can only hope they decide to do nothing as they did in 2008.

Investors may suspect a plan is in the works. Fannie and Freddie mortgage bonds had been trading well above their face value because so few people were refinancing, keeping returns on the bonds high. But those bond prices dropped sharply this week.

Nobody wants to be left holding the bag.

Administration discussions about housing proposals have taken on added urgency this summer because the housing market is continuing to deteriorate. On Wednesday, the government said that prices of homes with government-backed mortgages fell 5.9 percent in the second quarter from a year earlier, the biggest decline since 2009. More than one in five homeowners with mortgages owe more than their homes are worth. Some analysts are now predicting waves of foreclosures and a continuing slide in home prices.

Strategic default will be an epidemic caused by the double dip. The 2009 rally gave false hope to many debtors, but as denial turns to acceptance as prices continue to fall, loan owners will give up and walk away from their mortgages. Strategic default has become common and accepted in 2011, and now with more reason to strategically default, many more borrowers will chose to do so.

There is not much time to help the market before the 2012 election, and given Congressional resistance to other types of stimulus, housing may be the only economic fix in reach. Federal programs to assist homeowners have been regarded as ineffective so far, and they are complex.

“We are looking at trying to encourage more participation in all of the programs, including those that help with refinancing,” said Phyllis Caldwell, who oversees housing policy at the Treasury Department.

I am afraid the desire to do something prior to the elections will prompt some stupid actions by the Obama administration. Fortunately, anything requiring congressional approval will be a non-starter.

Some economists say that with housing prices and interest rates at affordable levels, only fear is keeping consumers out of the market. Frank E. Nothaft, the chief economist at Freddie Mac, said the federal action could instill confidence.

It almost seems to me you want to have some type of announcement or policy, program or something from the federal government that provides that clear signal that we are here supporting the housing market and this is indeed a good time to really consider buying,” Mr. Nothaft said.

The chief economist of Freddie Mac has revealed himself a fool. The government does not need to send a clear signal they are supporting the housing market. Any such signal will be recognized by intellegent buyers as a red flag indicating it's a poor time to buy.

Buyers will ask questions. Why does the market need supporting? What happens when the supports are removed? We just went through this in 2010 with the tax subsidies, and when the supports were removed, prices fell again. Why would the next support efforts be any different? Mr. Nothaft has clearly not carefully considered what would happen if his proposals were implemented.

The refinancing idea has been around since at least 2008, but proponents say the recent drop in interest rates to below 4 percent may breathe new life into the plan.

This is the best stimulus out there because it doesn’t increase the deficit, it accomplishes monetary policy, and it reduces defaults in housing,” said Christopher J. Mayer, an economist at the Columbia Business School.

Another economist has revealed himself a fool. If the program is going to save $85 billion dollars, and if the government is directly backing the entity absorbing these losses, that will directly increase the deficit. There is no free lunch.

“So I think this is low-hanging fruit.” Mr. Mayer and a colleague, Glenn Hubbard, who was chairman of the Council of Economic Advisers under President George W. Bush, proposed an early version of the plan.

The idea is appealing because it would not necessarily require Congressional action. It also would not tap any of the $45.6 billion in Troubled Asset Relief Funds that was set aside to help struggling homeowners. Only $22.9 billion of that pool has been spent or pledged so far, and fewer than 1.7 million loans have been modified under federal programs. But Andrea Risotto, a Treasury spokeswoman, said whatever was left would be used to reduce the federal deficit.

This proposal is appealing to the administration because they know it would never get through congress. Further, they get to bury the cost in the black hole of losses at the GSEs. When the GSE bailouts get larger, they will feign surprise and blame it on something other than this stupid policy which exacerbated the losses.

A mass refinancing plan would spread the benefits of the Federal Reserve’s most important economic policy response, low interest rates, to more people. As of July, an estimated $2.4 trillion in mortgages backed by Fannie and Freddie carried interest rates of 4.5 percent or higher.

The two prevailing ideas, lowering rates on mortgages and converting houses owned by government entities like Freddie and Fannie into rentals and other uses, have somewhat different pockets of support. Investment firms would like to participate in the rental program, especially if the government lends them money to participate.

If the government is going to give out cheap debt to finance private-sector firms to take over their rentals, I want in. The idea sounds like a crony capitalist handout to me.

For the most part, banks prefer the refinancing plan.

No kidding? Banks get to keep bad debts alive and delay the inevitable write downs. Of course they want that.

There are many high-ranking proponents of the refinancing plan. Joseph Tracy, a senior adviser to the chairman of the New York Federal Reserve, has circulated a presentation in support of the plan. And Richard B. Berner, who recently joined the Treasury Department as counselor to Secretary Timothy F. Geithner, argued in favor of a blanket refinancing in his previous job as chief United States economist for Morgan Stanley. The proponents say the plan carries little risk because the mortgages are already guaranteed by Fannie Mae and Freddie Mac.

Little risk? It will directly add to the losses at the GSEs. I suppose there is little risk as risk implies uncertainty about the future. This program will certainly produce large losses at the GSEs. It don't think that semantic difference is what they were trying to sell to policymakers.

They also say it makes those loans less likely to go into default and ultimately foreclosure.

But the plan has some drawbacks. Some officials fear that promoting mass refinancings today could spook investors and make borrowing more expensive, for both homeowners and the federal government, in the future.

I don't know if that concern is legitimate. It reads like the reporters failed to identify the real objections: (1) increasing the GSE losses and the federal deficit and (2) rewarding the least prudent borrowers in the borrower pool, so they came up with some objection to make their reporting seem balanced.

The government has already encouraged some refinancing through the Federal Housing Administration and through Fannie and Freddie, but participation is limited. For example, the Home Affordable Refinance Program excludes homeowners who owe more than 125 percent of the value of their house. To spur more refinancing, the government may decide to encourage Fannie and Freddie to lift such restrictions.

But government officials cautioned that Fannie and Freddie do not do the administration’s bidding, even though they are essentially owned by taxpayers.

This is nonsense. The GSEs are under direct control of the federal government. They are allowed to maintain the illusion of independence so if they have to do something unpopular, politicians can blame the GSEs and deflect blame from themselves.

Edward J. DeMarco, who oversees the companies as acting director of the Federal Housing Finance Agency, has voiced concerns about any plan that might cost the companies money, according to the two people briefed on the discussions. “F.H.F.A. remains open to all ideas that provide needed assistance to borrowers” while minimizing the cost to taxpayers, Mr. DeMarco said in a written statement.

A broader criticism of a refinancing expansion is that it would not do enough to address the two main drivers of foreclosures: homes worth less than their mortgages, and a sudden loss of income, like unemployment. American homeowners currently owe some $700 billion more than their homes are worth.

That criticism is wrong on many levels. First, the basic premise that foreclosures should be reduced is wrong. Foreclosure are key to the financial recovery. If policymakers continue to define the problem incorrectly, they will continue to come up with solutions to the wrong problem which will inevitably create other problems.

Second, the implication is that prices must increase in order to “solve” the underwater borrower problem and government policy should be focused on that result. This is also wrong. Prices should be allowed to find their natural equilibrium at affordable levels. A stable housing market requires manageable debts requiring a reasonable percentage of a borrowers income. If borrowers become over-extended loan owners who can't sustain ownership, the market is not stable.

The winner, the loser, and the bagholder

Today's featured property was purchased in 2003 and sold in 2006. The owner who had the property for two and a half years during the bubble rally was a big winner. The peak buyer who bought in 2006 was a big loser, and the bank who financed the 2006 purchase ended up the bagholder.

This property was purchased on 9/26/2003 for $350,000. It was then sold on 3/23/2006 for $588,000. Two and a half years ownership provided a $238,000 profit. The bubble was very rewarding for those who sold at the peak — assuming they didn't plow that money into an even more expensive loser.

The owner who paid $588,000 used a $529,000 first mortgage and a $59,000 down payment. That money is now gone along with her good credit. Perhaps the more than two years of squatting provided some recoup of her loss.

Foreclosure Record

Recording Date: 10/12/2010

Document Type: Notice of Sale

Foreclosure Record

Recording Date: 09/04/2009

Document Type: Notice of Sale

Foreclosure Record

Recording Date: 05/11/2009

Document Type: Notice of Default

Let's see what lessons borrowers learned here. First, the owner for 2003 to 2006 was very rewarded, so he will be eager to do that again. Second, the borrower from 2006, although she lost her down payment, she still got more than two years of squatting which would have cost her almost as much in a rental. The consequences of that will not turn her off home ownership. Third, the bank probably sold the loan into a ABS pool, so they profited on the origination and servicing. The bank will be ready to do it again.

The only real loser was the investor. If the loan was part of an ABS pool backed by credit default swaps from AIG, then the government is absorbing that loss. If this loan was purchased by the GSEs — and they were big ABS purchasers at the peak — then the losses have fallen to them. The GSEs get to pass their losses on to the government, so no lessons are learned there either. The government… well, they never learn anything.

I conclude we will likely repeat this disaster based on the lessons learned.

——————————————————————————————————————————————-

This property is available for sale via the MLS.

Please contact Shevy Akason, #01836707

949.769.1599

sales@idealhomebrokers.com

Irvine House Address … 9 GERANIUM Irvine, CA 92618

Resale House Price …… $416,900

Beds: 2

Baths: 2

Sq. Ft.: 1350

$309/SF

Property Type: Residential, Condominium

Style: Two Level, Mediterranean

Year Built: 2001

Community: Oak Creek

County: Orange

MLS#: S660419

Source: SoCalMLS

Status: Active

On Redfin: 85 days

——————————————————————————

PRICE REDUCED! A MUST SEE!!Beautiful 2 Bdrm Townhome Virtually All On One Level Over 2-Car Garage With Upgrades Throughout Including Beautiful Hardwood Flooring, Plantation Shutters, Fireplace, Convenient Inside Laundry, Kitchen W/ Breakfast Bar, Built-in microwave & Handsome Wood cabinetry, Spacious Living And Dining Area With Large Private Balcony, Master Suite With Large Private Balcony, Just Steps To Resort-Style Amenities.

——————————————————————————————————————————————-

Proprietary IHB commentary and analysis

Resale Home Price …… $416,900

House Purchase Price … $588,000

House Purchase Date …. 3/23/2006

Net Gain (Loss) ………. ($196,114)

Percent Change ………. -33.4%

Annual Appreciation … -6.2%

Cost of Home Ownership

————————————————-

$416,900 ………. Asking Price

$14,592 ………. 3.5% Down FHA Financing

4.19% …………… Mortgage Interest Rate

$402,308 ………. 30-Year Mortgage

$124,213 ………. Income Requirement

$1,965 ………. Monthly Mortgage Payment

$361 ………. Property Tax (@1.04%)

$150 ………. Special Taxes and Levies (Mello Roos)

$87 ………. Homeowners Insurance (@ 0.25%)

$463 ………. Private Mortgage Insurance

$183 ………. Homeowners Association Fees

============================================

$3,209 ………. Monthly Cash Outlays

-$309 ………. Tax Savings (% of Interest and Property Tax)

-$560 ………. Equity Hidden in Payment (Amortization)

$22 ………. Lost Income to Down Payment (net of taxes)

$72 ………. Maintenance and Replacement Reserves

============================================

$2,433 ………. Monthly Cost of Ownership

Cash Acquisition Demands

——————————————————————————

$4,169 ………. Furnishing and Move In @1%

$4,169 ………. Closing Costs @1%

$4,023 ………… Interest Points @1% of Loan

$14,592 ………. Down Payment

============================================

$26,953 ………. Total Cash Costs

$37,300 ………… Emergency Cash Reserves

============================================

$64,253 ………. Total Savings Needed

——————————————————————————————————————————————————-