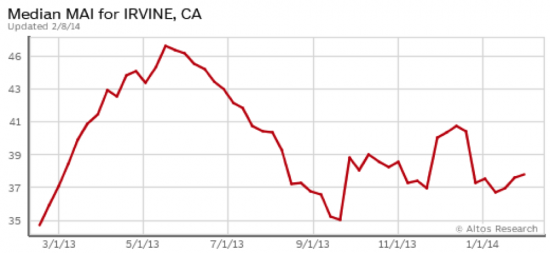
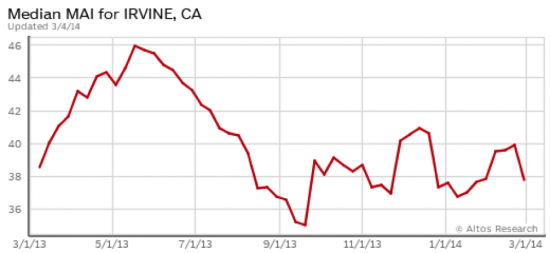
According to Altos Research, the Market Action Index (MAI) for Irvine’s single-family housing market was 37.75 on February 28. As defined by Altos, this puts the Irvine single-family housing market in the seller’s market category. (Above 30 is defined as a seller’s market; below is defined as a buyer’s market.) Altos also states that the average single-family home in Irvine has been on the market for about 108 days as of February 28, 2014.
Following is Irvine’s 2014 housing market data as provided by Redfin.
| Type | List Price/# Homes Listed | Sold Price/# Homes Sold | List Per SF | Sold Per SF | % Chg Y-O-Y Sold Price/SF |
| Houses | |||||
| 14-Feb | $1,090K/203 | $905K/57 | $451 | $420 | 10.50% |
| 14-Jan | $1,082K/170 | $832K/62 | $461 | $429 | 22.20% |
| Condos | |||||
| 14-Feb | $599K/248 | $560K/80 | $406 | $395 | 13.50% |
| 14-Jan | $603K/226 | $626K/58 | $406 | $392 | 20.60% |
| All | |||||
| 14-Feb | $745K/479 | $665K/145 | $421 | $400 | 10.50% |
| 14-Jan | $412K/422 | $688K/130 | $422 | $412 | 23.40% |