Which Irvine neighborhoods does the market consider the most desirable? Personal opinions aside, the market has spoken, and we have the results.
Irvine Home Address … 60 CEZANNE Irvine, CA 92603
Resale Home Price …… $2,100,000

You can be better than that
Don't let it get the better of you
What could be better than now
Life's not about what's better
John Butler Trio — Better Than
Which Irvine Village is the most desirable for single family homes?
Which Irvine Village is the best, and how could this be determined? Well, taking an opinion poll might be interesting, but it wouldn't be backed by anything substantial. To determine what people really believe about desirability, we have to look where people put their money. Money talks. The neighborhoods where people pay the most for real estate determines what is “best.”
Determining which neighborhood obtains the highest premiums is not easy. We couldn't simple look to the MLS or to past sales and see where the prices are highest because there can be many reasons people pay more in one neighborhood versus another. To accurately measure premium, we needed to normalize for other factors to distill a premium value not explainable by other factors.
In the first post in this series, An accurate view of the Irvine housing market by Global Decision and IHB, I introduced Jaysen Gilespie of Global Decision. “Jaysen Gillespie of Global Decision, an analytics and consulting firm that has worked in the real estate industry. He shares my interest in determining what is really going on in the real estate market. As a professional data analyst, he is trained in special techniques I cannot perform.” The first post was well recieved. Jaysen's skills with data analysis are remarkable, and I am thrilled he is working with me and the IHB to bring this information to the readership.
The following is the writing of Jaysen Gillespie. I have not set it off in block quote to make it easier to read.

A presentation by Jaysen Gillespie of Global Decision
info@globaldecision.com
Global Decision is an analytics consulting firm. While our methods are not industry-specific, our engagements are skewed towards specific industries in Southern California, such as real estate (along with online gaming and restaurant chains). We specialize in applying both foundational and advanced analytics to better understand business and economic issues.
Today’s post is part two of our series on hedonic housing valuation in Irvine. The goal of a hedonic housing valuation model is to use all information about a sale, including both the sale price and the characteristics of the home (number of beds, number of baths, square footage, etc.) to understand how the home’s value is derived from its constituent parts. Wikipedia offers a good overview of hedonic regression or see the Global Decision tutorial on how to build your own hedonic regression model.
What is a mathematical model?
A mathematical model is an abstraction of a real-world situation. Models help us understand how complex systems work by distilling them down to a manageable number of inputs, and they provide the ability to tinker with the model – and see how the system responds. In our case, the “system” under consideration is the Irvine, CA housing market. The hedonic model helps us do two things: first, it deepens our understanding of the drivers of housing demand. Second, it allows us to play with hypothetical scenarios and see what the impact would be on the value of a property.
How would someone in the “real world” use a hedonic housing model?
A fun aspect of building and using mathematical models is that you can perform experiments that would be physically or financially impossible in the real world. Because “neighborhood” or “area” is an input into the hedonic housing model, we could theoretically pick up a house from Woodbury and move it to Woodbridge (keeping all else equal) and see how the value of the property changes. For those engaged in building new homes, or developing a plan for a new neighborhood, an accurate hedonic housing model can be used to optimize revenue. If you know the incremental revenue you can obtain from an extra bedroom, an extra bathroom, or an extra 1000 sq. ft. of lot size, you can compare the costs of each option with the resulting expected increase in valuation and find the best bang-for-the-buck. It’s not an exact science, and I wouldn’t execute blindly based on just the results of a model. But a well-structured model can provide valuable insight and an unbiased view into the marketplace’s preferences.
How are neighborhoods modeled in the Irvine Hedonic Housing Model?
With Irvine it’s really a case of “the hits just keep on coming.” Not only do we have a background of glasslike consistency, especially in terms of education and safety, but we also have large, well-defined neighborhoods. Some locals refer to them as villages, though they have no governmental or political authority. Each village is similar, in that it was constructed in the same range of years, has access to many shared facilities, and generally sports a consistent look-and-feel throughout.
In regression models, there are generally two types of explanatory factors – continuous and categorical (discrete). Continuous factors can take on any value, or perhaps any integer value. Examples include the age of a property, the square footage, and the lot size. Categorical factors typically have either well-defined and finite possibilities or have a practical limit on their range. In theory the number of rooms in a home is continuous. You could construct a home with 700 of them. Unless you have the resources of Louis XIV, it’s probably not going to happen. So we’d consider the number of rooms in a home to be categorical for practical reasons.
If a categorical variable is numeric in nature, we can – at our option – use that number directly as an input into the underlying regression model. Treating a categorical numeric variable as a continuous variable makes sense when incrementing the factor by one has about the same impact. In our model, we treat the number of bedrooms and bathrooms as continuous, even though there is a finite range for these values.
An area designation, by contrast, can’t be directly fed into a regression model. It’s not numeric, and the model has no conceptual understanding of “Woodbridge” vs. “Oak Creek.” Fortunately, there are well-developed methods for handling these types of variables. The crux of the solution requires us to do two things: first, we must pick a baseline level for each category. In our example, we use “Northwood-Old” as our baseline area. After the regression is run, the baseline becomes the reference level against which others are measured. A good baseline contains a lot of data points and is preferably an area of average value.
Once we have a baseline level (Northwood-Old), we can model all other levels as extra variables in the regression. Continuing our example, we’d set up a variable called “Woodbridge.” Homes in Woodbridge get a “1” for that variable; others get a “0.” We benefit here from Irvine’s village system. Because villages are quite large, we need introduce only a small number of extra variables (16 in our case) into the regression model.
So what will the hedonic housing model tell me about neighborhoods?
The output of the hedonic model will tell the analyst how much more (or less) a home would be worth if that home were moved from the baseline area (Northwood-Old) to the area designated by each area variable. The virtual move from Northwood-Old to another neighborhood assumes all else is held constant. So if you start with a 3/2, 1600 sq.ft. home from 1977 in Northwood-Old and move it to Woodbridge, you’d gain (or lose) the dollar amount stipulated by the Woodbridge variable’s coefficient.
The model assumes all else holds constant. In reality, the model can only hold constant the factors that are directly input into the model. So if you use the model to move a home from Turtle Rock down to University Park, and you lose a city lights view in doing so, the model will revalue the home lower – but miss the fact that the view disappeared. Views, backing up to Culver, having Metrolink as your neighbor, or owning a strangely shaped lot are all examples of factors not in the model. In the future, it may be possible to add this type of data into the Irvine Hedonic Housing Model. A parcel map and GIS system would be able to determine if the property is located next to a major negative (I-405, for example).

The above chart represents the results of the Irvine Hedonic Housing Model, run on 2007-2011 data (so that all neighborhoods could have sales in that time frame).
Important but statistical side note: regression methods provide a best estimate of the impact of each area on home values. For the above analysis, our margin of error for each estimate varies by neighborhood. This “standard error” ranges from 0.7% to 1.9%. Areas with standard error greater than 1.4% are shown in lighter blue. There is a 68% chance that the true impact of the area on market value falls within 1 standard error of the quoted best estimate, rising to 95% when the band is expanded to 2 standard errors. For this reason, we might say that Portola Springs and Northpark are statistically similar in their impact on value, but we are more sure that Columbus Grove (CG) has the lowest incremental market value. Even if the true CG value was 3.8% greater (2 standard errors), CG would still create a decline of 6.1% in market value. The 6.1% might put it in contention only with Orangetree and West Irvine in a statistical analysis. The standard error decreases as more data is accrued, so new neighborhoods are more subject to statistical swing.
The premiums for each area, relative to Northwood-Old, are listed on the chart. These values are not a human judgment of any type, and are derived directly from the relationship between the physical area of the home, the other factors in the regression model (beds, baths, sqft, lotsize, etc.) and the selling price of the home. The above result indicates how the market perceives each neighborhood in terms of valuation.
The general ordering of the areas should be of no surprise to area residents. Turtle Ridge, Turtle Rock, and Quail Hill stand out as having high incremental market value. Woodbridge is also a very solid performer and leads the pack of the older vintage flatland areas. The El Camino Real / Walnut complex lacks an association in some areas and is of an older design, so one might speculate that those factors lead to its lower valuation. It’s important to note that a property-based hedonic model does not tell you *why* each neighborhood is valued how it is – unless you have factors in the model that theorize the “why.”
It’s up to the analyst to consider what might be the underlying root causes. Models are a tool; some domain-specific knowledge is helpful in leveraging and interpreting their results. Some theories are testable by adding additional variables to the underlying regression. If, for example, we theorize that El Camino Real loses value because there is not enough park space, we could add in a variable with the number of square feet of parkland per housing unit.
Columbus Grove is a particularly interesting example. It’s located on the fringe of Irvine, but within the bounds of the Irvine school district and enjoys all the other benefits of being in Irvine (i.e. safe, near jobs, climate, etc.). However, the properties appear to sell for quite a discount to even an average area. Such a result shows that newer is not sufficient to generate enhanced market value.

In the above chart, properties sold in Columbus Grove are in blue, with Woodbury in red.
It’s easy to see that properties in Columbus Grove (CGR), at the same size as those in Woodbury (WDB), sell for considerably less. These 2-dimensional scatter plots are quick-and-easy tools to help verify that model results are sensible. Given that CGR and WDB are both newer neighborhoods – and that the regression takes lot size and bed/bath configuration into account, it’s interesting that the market has valued Columbus Grove so much lower.

From the Case-Shiller Tiered indexes, we already know that area (for which price is a proxy) already plays a large role in determining how home values have performed after the housing bubble’s peak. We’ve overlaid the Global Decision Irvine Hedonic Home Price Index on top of the Case-Shiller LAOC Tiered Value Indexes in the above graph. While Case-Shiller’s Aggregate value is down almost 40%, there is a clear distinction between lower-end and higher-end results. Case-Shiller’s High Tier is down only 30% from peak pricing. Irvine SFRs are performing even better, with 15-20% declines since the Irvine peak in early 2006.
For the areas of Irvine that have more data, we can take a stab at computing a hedonic price index for just those specific villages. We gain a finer level of granularity from doing so, but we lose statistical accuracy. In the overall Irvine Hedonic Housing Model, a typical standard error for the price trend numbers is near 1%. When we go area-by-area, those errors range from 1.5% to near 5%.

While all areas exhibit the same rapid rise, decent, and flattening trends, a few edge cases are worth a mention. First, 5 of the 6 areas have the same overall increase from Jan 2000 to early 2006, about 140-150%. Turtle Rock, however, is different. Its peak value hits “only” 120% above the Jan 200 value. Even more interesting, is that Turtle Rock did not experience nearly as much of a decline-from-peak as the other areas. We don’t have enough data to do a meaningful hedonic price trend model for the other top-3 value add areas (Quail Hill and Turtle Ridge), but we know from Case-Shiller’s Tiered metrics that higher-end properties have held value better post-bubble. Irvine is, itself, the higher-end of Case-Shiller’s Top Tier. The decline in Irvine home values has averaged 15-20% vs. 30% for the LAOC Case-Shiller Top Tier. Within Irvine, a high value area such as Turtle Rock appears to be experiencing even smaller declines.
Conversely, the area which rose the most in value (as a percentage of Jan 2000 values), is El Camino Real. Interestingly, El Camino Real’s values have now dropped the most of any neighborhood in Irvine (in this analysis) after the bubble popped. Again, the model cannot explain why – it could be a higher percentage of subprime loans, lower down payments, a change in consumer preferences, etc.
Most areas, including Irvine as a whole, are now about 100% above the Jan 2000 prices. Over 11.5 years, that’s a CAGR of 5.9%. That’s a useful number to have, as it can help inform the debate about the future direction of home prices. We can compare that 5.9% growth rate to other drivers of home value – average wage, job counts, new supply, persons per household, total households – to discuss whether current values represent a post bubble bottom or a landing on a stairway where another drop is forthcoming.

IrvineRenter's Commentary
I was not surprised to see Turtle Ridge and Turtle Rock at the top of the list, but the size of the premium was shocking to me. The same sticks and bricks are worth 40% more in these villages. Perhaps the premium views account for some of this (which also explains Quail Hill), but there are many non-view homes in these neighborhoods also obtaining substantial premiums.
I was also surprised to see Northwood Pointe and surrounding areas did not receive a higher premium. I would have guessed that Northwood Pointe was on par with Turtle Rock and Turtle Ridge, but it isn't. I was also surprized that Woodbury did not obtain a higher premium, that Woodbridge is more desirable than Westpark, and that University Park is more desirable than the old Northwood.
In my opinion, Columbus Grove represents the best value in Irvine. It feeds to the Irvine school district, the houses are nearly new, and yet it trades at a discount to the least desirable communities in Irvine. I imagine the Irvine Company would like to have everyone believe it is due to their superior land planning and community marketing. IMO, it's largely due to the fact that Lennar finished off the community and sold houses at a discount while the Irvine Company stopped construction to keep prices up. I believe Columbus Grove will rise in value relative to the less desirable Irvine communities of Walnut, El Camino Real, Orangetree and West Irvine.
The hedonic model showed than many of the undesirable areas exhibited the most volatile house prices. As mentioned above Turtle Rock didn't go up as much as other neighborhoods and didn't crash as hard either. On the other extreme is El Camino Real that went up a great deal and crashed more than other areas. This same phenomenon shows up in the general price tiers of Case-Shiller with the lowest price tier being the most volatile.
IMO, this volatility was largely the result of subprime lending and Option ARM financing. As lending standards were lowered during the bubble, more and more people qualifed to obtain loans. The fringes of the market (i.e. the lowest tier) should be the biggest beneficiary of an influx of new buyers. Turtle Rock wasn't being bid up by the 580 FICO score mob, El Camino Real was. Couple the influx of new buyers with the extreme leverage of Option ARMs, and the low end of the market gets pushed up substantially. The rest of the market is impacted by the move-ups with diffusion lessening the impact as you go up the housing ladder.
One of the factors that can never be modeled is human emotion and the variability of negotiation. For this reason, I don't believe it's possible to construct a model that can vary less than 5% from what the market actually does. Sometimes either the buyer or the seller is represented by a good agent who helps their client keep their emotions under control to make reasonable decisions. Sometimes not. Often either the buyer or the seller has motivations to complete the sale that have nothing to do with the real estate. Buyers can fall in love with a property and over bid, and sellers may need to move and lower their asking price aggresively to sell. People's emotions and negotiating skills will always represent a variable that can never be accurately modeled.
I want to thank Jaysen for this post. Next week, he will be back with a look at square footage, beds, baths, lot size, and other factors the strongly influence the prices of homes. Stay tuned.
Irvine's Turtle Ridge Premium
Never underestimate the power of zealots to sustain house prices. There is no metric by which the prices measured in Turtle Ridge make any sense, yet people keep paying the prices there. As distressed properties come to market, a buyer always seems to step up to pay off the Ponzi's debts.
I reasoned that Turtle Rock may not deflate much from it's bubble peaks because as an established community, there were fewer toxic loans there, and thereby there would be fewer distressed sales. Turtle Ridge was entirely built and sold during the bubble. People paid astronomical prices and borrowed huge sums to buy there. Despite the financial distress, prices have not fallen much, particularly at the high end.
What do you think? Will Turtle Ridge prices fall?
——————————————————————————————————————————————-
This property is no longer available for sale via the MLS.
Please contact Shevy Akason, #01836707
949.769.1599
sales@idealhomebrokers.com
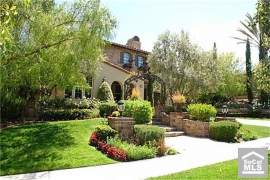
Irvine House Address … 60 CEZANNE Irvine, CA 92603 
Resale House Price …… $2,100,000
Beds: 3
Baths: 4
Sq. Ft.: 3887
$540/SF
Property Type: Residential, Single Family
Style: Two Level, Tuscan
Year Built: 2004
Community: 0
County: Orange
MLS#: S653380 
Source: SoCalMLS
Status: Closed
——————————————————————————
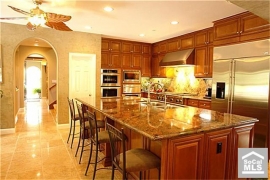
Welcome to your own Private Oasis in the Heart of Turtle Ridge. There has been no expense spared in this spacious Plan 3 in Chaumont. Upgrades include Venetian Plaster and Custom Paint throughout with recessed lighting. Fully Equipped Gourmet Kitchen comes with stainless steel appliances and opens to the Family Room. The family room has been upgraded with sliding glass doors that open onto the magnificent backyard. Fireplaces have been upgraded with sophisticated mantles and crushed glass. Three luxurious suites are located on the upper level with easy access to laundry. Master Bedroom comes with cozy Master Retreat and balcony overlooking the stunning landscaping. Surrounded by mature trees, this home is completely secluded with immaculate landscaping. The backyard comes with a spa and reverse infinity, salt water pool that cascades down over handpicked rocks. Custom Made Wrought Iron accents surround the estate while three crushed glass fire pits create a one of a kind environment.
——————————————————————————————————————————————- ![]()
Proprietary IHB commentary and analysis
Only in Irvine would someone pay $2,100,000 for a “plan 3,” and only a realtor would have the nerve to say it's a “one of a kind environment.” The perception of value is undeniable. Wether it's logical or not, the market makes it correct.
Resale Home Price …… $2,100,000
House Purchase Price … $1,542,500
House Purchase Date …. 3/31/2004
Net Gain (Loss) ………. $431,500
Percent Change ………. 28.0%
Annual Appreciation … 4.1%
Cost of Home Ownership
————————————————-
$2,100,000 ………. Asking Price
$420,000 ………. 20% Down Conventional
4.59% …………… Mortgage Interest Rate
$1,680,000 ………. 30-Year Mortgage
$368,674 ………. Income Requirement
$8,602 ………. Monthly Mortgage Payment
$1820 ………. Property Tax (@1.04%)
$708 ………. Special Taxes and Levies (Mello Roos)
$438 ………. Homeowners Insurance (@ 0.25%)
$0 ………. Private Mortgage Insurance 
$280 ………. Homeowners Association Fees
============================================
$11,848 ………. Monthly Cash Outlays
-$1581 ………. Tax Savings (% of Interest and Property Tax)
-$2176 ………. Equity Hidden in Payment (Amortization)
$721 ………. Lost Income to Down Payment (net of taxes)
$282 ………. Maintenance and Replacement Reserves
============================================
$9,094 ………. Monthly Cost of Ownership
Cash Acquisition Demands
——————————————————————————
$21,000 ………. Furnishing and Move In @1%
$21,000 ………. Closing Costs @1%
$16,800 ………… Interest Points @1% of Loan
$420,000 ………. Down Payment
============================================
$478,800 ………. Total Cash Costs
$139,400 ………… Emergency Cash Reserves
============================================
$618,200 ………. Total Savings Needed
——————————————————————————————————————————————————-
Thank you for the nice analysis. I think that we are on a landing and due for another leg down. The run-up from 2000 was primarily based on fraud and too-loose lending, so what can sustain it now? (there’s a Global Decision analysis that I’d like to see…how much of the run-up was fraud-induced or due to loose lending..take it out, and there is your likely bottom, plus the panic/overshoot factor).
I think that you meant “Turtle Ridge was entirely built and sold during the bubble…”
I disagree with your thoughts on Columbus Grove, however. I agree that money talks, and the buyers in Irvine are saying that there are factors that drive the price down in CG compared to other areas in Irvine. I think that a couple of those factors include its proximity to Tustin and the hangars, and the visible wires.
I remember feeling, back in 2000, that the market was overinflated. We’re currently rewinding to 2000 prices which, once attained, will be a plateau from which we descend to 1992 or 1995 values.
It’s not just a matter of correcting the problems which already existed in 2000 – problems due to overenthusiastic purchasing not caused by loose lending – but also adjusting to shrinking incomes in the middle class over the past decade.
That’s true. It’s hard to keep all of the price influences in mind…now I remember how this past year or so showed the first decrease in incomes ever. It looks like we have a ways to go.
Shady Canyon?
Shady Canyon gets lumped in with Turtle Rock in the MLS data. We may be able to separate these transactions out by the year of construction, but I don’t think there are enough resales to make a good stand-alone analysis on it yet.
It would be interesting to see the same analysis for surrounding areas – Tustin, Lake Forest, Mission Viejo, Aliso Viejo, Laguna Niguel, etc.
Curious,
We totally agree! While this is the *Irvine* Housing Blog, Irvine prices are affected by prices in Tustin, Lake Forest, Costa Mesa, etc. due to a reasonable substitution effect — and it would be worthwhile to understand how a hedonic price index model is moving in those other areas and, ultimately, all of Orange County.
Because Case-Shiller does not publish data for OC (only LA/OC), most “Orange County” price indexes are median-based. That’s a bit of a shame.
You are more than welcome to publish Coto de Caza results on the Coto Housing Blog.
Awgee,
Thank you for the offer. Coto would be another interesting premium OC market to analyze. The Global Decision model for Irvine should work well in a place like Coto that also has a consistent feel to it.
IrvineRenter
Excellent post! For me, the GD model largely validates much of a gut feeling about various areas of Irvine that I have held for a long time.
You wrote:
“…I was not surprised to see Turtle Ridge and Turtle Rock at the top of the list, but the size of the premium was shocking to me…”
I am surprised too.
I have a question/comment/possible explanation.
Is the high skew of Turtle Rock and Turtle Ridge possibly related to the equally surprising omission of Shady Canyon? Is Shady omitted from GD model by intention or is the Shady data commingled with the “Turtles”?
octal77,
Good question about Shady Canyon.
In theory Shady Canyon sales should have been largely ignored under the overall model exclusions (such as no sales of over $2M and no lots over a certain size). It’s always possible that a very small number of data points slipped in as data errors (where neighborhood was labelled as Turtle Rock or Turtle Ridge) but it should be minimal, and it would only be at the very bottom of the Shady Canyon market.
Also, thank you for pointing this out. Good models refresh over time. In a hedonic modeling system, it’s easy to add a new neighborhood or consolidate like areas in a forthcoming edition. We are always looking at areas of investigation to heighten model accuracy.
Thank you for this post. As many posters (on both bull and bear side) have said before, neighborhood medians are far more compelling than city medians.
octal77 & IrvineRenter – I wasn’t shocked at all by both TRs being at the top of the list _and_ their premiums.
IrvineRenter mentions that Northwood Pointe also feed into the Irvine school district but not all Irvine schools are created differently.
What is different about Turtle Rock, Turtle Ridge, and University Park? They feed into University High school, which was recently ranked as the #8 school in the United States. I think Northwood came in at #96 and Irvine High came in the #460s. And who keeps track of these statistics? Asian parents and I should know. I was a product of University High whose parents moved to Irvine (and Turtle Rock) specifically so that my sister and I could attend University (and this was back in the open enrollment days too). So, I think the TR premium is partly to do with the Asian influence.
Cheers.
IR,
The WB vs CG scatter plot has the wrong title, i think it should be Woodbury (Red) and CG (Blue), instead of the current WB (Blue) and CG (Red).
Thank you. I have corrected the chart.
“I was also surprised to see Northwood Pointe and surrounding areas did not receive a higher premium. I would have guessed that Northwood Pointe was on par with Turtle Rock and Turtle Ridge, but it isn’t.”
I’m assuming Northwood II (along the west side of Jeffrey) is included in “Northwood (new)” vs. Woodbury. If so, that could explain the depression of Northwood Pointe’s stature in the rankings.
“I was also surprized that Woodbury did not obtain a higher premium”
Woodbury has to be squatter’s central having been sold at the peek. I see a fair amount of distressed sales coming out of that area. Once the squatters are booted I’m thinking it will crater more than other areas.
Is there a way to represent the number of homeowners who are underwater as a percentage knowing loan amounts and current values? I think that would immediately highlight problem spots. Woodbury is easy because we know everyone paid a premium, but other areas are not so obvious unless you can access loan info. Even better is % not current on loan. The holy grail would be if you could combine and present that data.
The Holy Grail would be combining the data you suggest with current financials of any troubled properties.
Thanks for a great read. It pretty much confirms what I observed casually last year when looking for a home.
I eventually bought in west irvine because I thought it was one of the best bargains in Irvine. I think most of the bargain comes from the fact that it is attached to TUSD. The irony is that Myford/Ladera/Pioneer are all excellent schools and are rated better than a lot of the Irvine elementary/middle schools. I guess perception is King though and TUSD doesn’t have a very good one overall.
I wanted newer construction (2000 and later) and West Irvine was pretty much the only place i could get a 4bd, 2500sqft house on a decent size lot in the mid 700’s (which was my budget limit).
I did not consider Columbus grove because of one reason only, MelloRoos. Many properties have MR in the $6000+ range. My house in West Irvine has ~1800 MR.
when you are checking redfin, is there a way to find out how much mello roos a property makes you pay? redfin information shows if there is or isn’t mello roos, but not the percentage.
Yes, but not directly via redfin. Go to:
http://tax.ocgov.com/tcweb/search_page.asp
and plug in the Tax Parcel Number provided from the redfin page. The actual bill with MR is then available.
I agree about the need for other neighborhood analyses, but showing Irvine first makes sense for gaining perspective.
Thanks for doing this.
I bought a SFH in Lake Forest which is in SVUSD.
I wanted to buy in Irvine originally for one major reason – The Irvine Unified schools are significantly better in performance and quality (API scores) than Saddleback, and way better than the dysfunctional Capistrano Valley school district.
As the budget crisis worsens in the state, I wonder whether this important fact about school quality might keep Irvine SFH prices more buoyant?
I don’t encounter many stories about “cuts” in IUSD, but there’s a crapload going on in SVUSD and CUSD that may make “Irvine’s neighboring alternatives” like Lake Forest, Mission Viejo less appealing for prospective clients in the coming years. Not sure.
I agree about the school systems in neighbhoring cities. I think the Irvine schools are what keeps the values of the homes higher during the education crisis. We bought in Mission Viejo thinking SVSD would be fine…but now we have two young children that will soon be entering the elementary years and are considering private schools with the mess that SVSD is in. I can see how buying an Irvine property would be very desirable when looking at schools–especially with the budget school cuts. There are probably less budget cuts to Irvine because more affluent parents donate/contribute to the school.
I find education all the same up to about the 6th grade. That is when it really begins to matter. I think the movie Waiting for Superman found the same thing. They found that US kids were learning as well as kids from other countries up to 6th grade. Afterwards, they US kids averages plummet.
So elementary schools are fine everywhere. It’s the middle and high schools that really matter.
@zubs – Quite right! And I daresay that parental involvement is paramount above all else.
I completely agree with the parental involvement factor.
My son just had an incompetent (Irvine)teacher for a full year, however, in the all-important elementary school years. It can happen anywhere, but I’m just glad that in middle/high school, each teacher only has him for 1 hour per day instead of 6. Many parents stepped forward to advocate for their kids in this class. We were each told by the principal that “you are the only one”. Hopefully, they’ll get rid of incompetence rather than cover it up.
The rest of my kids’ teacher have been terrific. Irvine is facing its share of struggles, though.
Irvine USD is a public school district, so the majority of its funding is fed off from the state budget. IUSD does feel the pain with the budget cuts. The one difference is that I was told there are private doners to IUSD that help offset some of the budget cuts.
IPSF.
IPSF funds Irvine wide (ex. helps with music programs etc). City of Irvine matches ISPF donations dollar for dollar.
http://www.ipsf.net/
Often people donate directly to their kids schools as well via their school’s PTA.
Jaysen,
As I noted earlier, I’ve been running the regression model too and the dominant variables that I find are the square footage, lot size and age. I’ve mainly looked at Northwood. The number of beds and baths are highly correlated with the square footage (correlation values of 0.7). The dependence on beds is robust for two years data but not for three months data i.e., p-values greater than 0.05. Further, if you modify the assumptions, i.e., look at the number of beds in excess of say, ‘3’, one gets a valuation for the square footage with a negative correction for the number of excess beds. This also tells me that this is not a robust dependence and yet another indicator that these are not independent variables. The standard error for Northwood thus comes to around 9-10% of home value, per my calculations. I am impressed that you quoted much smaller standard errors.
Lastly, I disagree with you that you can tell what the value of an additional bed or bath would be. Due to the highly correlated nature of the variables, the regression coefficients can change a lot as you change your time window.
I would be interested in your comments.
Hi RB,
Thanks for your insights. In the next post (Wed Jul 13th), we are going to get into some detail about the coefficients for each explanatory factor in the model. I’d like to save some specifics for that post, but I can respond to a few general points you’ve made.
We’ve included the same three factors as you, along with 4-5 others that added predictive power to the model. The negative valuation of a bedroom is not uncommon in hedonic housing models from the admittedly modest research of other studies I’ve done. The general intuition is that adding a bedroom doesn’t inherently add value unless it’s coupled with a sufficiently large increase in square footage. For example, a 3/2 2000 sq. ft. property changing into a 4/2 2000 sq. ft. property isn’t a value add because you’ve created the bedroom at the expense of other living space. Doing so might even destroy value if the market demands larger communal living spaces.
We are using a full 10-year sales dataset (and creating a year-quarter dummy variable) so that we can decrease the standard error / p-values in the overall model. We’ve also run the analysis year-by-year and in year groups, and the coefficient p-values and standard errors increase as we shorten the timespan of the underlying dataset. You are perhaps seeing p > 0.05 when using a 3-month dataset due to the size of the dataset as opposed to the formulation of your model.
We have the same basic issue: bed-bath-sqft are all correlated to some degree. In our data, these correlations are bed-bath 0.603, bed-sqft 0.729, and bath-sqft 0.776. Whether this level of correlation is a problem is some matter of debate and seems to be an eternal issue among academic statisticians. While these correlations are higher than ideal, they are not drastically altering the meaningful nature of the regression coefficients IMHO.
We used the vif() function in R’s library(car) to find that VIF (Variance Inflation Factor) is between 1.0 and 2.50 for each coefficient. While many will have an opinion on “how high is too high” for VIF, the 1.0 to 2.50 range that we obtained seems reasonable compared to the upper bounds of 5 and 10 that are often proposed.
Hi Jaysen,
I will look forward to your next post. I’m not a statistics expert myself. Perhaps time for some googling again to find out more about VIF!
Some new wrinkles on renting out houses facing foreclosure in FL:
$1.2 million mansion for $10K?
“Yes, a mortgage lender would gladly pay the back dues to protect their investment — if they knew about it.”
Well, that’s a little naive. 🙂