Monthly Archives: July 2011

Democrats as Robin Hood: steal from renters, give to loan owners and banksters

The Obama administration is taking money from taxpaying renters and giving it to unemployed loan owners so they can give it to banksters. Unemployed renters get to sleep in the street.

Irvine Home Address … 9 STARDUST #5 Irvine, CA 92603

Resale Home Price …… $499,000

Oh it's not fair,

And it's really not OK,

It's really not OK,

It's really not OK,

Oh, you're supposed to care,

But all you do is take,

Yeah, all you do is take.

Lily Allen — Not Fair

Has fairness been a casualty of the housing bubble? At times it looks that way. The government keeps implementing policies to benefit one group over another not because it is the right thing to do but because it buys them votes. Last year, I wrote about The Policy of Screwing Prudent Renters to Benefit Loan Owners.

One housing bubble phenomenon was that the right ones — prudent people who knew what they could afford — were kept out, and the wrong ones — kool aid intoxicated fools — were let in. That mistake was bad enough, but now our own government is frantically working to repeat this mistake. Rather than doing something corrective, like letting house prices fall, our government is going to extreme lengths to keep the right ones out and keep the wrong ones in.

Since the previous failed policies of screwing renters did not succeed, the Obama administration is looking for ways of expanding the failed policies to really screw prudent renters.

Obama administration boosts aid for unemployed homeowners

Unemployed homeowners with government-insured mortgages will be allowed to miss a year of payments while they try to find a job.

While unemployed loan owners get to benefit from government largess, unemployed renters get to sleep in their cars or on the street.

By Jim Puzzanghera, Los Angeles Times

July 7, 2011

Reporting from Washington — Still scrambling to stabilize the struggling housing market, the Obama administration will allow some unemployed homeowners to miss a year of mortgage payments without threat of foreclosure while they try to find a new job.

Why do loan owners get such a dramatic increase in unemployment benefits while renters get nothing? Free housing is far more valuable than the paltry unemployment checks people receive. If lawmakers wanted to increase unemployment benefits, why don't they just do that? Because the real policy is to give money to the banks. The unfairness of this policy is unconscionable.

The expanded assistance — triple the current limit of four months for those with government-insured mortgages — could help “tens of thousands” of people keep their homes, Housing and Urban Development Secretary Shaun Donovan said.

Why should working renters care if loan owners are allowed to continue to occupy real estate they are not paying for? And why should working renters subsidize loan owners? Either give all unemployed increased benefits or let loan owners lose their houses. Why isn't anyone upset about renters getting kicked out of their homes?

Helping struggling borrowers avoid default is not only good for those borrowers, it is good for the economy,” he said.

Bullshit. It is good for the banks and only the banks. Giving money to lenders to keep people in properties they cannot afford does not benefit the economy. However, it does displace a wouldbe buyer who would have purchased the property currently being occupied by an unemployed delinquent mortgage squatter. Further it provides false hope to the borrower and fosters the borrower's sense of entitlement to occupy real estate they aren't paying for.

But hoping to avoid high expectations that have accompanied other administration foreclosure efforts, Donovan cautioned Thursday that the move wasn't a “silver bullet.”

The new requirement for so-called forbearance comes on top of several initiatives the White House has launched since 2009 to try to stem the tide of foreclosures, which continue to drive down real estate prices.

President Obama admitted this week that those efforts — such as the much-maligned Home Affordable Modification Program, which offered incentives to banks to lower monthly payments for troubled borrowers — haven't tamed the problem.

We've had to revamp our housing program several times to try to help people stay in their homes and try to start lifting home values up,” Obama said. “That's probably been the area that's been most stubborn to us trying to solve the problem.”

Attention all renters and prospective home buyers: Obama is screwing you. He is taking your money and giving it to loan owners in an effort to make prices unaffordable so you can never own a home. Obama is placing the financial interests of lenders and loan owners over the interests of renters.

Falling home prices are not a problem that needs to be solved. It is a healthy correction from an unsustainable bubble. Efforts to prevent this correction are what has been hurting the economy over the last few years.

Housing advocates and some lawmakers have pushed the administration to increase the amount of time unemployed homeowners would be allowed to skip payments. The White House agreed partly because 60% of people without jobs have been unemployed for more than three months, Donovan said.

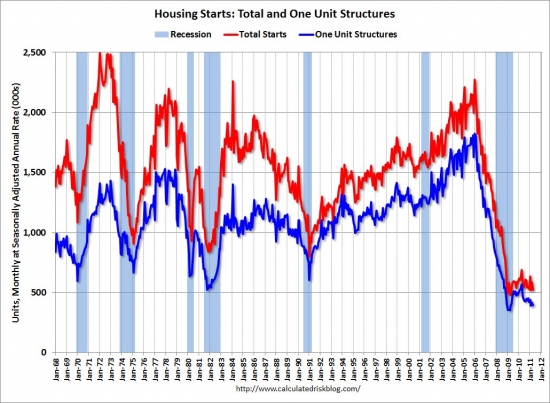
If house prices had been allowed to crash and bottom, the economy would be improving now because homebuilders would have the elusive price stability they need to go back to work. With high unemployment in construction, the economy continues to suffer, and it will as long as government policy prevents a natural bottom from forming in the housing market.

Separately, the Federal Reserve told Congress on Thursday that it wanted uniform standards for how mortgage servicers handle modifications, foreclosures and other issues. The Fed, along with HUD and other federal regulators, is working on such standards.

In addition, regulators are working with attorneys general from all 50 states on a broad settlement with major banks of investigations into botched foreclosure paperwork.

The administration's latest plan, unveiled Thursday, affects a small group of homeowners — about 3,500 borrowers a month who default on loans backed by the Federal Housing Administration and a total of about 1 million people eligible for HAMP aid.

The only solace I find for this misguided effort is how few it actually impacts.

But Donovan said he hoped that the new requirements would be adopted voluntarily throughout the broader mortgage industry.

Under the plan, mortgage servicers for FHA-insured loans will be required to allow qualified homeowners to miss up to 12 months of payments as unemployed borrowers look for new jobs.

The administration also is making it easier for unemployed homeowners to qualify for the assistance, removing what it called some “upfront hurdles” involving screening for employment and payment history.

In addition, mortgage servicers participating in the administration's mortgage modification program will be required “whenever possible” to extend the minimum period that eligible unemployed homeowners can miss payments to 12 months.

The missed payments would be added to the mortgage balance and made up by the homeowner, though in some cases those debts could be forgiven by the lender, Donovan said.

Lenders get to pocket this free money and get the balance added to the borrowers debt. It truly is a win-win for them.

Under what circumstances would the lender forgive this debt? Why would they?

But like the other government attempts to aid homeowners, the new effort has limitations. Only about 10% of some 50 million mortgage loans outstanding nationwide are backed by the FHA. And less than a quarter of the approximately 4.6 million homeowners who are behind on their mortgages qualify for the HAMP program.

Bert Ely, an independent banking consultant, said allowing unemployed homeowners to skip payments sounds good in theory but has problems that would make it difficult for the industry to adopt a 12-month standard.

Unfortunately, a lot of times forbearance just postpones the problem,” he said. “So you extend from four months to 12 months and things don't work out. Who eats the loss?

The government, of course. Who else would you expect to eat the loss?

Forbearance is at the heart of the shadow inventory problem. Lenders have been kicking the can down the road endlessly with hopes the problem will somehow work itself out. As they accumulate deadbeats, lenders run into cashflow problems, so now they are looking to the government to pick up the tab.

But the People Improving Communities Through Organizing National Network, a coalition of faith-based community groups, said the administration's announcement Thursday was “yet another step toward breaking the link in America between losing your job and losing your home.”

Yes, this is another step toward breaking the link between losing your job and losing your home. Is that a good thing? People borrowed a great deal of money on the premise that they would work to pay off the debt. Shouldn't they lose their homes if they stop working? If borrowers can break that link, I will see how much I can borrow, then I will quit work and just keep the house. Wouldn't you?

Rep. Barney Frank (D-Mass.) also cheered the move, saying many of his colleagues believed that the previous minimum “was not nearly enough time.”

“I think the 12-month extension will help very much,” he said.

I think Barney Frank is a tool, and if there is one thing I cheered with the Democrats lost the House of Representatives, it was Barney Frank losing power.

Last year, the special inspector general for the Troubled Asset Relief Program, which funded the administration's mortgage modification initiative, urged that the minimum period for skipped payments be increased.

Wells Fargo Home Mortgage, one of the nation's largest mortgage servicers, said it already offered homeowners the ability to skip up to 12 months of payments “in some cases.” From January 2009 to last April, the company has offered assistance to 173,000 customers who have lost their jobs, spokesman Tom Goyda said.

It's called amend-extend-pretend, and all the lenders are doing it. Whether the program is formalized or not, lenders have been accumulating delinquent borrowers in shadow inventory for years, and they will continue to do so as long as the resale market is too weak to absorb the inventory.

Because the administration hasn't released details of the changes in its programs, Wells Fargo would not comment specifically on them, he said.

jim.puzzanghera@latimes.com

Obama and the Democrats in power are not the only ones endorsing bad policy ideas. Bill Clinton, the master triangulator, has decided pandering to loan owners is good politics.

Bill Clinton Says BofA Deal May Lead to Principal Reductions

June 30, 2011, 7:11 PM EDT

July 1 (Bloomberg) — Former President Bill Clinton said Bank of America Corp.’s accord with mortgage-bond investors may give more “underwater” borrowers a chance to cut the amount owed on their home loans.

“You’d relieve the anxiety of countless Americans who would know they could hold onto their homes,” Clinton, 64, said in an interview yesterday with Bloomberg Television’s Al Hunt.

If giving away free money is considered a treatment to relieve anxiety, I will attest to being very stressed lately. Can I have some free money too? Oh, wait… I am not a loan owner, so I don't qualify.

Bank of America, the largest U.S. lender by assets, agreed this week to pay $8.5 billion to bondholders who said they were duped into investing in defective mortgages. The deal calls for specialized servicers to manage some of the highest-risk loans, an arrangement that Clinton said could lead to debt reductions and avert foreclosures.

So-called sub-servicers “are often very effective at effecting principal-reduction modifications,” said Laurie Goodman, an analyst at Amherst Securities Group LP, which specializes in fixed-income assets such as mortgage bonds, in a note yesterday. Bank of America, which was blamed by regulators for mishandling foreclosures and modifications, may hand over loans in groups of less than 30,000 to the smaller firms.

What does it take to be very effective at giving away free money? I suspect it really isn't that hard.

Dan Frahm, a spokesman for Charlotte, North Carolina-based Bank of America, declined to comment. Kevin Heine of Bank of New York Mellon Corp., the debt’s trustee, also declined to comment. Kathy Patrick, a lawyer for the bondholder group, didn’t respond to a request for comment.

Leaders at some of the biggest mortgage lenders have opposed cutting homeowner debts. JPMorgan Chase & Co. Chief Executive Officer Jamie Dimon has said principal reductions may be unfair and difficult to implement.

‘Hard to See’

Brian T. Moynihan, 51, CEO of Bank of America, said in April that “we do not see broad-based principal reduction as a sound policy decision” for the country.

It’s hard to see how we could justify reducing principal for many delinquent customers who represent a small portion of borrowers, but not for the vast majority of our customers who have stayed current on their loans,” he said in the prepared text of a speech.

Exactly. How can banks reward the least prudent borrowers in their portfolio at the expense of everyone else?

There is “enormous potential” to reduce the drag of U.S. housing on the economy if aspects of the Bank of America settlement are applied to the entire industry, Clinton said. The government could give an incentive to have that happen, he said.

Bill Clinton is right. If we give away billions of dollars of free money, it will certainly stimulate the economy. Of course, it is the dumbest policy idea I can think of, but if the Democrats pull it off, they might buy the loan owner vote.

“What I would like to see happen is some system set up to have the same thing done that they did because of this lawsuit, voluntarily, that encompasses everybody else,” Clinton said.

What i would like to see happen is for loan owners to get foreclosed on. Foreclosure is a superior form of principal reduction, and only through foreclosure will the mortgage mess get cleaned up and the economy will prosper.

Should banks forgive the debts of HELOC abusers?

  • The owners of todays featured property paid $419,000 on 4/15/2003. They used a $322,700 first mortgage and a $96,300 down payment.
  • On 2/27/2004 they obtained a $50,000 HELOC.
  • On 11/16/2004 they got a $100,000 HELOC.
  • On 12/29/2005 they refinanced with a $512,000 one-year ARM.
  • On 3/31/2006 they obtained a $112,000 HELOC they apparently did not use.
  • On 12/12/2006 they refinanced with a $517,500 first mortgage with a 10-year fixed rate.
  • They stopped making payments late last year, and the NOD was filled in April of 2011.

Foreclosure Record

Recording Date: 04/22/2011

Document Type: Notice of Default

These borrowers added $200,000 to their mortgage in a three-year span. They likely spent some of it on upgrades to the property, but I think it's fair to say they blew the rest. Is there any potential benefit to the country that makes forgiving their debts a good idea?

I don't think so.

If we forgive the debts of borrowers like these, we implicitly say this behavior is okay. If we do that, everyone will Ponzi borrow until the entire system collapses, then they will expect principal forgiveness to fix it. Home ownership truly does become a path to free money. All one has to do is sign some loan papers, and free money flows like ambrosia conferring endless wealth upon all who own a loan.

This is exactly what Bill Clinton is endorsing above, and many on the left who have been pandering to loan owners for the last few years would be happy to go along.

——————————————————————————————————————————————-

This property is available for sale via the MLS.

Please contact Shevy Akason, #01836707

949.769.1599

sales@idealhomebrokers.com

Irvine House Address … 9 STARDUST #5 Irvine, CA 92603

Resale House Price …… $499,000

Beds: 2

Baths: 2

Sq. Ft.: 1747

$286/SF

Property Type: Residential, Condominium

Style: 3+ Levels, Other

View: Hills, Park/Green Belt, Pool

Year Built: 1982

Community: Turtle Rock

County: Orange

MLS#: S665311

Source: SoCalMLS

Status: Active

——————————————————————————

Beautifully remodeled, wonderful location, and great views. You will fall in love with this upgraded townhome offering 2 master suites, 2.5 baths, formal living and dining rooms, fantastic French country kitchen with granite counters and beautiful cabinetry. Enjoy the private patio, the pools and spas, the walking trails and the park across the way with tennis courts. Award winning schools and just a few minutes drive to Newport beaches, Fashion Island, and South Coast Plaza.

——————————————————————————————————————————————-

Proprietary IHB commentary and analysis

Resale Home Price …… $499,000

House Purchase Price … $419,000

House Purchase Date …. 4/15/2003

Net Gain (Loss) ………. $50,060

Percent Change ………. 11.9%

Annual Appreciation … 2.1%

Cost of Home Ownership

————————————————-

$499,000 ………. Asking Price

$17,465 ………. 3.5% Down FHA Financing

4.59% …………… Mortgage Interest Rate

$481,535 ………. 30-Year Mortgage

$105,672 ………. Income Requirement

$2,466 ………. Monthly Mortgage Payment

$432 ………. Property Tax (@1.04%)

$0 ………. Special Taxes and Levies (Mello Roos)

$104 ………. Homeowners Insurance (@ 0.25%)

$554 ………. Private Mortgage Insurance

$260 ………. Homeowners Association Fees

============================================

$3,816 ………. Monthly Cash Outlays

-$398 ………. Tax Savings (% of Interest and Property Tax)

-$624 ………. Equity Hidden in Payment (Amortization)

$30 ………. Lost Income to Down Payment (net of taxes)

$82 ………. Maintenance and Replacement Reserves

============================================

$2,906 ………. Monthly Cost of Ownership

Cash Acquisition Demands

——————————————————————————

$4,990 ………. Furnishing and Move In @1%

$4,990 ………. Closing Costs @1%

$4,815 ………… Interest Points @1% of Loan

$17,465 ………. Down Payment

============================================

$32,260 ………. Total Cash Costs

$44,500 ………… Emergency Cash Reserves

============================================

$76,760 ………. Total Savings Needed

——————————————————————————————————————————————————-

Irvine 3bd/2.5ba Woodbury – $499,000

We have another Exclusive Access Property today. This one is a Plan 4 (3bd/2.5ba) detached condo in Woodbury's Bowen Court priced at $499,000 (also available for lease). Contact us for more info.

We also have some buyers that are looking for a specific tract/floor plan:

  • Quail Hill – Vicara Plan 4
  • Northwood Pointe – Arbor Crest Plan 1

If you are considering selling one of these homes, please contact Shevy:

Orange County construction related unemployment at 38%

The Orange County unemployment rate is under 10%, but unemployment in the construction industry is an astounding 38%. Projections are for a slow recovery.

Irvine Home Address … 4 PINEWOOD #67 Irvine, CA 92604

Resale Home Price …… $498,000

When they've tortured and scared you for twenty hard years

Then they expect you to pick a career

When you can't really function you're so full of fear

A working class hero is something to be

A working class hero is something to be

John Lennon — Working Class Hero

I know many people whose livelihood depends on construction and real estate. Most of them are hurting right now. With 38% unemployment, and 62% underemployment (that's a guess), nearly everyone in a real estate related field is suffering. Thirty-eight percent unemployment is remarkably high. Unemployment rates higher than 10% represent widespread suffering. Back when the government kept accurate and reliable records of unemployment during the Great Depression, the rate exceeded 25%. Thirty-eight percent unemployment is beyond description.

It's not only people in construction and real estate that suffer. With so many out of work, the demand for goods and services of all kinds is diminished. In short, the troubles in construction and real estate are not confined to that sector of the economy. On the bright side, it is getting a little better.

1st gain in O.C. construction jobs in 4 years

By JON LANSNER — July 5, 2011

The number of Orange County construction workers in May was 200 jobs higher than a year ago. That's no hiring spree but it's the first year-over-year gain since December 2006.

State Employment Development Dept. stats show Orange County construction bosses reported 67,000 workers in May – up 1,800 from April. That's the largest month-to-month gain since June 2007.

What's driving what is at a minimum a stabilization of Orange County construction work?

  • Well, EDD figures show big Orange County projects – so-called heavy and civil engineering jobs — up 600 in a year to 6,900 positions in May. That's the 7th consecutive gain for this Orange County construction niche, driving by big infrastructure programs such as highway work in northern Orange County and grading efforts for new housing in Irvine. Heavy and civil engineering jobs had previously been falling, year-to-year, for 16 months before the recent surge that leave employment in this category 2,200 positions – 24% – below the September 2006.
  • Specialty trade contractors add 300 workers in the year ended in May to total reported Orange County payrolls of 46,200 positions. That's the second straight year=to-year gain; and third in four months. This Orange County group is benefiting from slowly improved homebuilding efforts around the county and renewed boost in remodeling work for both homeowner and corporate clients. Specialty construction trade jobs in Orange County had previously been falling, year-to-year, for 51 months before the recent surge that leave employment in this category 30,000 positions – 39% – below the September 2006.
  • Still hurting are jobs in Orange County building construction, down 700 in a year – the 41st consecutive drop in a losing streak that dates to August 2007. Modest homebuilding efforts have not stemmed job losses in this niche, as construction of Orange County commercial real estate – from offices to shopping centers – remains all-but dead. Employment in this Orange County construction niche is down 10,300 jobs – 41% – from its September 2006.

Nobody wants to dampen good news, but it's been a painful Orange County real estate downturn: 42,500 construction jobs – 38% of the work force – gone since the September 2006 peak. In that same period, Orange County lost 157,000 jobs – so, construction alone was 27% of the drop.

The end of this suffering is nowhere in site. The Irvine Company has been employing construction workers for the last couple of years, but they aren't selling many of the homes they built recently, and some wonder if they won't stop due to lack of sales. If the Irvine Company stops construction, it isn't very likely that Rancho Mission Viejo or other competitors will pick up the slack. With residential, commercial and industrial all out of commission, only apartment construction will keep the industry afloat.

UCLA: Calif. housing ‘completely imploded’

June 15th, 2011, 12:00 am — posted by Jon Lansner

UCLA economists offer little near-term hope for California real estate in their latest forecast:

  • “Even the glimmer of hope we saw with slightly elevated prices in the coastal cities of California during the home purchase incentive months has now faded. The basic story of today's housing markets is that of a market that completely imploded, that has many Californians underwater and a market with demand diminished by both a lack of easy financing and a lack of jobs.”
  • “Another year before we see significant increases in the demand for housing.”
  • Homebuilding runs at historically low levels. “There are no signs of that changing soon.”
  • “When the potential demand finally turns into actual demand it is going to look a bit different than just a recovery in the housing market. It will be on the coast, and focused on multi-family housing. That is important because it has implications for the number and location of construction and real estate jobs generated by the resurgence in residential markets towards the end of next year.”
  • Multifamily construction is expect to eclipse its peak of the previous cycle — permits pulled for 62,000 units — by 2013. But home construction will peak this cycle at 119,000 units — 23% below the 2005 peak.
  • Construction employment will grow 25% in the next decade to 709,000. Still, that’s 225,000 jobs short of the previous cycle’s 2006 peak.

If UCLA is correct, we are witnessing a structural change in the California construction industry. The golden age of homebuilding and construction has past. By the chart above, they do not project reaching year 2000 employment levels by 2020. The only thing reducing unemployment will be workers giving up and seeking work in other fields.

Why the Housing Crash Remains a Wreck

By Marcie Geffner — Published June 27, 2011 — Bankrate.com

Foreclosures. Short Sales. Unemployment. Tight credit. Overbuilding. Those are but some of the reasons housing markets in many parts of the country remain stubbornly depressed, even while activity in other economic sectors has begun to rebound.

New-home building and sales of existing homes historically have been leading economic indicators, pointing the way to robust recovery after a downturn. In the current cycle, however, that hasn't happened, says Lawrence Yun, chief economist at the National Association of Realtors.

“Housing has always been the leader in terms of getting the economy back on track,” Yun says, “but that is not the case this time around.”

On rare occasions, Lawrence Yun says something that is not complete bullshit. In this instance, he is right. Residential investment has historically been the best indicator of the bottom of a recession. With homebuilding at historic lows, construction employment and spending is not boosting the economy and helping us pull out of recession.

Housing Starts Shrivel

The biggest stumbling block has been the sharp downturn in new-home construction, which is usually a major contributor to economic growth not only through new-home sales, but also jobs in home construction and purchases of new appliances, fixtures and furnishings.

But construction starts for residential units fell to an annualized pace of 560,000 units in May, a drop of 3.4% compared with the 582,000-unit pace for construction starts set a year earlier, according to the U.S. Census. Sales of new-built homes have lifted from last year's rock-bottom levels, but are still far lower than normal.

Building has been constrained, Yun says, due to a plentiful supply of existing for-sale homes relative to demand, rising prices of building materials such as lumber and steel, and builders' difficulty in getting construction loans.

The ample inventory of for-sale homes includes an “enormous overhang” of bank-owned properties that depress home prices and present tough competition for builders, says Rick Sharga, senior vice president of RealtyTrac, a foreclosure data firm in Irvine, Calif. Homes that are in some stage of the foreclosure process are so commonplace that they accounted for 28% of all homes sold nationwide in the first quarter of this year, RealtyTrac's latest survey showed.

Anyone who believed residential investment would bottom in 2009 was ignoring the overhang of REO. The UCLA forecast is probably a realistic assessment of what the future holds.

Tight Credit Squeezes Demand

Meanwhile, homebuying has been held back largely due to lenders' tighter grip on mortgage financing. Higher credit scores, fatter down payments and pickier underwriting have combined to outweigh fallen home prices and low interest rates, which have made owning cheaper than renting in some U.S. cities. One indicator of just how tight lending has become: 31% of U.S. home sales in April were to all-cash buyers, down only slightly compared with a record-high 35% share of cash transactions in March, according to the National Association of Realtors. Most cash buyers are investors who don't intend to occupy the homes they purchase.

The influx of all-cash buyers has corresponded to the declining home ownership rate. This was fully expected by anyone who anticipated a looming foreclosure crisis from insolvent borrowers.

Another demand-depressing factor has been the trend toward young adults living with their parents or an additional roommate, rather than forming their own new households. Household formation traditionally creates demand for smaller or less costly starter homes, the sales of which, in turn, allow current homeowners to buy larger or more expensive residences.

“What we have today is a weak recovery in the labor market, which is holding back some of the household formation,” Yun says. “The only way to unleash this household formation is to have strong consistent job growth.”

The national unemployment rate stood at 9.1%, or nearly 14 million people, in May. Another 8.5 million people were employed part time, but wanted full-time positions.

Homeownership Loses Appeal

Sharga points to a shift in consumers' attitudes toward homeownership as a factor in the housing sector's weakness: People aren't as interested in buying homes as they used to be. One recent RealtyTrac survey found that a huge percentage of today's renters don't want to buy a home — ever.

“No one wants to catch that proverbial falling knife (of lower home prices) and no one wants to become the next foreclosure statistic, so it really is an issue,” Sharga says.

Like the slower household formation, that lack of homebuying enthusiasm translates to less demand for entry-level houses and less opportunity for current homeowners, who might not have much equity, to trade up to another home.

So what will it take to get housing back in action? In short, a chain reaction of a robust economy, strong job growth and more household formation, easier credit, fewer foreclosures and an absorption of the existing excess supply of for-sale homes.

I have argued it will take an outside stimulus from an industry other than homebuilding to restart the economy. Once one sector the economy begins to flourish, the demand for housing will pick up, and then we will see the chain reaction everyone is waiting for.

Perhaps that Option ARM wasn't such a good idea

Today's featured property is an Option ARM gone bad. The owners are Ponzis savvy mortgage managers who extracted about $350,000 after investing $13,750 of their own money. Now they are selling short.

  • The owners paid $275,000 on 9/18/2001 using a $220,000 first mortgage, a $41,250 second mortgage, and a $13,750 down payment.
  • On 8/29/2002 they refinanced with a $268,000 first mortgage.
  • On 3/3/2003 they obtained a $60,000 stand-alone second.
  • On 3/17/2003 they obtained a $66,000 HELOC.
  • On 10/28/2003 they refinanced with a $346,500 first mortgage and a $99,000 stand-alone second.
  • On 4/12/2005 they got another cash infusion with a $190,000 HELOC.
  • On 11/10/2005 they refinanced with a $600,000 Option ARM.
  • In a stunningly stupid move, Bank of America gave them a $37,900 HELOC on 1/18/2008. They quit paying shortly thereafter.

Foreclosure Record

Recording Date: 03/02/2009

Document Type: Notice of Default

I looks like they followed with a loan modification which allowed the Option ARM holder to delay the short sale or foreclosure until today.

Foreclosure Record

Recording Date: 06/09/2009

Document Type: Notice of Rescission

Apparently their income did not more than double while their mortgage did.

——————————————————————————————————————————————-

This property is available for sale via the MLS.

Please contact Shevy Akason, #01836707

949.769.1599

sales@idealhomebrokers.com

Irvine House Address … 4 PINEWOOD #67 Irvine, CA 92604

Resale Home Price …… $498,000

Beds: 3

Baths: 3

Sq. Ft.: 2300

$228/SF

Property Type: Residential, Condominium

Style: Two Level, French

Year Built: 1977

Community: 0

County: Orange

MLS#: S661690

Source: SoCalMLS

Status: Active

——————————————————————————

BACKS TO SHOREBIRD PARK!!! BEAUTY & HARMONY SURROUNDS YOU IN THIS LOVELY 3 BEDROOM (MASTER & OTHER DOWNSTAIRS), PLUS ARTIST/SEWING ROOM & 3 FULL BATHROOMS. SUNSHINE FILLS THIS HOME WHICH HAS BEEN EXPANDED/REMODELED FOR ELEGANT ENTERTAINING, & MAKING MEMORIES WITH FAMILY & FRIENDS. SNUGGLE AND READ A BOOK IN THE CHARMING, QUAINT LIBRARY/OFFICE UPSTAIRS. KITCHEN FEATURES CORIAN COUNTERS, UNDER COUNTER LIGHTS, CANNED LIGHTS, TILE FLOOR, PANTRY CLOSET, GAS COOKTOP. BREAKFAST NOOK LEADS TO PATIO & VIEW OF PARK. LIVING ROOM & FORMAL DINING ROOM INCLUDE SOARING VAULTED CEILING. WOOD/GAS BURNING FIREPLACE IN ELEGANT LIVING ROOM WITH SLIDING DOOR LEADS TO BACK PATIO/PARK. TRAVERTINE FLR IN MSTR SHOWER RM. NEWER HVAC SYSTEM & SOME NEWER DUCTS. EXTERNAL GAS HOOKUP IN BACKYARD PATIO FOR PICNICS. RAISED PANEL DOORS THROUGH-OUT, DECORATOR INTERIOR PAINT, NEWER SKYLIGHT IN MASTER BATH, SPECIAL TREATED WOOD SHAKE ROOF. WOODBRIDGE OFFERS TENNIS COURTS, CLUBHOUSE, BEACH, BOATING, POOLS.

——————————————————————————————————————————————-

Proprietary IHB commentary and analysis

The word “snuggle” has no place in a real estate listing.

This property is at the cusp of what I consider an FHA financing candidate. With the cost of mortgage insurance, this property is still quite expensive. With 20% down, perhaps the cost of ownership is close to rental parity.

Resale Home Price …… $498,000

House Purchase Price … $275,000

House Purchase Date …. 9/18/2001

Net Gain (Loss) ………. $193,120

Percent Change ………. 70.2%

Annual Appreciation … 6.0%

Cost of Home Ownership

————————————————-

$498,000 ………. Asking Price

$17,430 ………. 3.5% Down FHA Financing

4.49% …………… Mortgage Interest Rate

$480,570 ………. 30-Year Mortgage

$104,234 ………. Income Requirement

$2,432 ………. Monthly Mortgage Payment

$432 ………. Property Tax (@1.04%)

$0 ………. Special Taxes and Levies (Mello Roos)

$104 ………. Homeowners Insurance (@ 0.25%)

$553 ………. Private Mortgage Insurance

$456 ………. Homeowners Association Fees

============================================

$3,976 ………. Monthly Cash Outlays

-$390 ………. Tax Savings (% of Interest and Property Tax)

-$634 ………. Equity Hidden in Payment (Amortization)

$29 ………. Lost Income to Down Payment (net of taxes)

$82 ………. Maintenance and Replacement Reserves

============================================

$3,063 ………. Monthly Cost of Ownership

Cash Acquisition Demands

——————————————————————————

$4,980 ………. Furnishing and Move In @1%

$4,980 ………. Closing Costs @1%

$4,806 ………… Interest Points @1% of Loan

$17,430 ………. Down Payment

============================================

$32,196 ………. Total Cash Costs

$46,900 ………… Emergency Cash Reserves

============================================

$79,096 ………. Total Savings Needed

——————————————————————————————————————————————————-

Have a great weekend,

IrvineRenter

Strategic default is moral imperative to prevent future housing bubbles

Underwater loan owners with payments exceeding rent have a moral imperitive to strategically default to provide deterence for banks to inflate future housing bubbles.

Irvine Home Address … 43 GREENFIELD Irvine, CA 92614

Resale Home Price …… $249,000

A sacred cash cow with sickly tits

Dripping temptation for hypocrites

to death she's beaten

The prosperous endlessly stating the obvious

Caught in your words, sever the knot this time

Somebody show me their true face

Face me once as I leave all that I despise

Face me as I unleash this hate refined

Lamb Of God — In Your Words

The fear of strategic default is a necessary deterrent to foolish lending. Without it, lenders are emboldened to make all manner of bad loans because they believe they will get paid back. Lenders will make nearly any loan if they believe they will get their money back with interest. It's only when they feel they won't get repaid are they prompted to loan responsibly.

Signatory versus asset-backed debt

Some have questioned how I can be so against debt, yet I am leveraging up to the max to buy cashflow properties in Las Vegas. Isn't that being hypocritical?

No. Not all debt is created equal. The debt I am taking on is backed by a cashflow-producing asset. The income stream is being used to repay the debt with interest, and if for some reason I am unwilling to pay back the loan, the lender can take back the property and obtain a cashflow equal to or greater than the payment on the debt. That is asset-backed debt.

I had the good fortune to meet a gentlemen who provides asset-backed debt from a major lender. His company provides debt for property, plant, and equipment to other major corporations. When he analyzes the collateral for a loan, he considers it's useful life, the recovery and resale value, and the cashflow the asset may generate (if any). He assumes the debtor's word means nothing and any recovery of capital will come solely from the collateral pledged to cover the loan. In his world, there is no signatory assurance of repayment. There is only collateral repossession, cashflow, and resale.

Asset-backed debt is essential to the functioning of our economic system. Many businesses could not raise the equity to obtain the property or equipment necessary to it's operations. Lenders can loan against working capital at very low rates with little risk. If businesses have their money freed up to grow the business, our economy grows and prospers. In short, asset-backed debt is useful and freeing.

On the other hand, signatory debt is slavery. Signatory debt is money given to a borrower simply based on the borrower's promise to repay. It has nothing to do with an asset, and if the borrower chooses not to repay, recovering signatory debt can be very difficult because it is not backed by tangible collateral.

Signatory debt provides no useful purpose. It provides a short-term economic boost as demand is pulled forward, but once it is consumed, money that would ordinarily have been spent by the borrower on consumer goods is instead diverted to the lender for debt service. It's only when signatory debt is expanding that the economy is stimulated. The expansion of signatory debt is a Ponzi scheme.

Signatory debt creates Ponzis

The problem with signatory debt is simple: people don't want to keep their promise to repay when it is inconvenient. Ponzis live to consume. They will take money under any terms offered, and when it comes time to pay the bills, they will seek more borrowed money to keep the system going. Borrowing money to repay debt is the essence of Ponzi living. Has anyone been watching events in Greece unfold?

Ponzis will inevitably spring from signatory debt. Not everyone who borrows with no collateral is a Ponzi, but Ponzis could not exist without signatory debt. The losses created by Ponzis are the only deterrent from lenders giving out free money. In our current home mortgage lending system backed by the government, without strict controls, Ponzi borrowing with home loans is inevitable.

Conflating asset-backed debt and signatory debt

Lenders are keen to conflate the distinction between asset-backed debt and signatory debt by over-loaning on assets. The housing bubble is a classic example, but lenders do this with car loans, commercial loans, and personal property loans.

A home loan has a component of asset-backed debt. The portion of the cost of ownership (payment, interest, taxes, insurance, HOA) equal to rental is asset-backed. If the loan balance is limited the size supportable at rental parity, the property could be rented for an income stream capable of sustaining the debt service.

However, once the cost of ownership exceeds the cost of a comparable rental, the only assurance the lender has of getting repaid is based on the signatory promise of the borrower. Therefore, the loan is part asset-backed and part signatory. When lenders cross the line from asset-backed to signatory debt, they turn good debt into evil debt and inflate asset bubbles. Lenders did this in both the residential and the commercial real estate markets during the 00s.

Once lenders cross the line from asset-backed debt to signatory debt, they are inflating an unsustainable Ponzi scheme. Inevitably, prices will crash back to asset-backed levels determined by rental parity. it's not a matter of if, only when. We are seeing this play out across America right now with the deflation of the housing bubble.

Strategic default is moral imperative

Lenders attempted to enslave an entire generation. They issued copious amounts of signatory debt to borrowers who only intended to repay that debt if house prices went up. Lenders created the Ponzis I profile on this blog on a daily basis.

Strategic default has been portrayed as immoral by lenders. This is wrong. Lenders were immoral when they abdicated their responsibility to sound lending practices that ensured their borrowers could remain solvent. It is outrageous after such irresponsible lender behavior that lenders have the nerve to chastise borrowers for being immoral when borrowers fail to repay their debts.

Borrowers have moral responsibility to default on loans where the payment on an amortizing mortgage exceeds the cost of a comparable rental.

If borrowers don't default, if lenders are given a free pass to make another generation insolvent, then we have failed our children. We are sentencing them to live in a world where lenders enslave them through excessive mortgage payments to afford properties comparable to rentals.

Without the fear of strategic default, lenders will conflate asset-backed debt and signatory debt again. Lenders will inflate future housing bubbles, and our children will be faced with the decision to own something far less desirable than what they can rent or sentence themselves to a lifetime of debt servitude.

The next time you read or hear that borrowers who default are being immoral, ask yourself who is really being immoral, the lender or the borrower. In my opinion, it is the lenders who were immoral when they inflated the housing bubble and over-burdened borrowers. The borrower who strategically defaults is behaving morally by doing what's best for their family.

Conforming Loan Limit Decrease Will Increase Strategic Default

Gary Anderson — Jun. 27, 2011, 1:31 PM

The conforming loan limit will be decreased by varying amounts in high end markets throughout the nation, according to the New York Times.

If congress does not take action, and I hope they don't, September 30th is the date these homes will be governed by the private market, with interest rates likely being higher.

The FHA, Fannie Mae, and Freddie Mac will pull out of these markets, as these loans are perceived by both political parties as being a burden on taxpayers. Potentially, less demand will cause the values of these homes to go down.

Yes, Pending conforming loan limit decrease will make California houses more affordable.

Of course, this deflation of housing brought on by less demand is necessary to forge another housing bubble down the road which bankers apparently want. I think government believes, however, that strategic default will not be an overwhelming issue, since polling seems to back the view that only 39 percent of eligible defaulters would consider defaulting. This actually emboldens banks to want more easy money loans because they know that everyone will not default. If everyone did default, banks would reconsider easy money lending, which would be a good thing. But there could be a change coming regarding views on the morality of the practice.

The change in morality has already occurred: Strategic mortgage default has become common and accepted in 2011.

It is this change of view regarding the morality of the practice that has banks worried. They are so worried that they are instituting tough measures to scare the potential defaulter into obedience.

While I don't like to see housing values decline, because it hurts people who have worked hard to attain their status, housing should not be inflated artificially. Housing should be shelter first, and an inflation hedge second. It should never be a speculative commodity, rising faster than inflation, because it is too important to the nation. If the decline in price for these houses becomes a long term reality, then many more people could afford to buy these houses for a long time into the future, and they would have more discretionary income than some owners have now. Their wealth would be founded upon a sound market and not on the shifting sands of speculation.

It's simple math. If a smaller portion of a wage earner's salary is diverted to housing costs, particularly interest, then money is freed up to be saved or spent on other things. Mortgage debt is a drain on the economy.

People in New York, Massachusetts, California and other high end regions should brace for less demand and higher interest rates for mortgages above the conforming limit. This is the jumbo mortgage arena where less demand has already caused a decline in house prices. But perhaps we haven't seen anything yet, as people will flee the higher rates until the prices themselves bottom out.

And owners should beware, because in the highest of high end areas, conforming loan limits could drop by the hundreds of thousands of dollars. This is something for even the most affluent members of our nation to think about. But knowing that most of them are staunch free market zealots should make the decline of their house values more palatable. Or maybe not.

The Irvine Company has already been plagued by flagging sales. What is going to happen when borrowers find it tougher to get loans at the price points they want to sell?

But since Fannie and Freddie are pulling out of this high end arena, they will have no influence on the defaulter like they did. As of last year, they were scaring defaulters with the threat of a 7 year ban on their mortgages. Now there is little to scare the strategic defaulter other than a credit score decline.

And, it has been shown that defaulters have a shorter window of risk in recourse states to lawsuit than do short sellers. And we know that California is a non recourse state. If a borrower does not have a recourse HELOC, or a refinance into a recourse loan, that borrower is really free to walk away in a non recourse state. So, potential strategic defaulters, what are you waiting for?

Please follow Clusterstock on Twitter and Facebook.

Follow Gary Anderson on Twitter.

I predict a wave of strategic default at the $750,000+ price ranges. Many of these borrowers were Ponzis who were only holding on because they believed prices were coming back. Once they realize the demand is gone, and it may not come back in the next decade, why would they keep making the oversized payments? After all, the plan was to live off the HELOC booty and appreciation, and that isn't going to happen. I expect Orange County delinquency rates to rise along with the rest of Coastal California.

No appreciation eight and a half years later

Back in 2007 and 2008, we would marvel at 2004 rollbacks. Those only represented about four years of zero appreciation. However, as the housing bust has dragged on, prices keep rolling back, and the dead time of zero appreciation has not extended to over eight years — and it will get worse.

Buyers from 2002 and 2003 are facing resale prices that often barely cover their sales commissions. There certainly isn't enough gain to compensate them for the additional cost of ownership they paid during the years of bloated mortgage payments. Also, inflation has eroded the value of money over the last eight years, so on an inflation adjusted basis, they are certainly behind those who rented instead.

Appreciation is supposed to justify making excessive payments. When it doesn't materialize, the people who opted for oversized loans played the fool. Banks are the beneficiaries along with realtors, mortgage brokers, and the former owners who obtained a windfall.

Slow steady gains in the housing market are much preferable to periods of boom and bust. If home prices were tethered to incomes through sane debt-to-income ratios and stable interest rates, homeowners would steadily gain equity, and none would be facing the terrible problems they are today. The goal of government policy should not be to maximize borrowing to save the banks and preserve loan owners illusions of wealth. The goal should be stable home prices and sound lending practices to sustain home ownership and preserve disposable income to sustain a consumer economy.

The owners of today's featured property paid $253,000 back on 1/28/2003. They borrowed $202,400 and put $50,600 down. The opened two HELOCs in late 2005 for $50,000 and $59,000, but there is no evidence they borrowed this money. Although they are now in default, these were not foolish borrowers who spent their home. They were merely unfortunate enough to have overpaid for a property in the price segment banks have been foreclosing on. Their property values have been pushed back to rental parity levels while their more affluent neighbors have been allowed to squat.

——————————————————————————————————————————————-

This property is available for sale via the MLS.

Please contact Shevy Akason, #01836707

949.769.1599

sales@idealhomebrokers.com

Irvine House Address … 43 GREENFIELD Irvine, CA 92614

Resale House Price …… $249,000

Beds: 2

Baths: 1

Sq. Ft.: 1060

$235/SF

Property Type: Residential, Condominium

Style: One Level, Cape Cod

View: Trees/Woods

Year Built: 1984

Community: Woodbridge

County: Orange

MLS#: P784798

Source: SoCalMLS

Status: Active

——————————————————————————

Wonderful, convenient upper condo-walking distance to the South Lake & lagoon. Nearby is Woodbridge High, Meadow Park Ele and South Lake Middle schools, shopping, Irvine Spectrum, Gelsons, Albertsons, Office Deport, Ace Hardware–restaurants. Great location and cute 1-level condo with 2 bedrooms and 1 full bath plus 1/4 ba (dressing area & sink) in master bedroom. Could look into adding a shower in master/may be room. Resort-style living, Woodbridge is THE master-planned community! Investors will love the ease of leasing in Woodbridge, evryone will enjoy the great lay-out of large living room, separate dining room open to the kitchen, inside laundry hook-ups and 2 generous-size bedrooms.

——————————————————————————————————————————————-

Proprietary IHB commentary and analysis

Another condo at or just below rental parity. Does that make it an enticing purchase? How much money would you have to save to be trapped here for several years? And why buy it as an investment for breakeven cashflow? Oh yeah, the price will double in five or ten years, right?

Resale Home Price …… $249,000

House Purchase Price … $253,000

House Purchase Date …. 1/28/2003

Net Gain (Loss) ………. ($18,940)

Percent Change ………. -7.5%

Annual Appreciation … -0.2%

Cost of Home Ownership

————————————————-

$249,000 ………. Asking Price

$8,715 ………. 3.5% Down FHA Financing

4.49% …………… Mortgage Interest Rate

$240,285 ………. 30-Year Mortgage

$52,117 ………. Income Requirement

$1,216 ………. Monthly Mortgage Payment

$216 ………. Property Tax (@1.04%)

$0 ………. Special Taxes and Levies (Mello Roos)

$52 ………. Homeowners Insurance (@ 0.25%)

$276 ………. Private Mortgage Insurance

$417 ………. Homeowners Association Fees

============================================

$2,177 ………. Monthly Cash Outlays

-$111 ………. Tax Savings (% of Interest and Property Tax)

-$317 ………. Equity Hidden in Payment (Amortization)

$14 ………. Lost Income to Down Payment (net of taxes)

$51 ………. Maintenance and Replacement Reserves

============================================

$1,814 ………. Monthly Cost of Ownership

Cash Acquisition Demands

——————————————————————————

$2,490 ………. Furnishing and Move In @1%

$2,490 ………. Closing Costs @1%

$2,403 ………… Interest Points @1% of Loan

$8,715 ………. Down Payment

============================================

$16,098 ………. Total Cash Costs

$27,800 ………… Emergency Cash Reserves

============================================

$43,898 ………. Total Savings Needed

——————————————————————————————————————————————————-

A detailed look at Irvine Village premiums by Global Decision and IHB

Which Irvine neighborhoods does the market consider the most desirable? Personal opinions aside, the market has spoken, and we have the results.

Irvine Home Address … 60 CEZANNE Irvine, CA 92603

Resale Home Price …… $2,100,000

You can be better than that

Don't let it get the better of you

What could be better than now

Life's not about what's better

John Butler Trio — Better Than

Which Irvine Village is the most desirable for single family homes?

Which Irvine Village is the best, and how could this be determined? Well, taking an opinion poll might be interesting, but it wouldn't be backed by anything substantial. To determine what people really believe about desirability, we have to look where people put their money. Money talks. The neighborhoods where people pay the most for real estate determines what is “best.”

Determining which neighborhood obtains the highest premiums is not easy. We couldn't simple look to the MLS or to past sales and see where the prices are highest because there can be many reasons people pay more in one neighborhood versus another. To accurately measure premium, we needed to normalize for other factors to distill a premium value not explainable by other factors.

In the first post in this series, An accurate view of the Irvine housing market by Global Decision and IHB, I introduced Jaysen Gilespie of Global Decision. “Jaysen Gillespie of Global Decision, an analytics and consulting firm that has worked in the real estate industry. He shares my interest in determining what is really going on in the real estate market. As a professional data analyst, he is trained in special techniques I cannot perform.” The first post was well recieved. Jaysen's skills with data analysis are remarkable, and I am thrilled he is working with me and the IHB to bring this information to the readership.

The following is the writing of Jaysen Gillespie. I have not set it off in block quote to make it easier to read.

A presentation by Jaysen Gillespie of Global Decision

info@globaldecision.com

Global Decision is an analytics consulting firm. While our methods are not industry-specific, our engagements are skewed towards specific industries in Southern California, such as real estate (along with online gaming and restaurant chains). We specialize in applying both foundational and advanced analytics to better understand business and economic issues.

Today’s post is part two of our series on hedonic housing valuation in Irvine. The goal of a hedonic housing valuation model is to use all information about a sale, including both the sale price and the characteristics of the home (number of beds, number of baths, square footage, etc.) to understand how the home’s value is derived from its constituent parts. Wikipedia offers a good overview of hedonic regression or see the Global Decision tutorial on how to build your own hedonic regression model.

What is a mathematical model?

A mathematical model is an abstraction of a real-world situation. Models help us understand how complex systems work by distilling them down to a manageable number of inputs, and they provide the ability to tinker with the model – and see how the system responds. In our case, the “system” under consideration is the Irvine, CA housing market. The hedonic model helps us do two things: first, it deepens our understanding of the drivers of housing demand. Second, it allows us to play with hypothetical scenarios and see what the impact would be on the value of a property.

How would someone in the “real world” use a hedonic housing model?

A fun aspect of building and using mathematical models is that you can perform experiments that would be physically or financially impossible in the real world. Because “neighborhood” or “area” is an input into the hedonic housing model, we could theoretically pick up a house from Woodbury and move it to Woodbridge (keeping all else equal) and see how the value of the property changes. For those engaged in building new homes, or developing a plan for a new neighborhood, an accurate hedonic housing model can be used to optimize revenue. If you know the incremental revenue you can obtain from an extra bedroom, an extra bathroom, or an extra 1000 sq. ft. of lot size, you can compare the costs of each option with the resulting expected increase in valuation and find the best bang-for-the-buck. It’s not an exact science, and I wouldn’t execute blindly based on just the results of a model. But a well-structured model can provide valuable insight and an unbiased view into the marketplace’s preferences.

How are neighborhoods modeled in the Irvine Hedonic Housing Model?

With Irvine it’s really a case of “the hits just keep on coming.” Not only do we have a background of glasslike consistency, especially in terms of education and safety, but we also have large, well-defined neighborhoods. Some locals refer to them as villages, though they have no governmental or political authority. Each village is similar, in that it was constructed in the same range of years, has access to many shared facilities, and generally sports a consistent look-and-feel throughout.

In regression models, there are generally two types of explanatory factors – continuous and categorical (discrete). Continuous factors can take on any value, or perhaps any integer value. Examples include the age of a property, the square footage, and the lot size. Categorical factors typically have either well-defined and finite possibilities or have a practical limit on their range. In theory the number of rooms in a home is continuous. You could construct a home with 700 of them. Unless you have the resources of Louis XIV, it’s probably not going to happen. So we’d consider the number of rooms in a home to be categorical for practical reasons.

If a categorical variable is numeric in nature, we can – at our option – use that number directly as an input into the underlying regression model. Treating a categorical numeric variable as a continuous variable makes sense when incrementing the factor by one has about the same impact. In our model, we treat the number of bedrooms and bathrooms as continuous, even though there is a finite range for these values.

An area designation, by contrast, can’t be directly fed into a regression model. It’s not numeric, and the model has no conceptual understanding of “Woodbridge” vs. “Oak Creek.” Fortunately, there are well-developed methods for handling these types of variables. The crux of the solution requires us to do two things: first, we must pick a baseline level for each category. In our example, we use “Northwood-Old” as our baseline area. After the regression is run, the baseline becomes the reference level against which others are measured. A good baseline contains a lot of data points and is preferably an area of average value.

Once we have a baseline level (Northwood-Old), we can model all other levels as extra variables in the regression. Continuing our example, we’d set up a variable called “Woodbridge.” Homes in Woodbridge get a “1” for that variable; others get a “0.” We benefit here from Irvine’s village system. Because villages are quite large, we need introduce only a small number of extra variables (16 in our case) into the regression model.

So what will the hedonic housing model tell me about neighborhoods?

The output of the hedonic model will tell the analyst how much more (or less) a home would be worth if that home were moved from the baseline area (Northwood-Old) to the area designated by each area variable. The virtual move from Northwood-Old to another neighborhood assumes all else is held constant. So if you start with a 3/2, 1600 sq.ft. home from 1977 in Northwood-Old and move it to Woodbridge, you’d gain (or lose) the dollar amount stipulated by the Woodbridge variable’s coefficient.

The model assumes all else holds constant. In reality, the model can only hold constant the factors that are directly input into the model. So if you use the model to move a home from Turtle Rock down to University Park, and you lose a city lights view in doing so, the model will revalue the home lower – but miss the fact that the view disappeared. Views, backing up to Culver, having Metrolink as your neighbor, or owning a strangely shaped lot are all examples of factors not in the model. In the future, it may be possible to add this type of data into the Irvine Hedonic Housing Model. A parcel map and GIS system would be able to determine if the property is located next to a major negative (I-405, for example).

The above chart represents the results of the Irvine Hedonic Housing Model, run on 2007-2011 data (so that all neighborhoods could have sales in that time frame).

Important but statistical side note: regression methods provide a best estimate of the impact of each area on home values. For the above analysis, our margin of error for each estimate varies by neighborhood. This “standard error” ranges from 0.7% to 1.9%. Areas with standard error greater than 1.4% are shown in lighter blue. There is a 68% chance that the true impact of the area on market value falls within 1 standard error of the quoted best estimate, rising to 95% when the band is expanded to 2 standard errors. For this reason, we might say that Portola Springs and Northpark are statistically similar in their impact on value, but we are more sure that Columbus Grove (CG) has the lowest incremental market value. Even if the true CG value was 3.8% greater (2 standard errors), CG would still create a decline of 6.1% in market value. The 6.1% might put it in contention only with Orangetree and West Irvine in a statistical analysis. The standard error decreases as more data is accrued, so new neighborhoods are more subject to statistical swing.

The premiums for each area, relative to Northwood-Old, are listed on the chart. These values are not a human judgment of any type, and are derived directly from the relationship between the physical area of the home, the other factors in the regression model (beds, baths, sqft, lotsize, etc.) and the selling price of the home. The above result indicates how the market perceives each neighborhood in terms of valuation.

The general ordering of the areas should be of no surprise to area residents. Turtle Ridge, Turtle Rock, and Quail Hill stand out as having high incremental market value. Woodbridge is also a very solid performer and leads the pack of the older vintage flatland areas. The El Camino Real / Walnut complex lacks an association in some areas and is of an older design, so one might speculate that those factors lead to its lower valuation. It’s important to note that a property-based hedonic model does not tell you *why* each neighborhood is valued how it is – unless you have factors in the model that theorize the “why.”

It’s up to the analyst to consider what might be the underlying root causes. Models are a tool; some domain-specific knowledge is helpful in leveraging and interpreting their results. Some theories are testable by adding additional variables to the underlying regression. If, for example, we theorize that El Camino Real loses value because there is not enough park space, we could add in a variable with the number of square feet of parkland per housing unit.

Columbus Grove is a particularly interesting example. It’s located on the fringe of Irvine, but within the bounds of the Irvine school district and enjoys all the other benefits of being in Irvine (i.e. safe, near jobs, climate, etc.). However, the properties appear to sell for quite a discount to even an average area. Such a result shows that newer is not sufficient to generate enhanced market value.

In the above chart, properties sold in Columbus Grove are in blue, with Woodbury in red.

It’s easy to see that properties in Columbus Grove (CGR), at the same size as those in Woodbury (WDB), sell for considerably less. These 2-dimensional scatter plots are quick-and-easy tools to help verify that model results are sensible. Given that CGR and WDB are both newer neighborhoods – and that the regression takes lot size and bed/bath configuration into account, it’s interesting that the market has valued Columbus Grove so much lower.

From the Case-Shiller Tiered indexes, we already know that area (for which price is a proxy) already plays a large role in determining how home values have performed after the housing bubble’s peak. We’ve overlaid the Global Decision Irvine Hedonic Home Price Index on top of the Case-Shiller LAOC Tiered Value Indexes in the above graph. While Case-Shiller’s Aggregate value is down almost 40%, there is a clear distinction between lower-end and higher-end results. Case-Shiller’s High Tier is down only 30% from peak pricing. Irvine SFRs are performing even better, with 15-20% declines since the Irvine peak in early 2006.

For the areas of Irvine that have more data, we can take a stab at computing a hedonic price index for just those specific villages. We gain a finer level of granularity from doing so, but we lose statistical accuracy. In the overall Irvine Hedonic Housing Model, a typical standard error for the price trend numbers is near 1%. When we go area-by-area, those errors range from 1.5% to near 5%.

While all areas exhibit the same rapid rise, decent, and flattening trends, a few edge cases are worth a mention. First, 5 of the 6 areas have the same overall increase from Jan 2000 to early 2006, about 140-150%. Turtle Rock, however, is different. Its peak value hits “only” 120% above the Jan 200 value. Even more interesting, is that Turtle Rock did not experience nearly as much of a decline-from-peak as the other areas. We don’t have enough data to do a meaningful hedonic price trend model for the other top-3 value add areas (Quail Hill and Turtle Ridge), but we know from Case-Shiller’s Tiered metrics that higher-end properties have held value better post-bubble. Irvine is, itself, the higher-end of Case-Shiller’s Top Tier. The decline in Irvine home values has averaged 15-20% vs. 30% for the LAOC Case-Shiller Top Tier. Within Irvine, a high value area such as Turtle Rock appears to be experiencing even smaller declines.

Conversely, the area which rose the most in value (as a percentage of Jan 2000 values), is El Camino Real. Interestingly, El Camino Real’s values have now dropped the most of any neighborhood in Irvine (in this analysis) after the bubble popped. Again, the model cannot explain why – it could be a higher percentage of subprime loans, lower down payments, a change in consumer preferences, etc.

Most areas, including Irvine as a whole, are now about 100% above the Jan 2000 prices. Over 11.5 years, that’s a CAGR of 5.9%. That’s a useful number to have, as it can help inform the debate about the future direction of home prices. We can compare that 5.9% growth rate to other drivers of home value – average wage, job counts, new supply, persons per household, total households – to discuss whether current values represent a post bubble bottom or a landing on a stairway where another drop is forthcoming.

IrvineRenter's Commentary

I was not surprised to see Turtle Ridge and Turtle Rock at the top of the list, but the size of the premium was shocking to me. The same sticks and bricks are worth 40% more in these villages. Perhaps the premium views account for some of this (which also explains Quail Hill), but there are many non-view homes in these neighborhoods also obtaining substantial premiums.

I was also surprised to see Northwood Pointe and surrounding areas did not receive a higher premium. I would have guessed that Northwood Pointe was on par with Turtle Rock and Turtle Ridge, but it isn't. I was also surprized that Woodbury did not obtain a higher premium, that Woodbridge is more desirable than Westpark, and that University Park is more desirable than the old Northwood.

In my opinion, Columbus Grove represents the best value in Irvine. It feeds to the Irvine school district, the houses are nearly new, and yet it trades at a discount to the least desirable communities in Irvine. I imagine the Irvine Company would like to have everyone believe it is due to their superior land planning and community marketing. IMO, it's largely due to the fact that Lennar finished off the community and sold houses at a discount while the Irvine Company stopped construction to keep prices up. I believe Columbus Grove will rise in value relative to the less desirable Irvine communities of Walnut, El Camino Real, Orangetree and West Irvine.

The hedonic model showed than many of the undesirable areas exhibited the most volatile house prices. As mentioned above Turtle Rock didn't go up as much as other neighborhoods and didn't crash as hard either. On the other extreme is El Camino Real that went up a great deal and crashed more than other areas. This same phenomenon shows up in the general price tiers of Case-Shiller with the lowest price tier being the most volatile.

IMO, this volatility was largely the result of subprime lending and Option ARM financing. As lending standards were lowered during the bubble, more and more people qualifed to obtain loans. The fringes of the market (i.e. the lowest tier) should be the biggest beneficiary of an influx of new buyers. Turtle Rock wasn't being bid up by the 580 FICO score mob, El Camino Real was. Couple the influx of new buyers with the extreme leverage of Option ARMs, and the low end of the market gets pushed up substantially. The rest of the market is impacted by the move-ups with diffusion lessening the impact as you go up the housing ladder.

One of the factors that can never be modeled is human emotion and the variability of negotiation. For this reason, I don't believe it's possible to construct a model that can vary less than 5% from what the market actually does. Sometimes either the buyer or the seller is represented by a good agent who helps their client keep their emotions under control to make reasonable decisions. Sometimes not. Often either the buyer or the seller has motivations to complete the sale that have nothing to do with the real estate. Buyers can fall in love with a property and over bid, and sellers may need to move and lower their asking price aggresively to sell. People's emotions and negotiating skills will always represent a variable that can never be accurately modeled.

I want to thank Jaysen for this post. Next week, he will be back with a look at square footage, beds, baths, lot size, and other factors the strongly influence the prices of homes. Stay tuned.

Irvine's Turtle Ridge Premium

Never underestimate the power of zealots to sustain house prices. There is no metric by which the prices measured in Turtle Ridge make any sense, yet people keep paying the prices there. As distressed properties come to market, a buyer always seems to step up to pay off the Ponzi's debts.

I reasoned that Turtle Rock may not deflate much from it's bubble peaks because as an established community, there were fewer toxic loans there, and thereby there would be fewer distressed sales. Turtle Ridge was entirely built and sold during the bubble. People paid astronomical prices and borrowed huge sums to buy there. Despite the financial distress, prices have not fallen much, particularly at the high end.

What do you think? Will Turtle Ridge prices fall?

——————————————————————————————————————————————-

This property is no longer available for sale via the MLS.

Please contact Shevy Akason, #01836707

949.769.1599

sales@idealhomebrokers.com

Irvine House Address … 60 CEZANNE Irvine, CA 92603

Resale House Price …… $2,100,000

Beds: 3

Baths: 4

Sq. Ft.: 3887

$540/SF

Property Type: Residential, Single Family

Style: Two Level, Tuscan

Year Built: 2004

Community: 0

County: Orange

MLS#: S653380

Source: SoCalMLS

Status: Closed

——————————————————————————

Welcome to your own Private Oasis in the Heart of Turtle Ridge. There has been no expense spared in this spacious Plan 3 in Chaumont. Upgrades include Venetian Plaster and Custom Paint throughout with recessed lighting. Fully Equipped Gourmet Kitchen comes with stainless steel appliances and opens to the Family Room. The family room has been upgraded with sliding glass doors that open onto the magnificent backyard. Fireplaces have been upgraded with sophisticated mantles and crushed glass. Three luxurious suites are located on the upper level with easy access to laundry. Master Bedroom comes with cozy Master Retreat and balcony overlooking the stunning landscaping. Surrounded by mature trees, this home is completely secluded with immaculate landscaping. The backyard comes with a spa and reverse infinity, salt water pool that cascades down over handpicked rocks. Custom Made Wrought Iron accents surround the estate while three crushed glass fire pits create a one of a kind environment.

——————————————————————————————————————————————-

Proprietary IHB commentary and analysis

Only in Irvine would someone pay $2,100,000 for a “plan 3,” and only a realtor would have the nerve to say it's a “one of a kind environment.” The perception of value is undeniable. Wether it's logical or not, the market makes it correct.

Resale Home Price …… $2,100,000

House Purchase Price … $1,542,500

House Purchase Date …. 3/31/2004

Net Gain (Loss) ………. $431,500

Percent Change ………. 28.0%

Annual Appreciation … 4.1%

Cost of Home Ownership

————————————————-

$2,100,000 ………. Asking Price

$420,000 ………. 20% Down Conventional

4.59% …………… Mortgage Interest Rate

$1,680,000 ………. 30-Year Mortgage

$368,674 ………. Income Requirement

$8,602 ………. Monthly Mortgage Payment

$1820 ………. Property Tax (@1.04%)

$708 ………. Special Taxes and Levies (Mello Roos)

$438 ………. Homeowners Insurance (@ 0.25%)

$0 ………. Private Mortgage Insurance

$280 ………. Homeowners Association Fees

============================================

$11,848 ………. Monthly Cash Outlays

-$1581 ………. Tax Savings (% of Interest and Property Tax)

-$2176 ………. Equity Hidden in Payment (Amortization)

$721 ………. Lost Income to Down Payment (net of taxes)

$282 ………. Maintenance and Replacement Reserves

============================================

$9,094 ………. Monthly Cost of Ownership

Cash Acquisition Demands

——————————————————————————

$21,000 ………. Furnishing and Move In @1%

$21,000 ………. Closing Costs @1%

$16,800 ………… Interest Points @1% of Loan

$420,000 ………. Down Payment

============================================

$478,800 ………. Total Cash Costs

$139,400 ………… Emergency Cash Reserves

============================================

$618,200 ………. Total Savings Needed

——————————————————————————————————————————————————-