Monthly Archives: July 2010

The Housing Bust Did Not Deflate The Mortgage Bubble

House prices have crashed in many markets but banks have barely begun the process of writing down their bad loans.

Irvine Home Address … 6 INDIANA Irvine, CA 92606

Resale Home Price …… $999,000

Celebrate the day you've waited for

Party like you're ready for so much more

Do it like you know it's never been done

Go a little crazy, have too much fun

Today's the day, come on everyone

The party's just begun

The Cheetah Girls — The Party's Just Begun

The big mortgage write down party has just begun. Banks have barely scratched the surface on the total dollar value of loans they will need to write off.

The housing bubble was really a credit bubble. Lenders extended far too much credit to people who had no ability to repay it. When the housing market crashed, lenders were in no rush to write their loans down to market value. The result is a huge remaining bubble in home mortgages.

Many lenders honestly believe house prices will rise back to levels that will eliminate the negative equity problem. This is wishful thinking on a grand scale. In reality, the overhang of distressed properties will keep price appreciation in check for quite some time. The mortgage bubble will be deflated by a combination of short sales and foreclosures — many facilitated by accelerated default — causing lenders to write down the mortgage debt to reach market values.

Mortgage Bubble Haunts Housing Recovery

By Lita Epstein Jul 20th 2010

You may not realize it, but there's another major financial bubble ready to burst. Few are talking about it, but Michael David White, a mortgage and real estate professional has graphed the mortgage bubble due to burst.

When the housing bubble burst, it left many with underwater mortgages. Yet nothing was done to deal with the debt levels on these homes. The mortgage values shown on the banks' books are still elevated beyond their true worth.

Right now we're seeing more and more people walk away from this debt. While property values fell from $20 trillion to $13 trillion when the housing bubble burst. Mortgages fell from $11.95 trillion to $11.68 trillion.

John Lounsbury, a financial and investment adviser, says home equity is now over 90 percent mortgaged. Historically our mortgage levels were 50 to 60 percent. He agrees with White that we're in a mortgage bubble that is ready to burst. In order to get back to the normal historic relationship, Lounsbury says "outstanding mortgage values would need to be about $7 trillion, which is $5 trillion below the latest level."

He says, "Banks are looking to resolve this bubble by waiting for mortgage repayment and for house prices to rise." He calls this the "extend and pretend" mode. The big question is: Will people continue to pay these mortgages as they wait for homes to rise enough in price to get back above water. In some of the hardest-hit areas that could take 10 to 20 years or longer.

There is no way borrowers are going to wait that long. Most can't. Do you think people will remain immobilized through 2025 for a decision they made in 2005? No way. When it becomes apparent house prices are not coming back, people will give up hope and walk away. Look for the double dip to crush the feeble hopes of those who haven't accelerated their inevitable defaults.

The Business Insider focused on the 15 hardest hit areas, with Nevada leading the pack. In Nevada, 69.9 percent of mortgages are underwater. Arizona comes in second with 51.3 percent of mortgages underwater, and Florida is third with 47.8 percent.

Based on mortgage debt, we're becoming a country of haves and have-nots. Those stuck in homes underwater cannot move to find work in another location, even if there's no work where their home is located. Without jobs, they may have no choice but to walk away or work with their bank for a deed-in-lieu of foreclosure. In many cases, these homes are so far underwater that banks won't agree to short sales.

As more and more people realize that they have no choice but to give up their homes, the mortgage bubble will deflate. The only question left is whether the bubble will burst rapidly or continue to deflate slowly as foreclosures are resolved.

I do think the mortgage bubble will deflate slowly. Lenders are being allowed to use mark-to-fantasy accounting, so there is no regulator pressure to write down the loan balances. Also, denial is a basic human reaction to catastrophe, and borrowers will surrender and capitulate at different rates. The brief bear rally we just witnessed will give false hope to many who will hang on for a few more payments.

But Lounsbury thinks that some areas of the country that have not yet been hard hit by the housing meltdown are ripe for problems. For example, he thinks the New York area is a bubble waiting to happen. In fact, Keith Jurow of the Real Estate Channel thinks a housing collapse in Queens is almost certain.

IMO, you can add coastal California to that list. I still believe the high end is going to be wiped out. There are no government supports for the jumbo loan market, and very few people can afford the large number of homes priced in that range.

As the housing bubble continues to deflate in areas that right now are not among the hardest hit, will that finally cause the mortgage bubble to burst? Will the banks be able to withstand these shocks or are we looking at another bank bailout?

Based on some reports, the banks may have pushed the worst of these mortgages onto Fannie Mae and Freddie Mac, leaving the taxpayers holding the bag for this next bubble burst. So the big question is not whether there's a mortgage bubble, but who will be left holding the bag when it bursts.

There is no question that we will engineer another bailout for the banks if the mortgage bubble deflates too quickly. Whatever losses cannot be pushed off to the taxpayer through the GSEs will become part of another massive bailout. Either that, or we will print money until the problem goes away.

The $4 Trillion Dollar Question

By Barry Ritholtz – July 15th, 2010

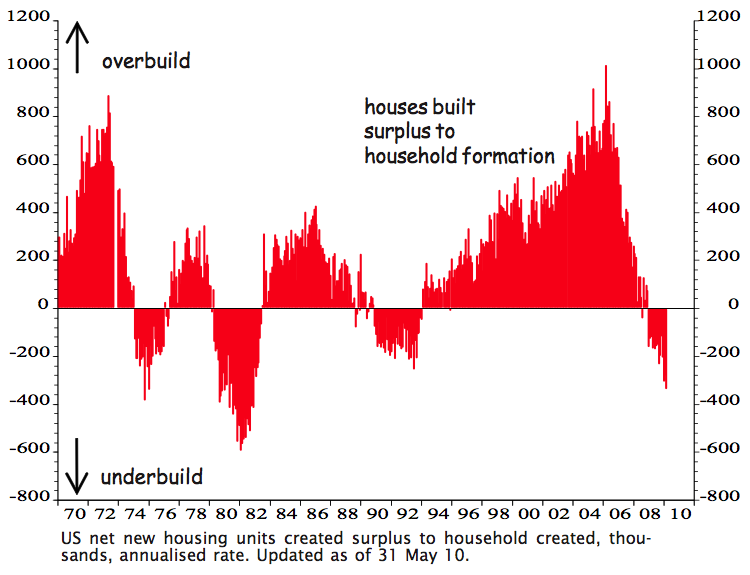
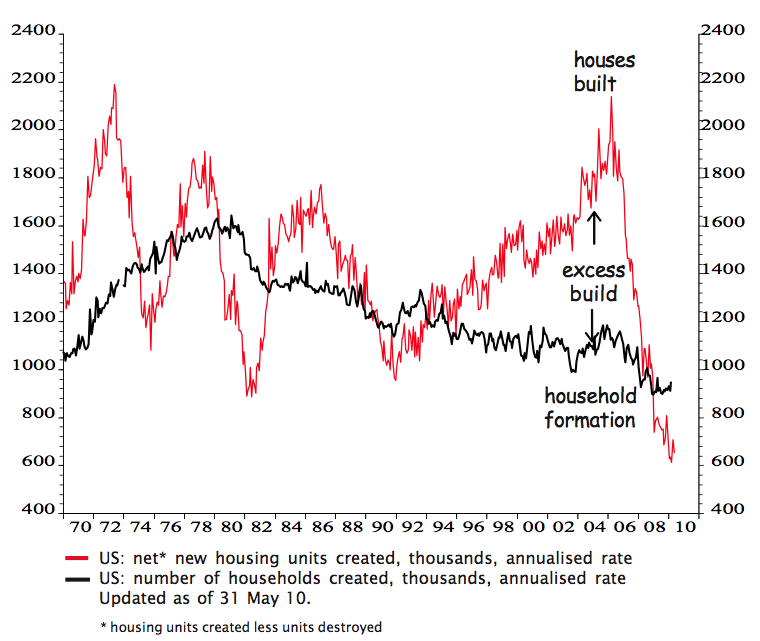
The US has built far too many houses

Perhaps homeowners suffering negative equity are patiently expecting house prices to rise again. But they may be in for a long wait. Prices are likely to be weighed down by a massive oversupply of homes relative to underlying demographic demand.

Between 2002 and 2006, US homebuilders went on a construction binge, building 12 million new homes while the number of households went up by just 7 million. The painful legacy is a massive oversupply of houses relative to the number of households.

The oversupply will take years to clear

With household formation running at just 0.9 million while the US is still building 0.6 million new homes annually, only 0.3 million of the oversupply will be absorbed per year. As there are currently 4 million too many homes, it may take years to mop up the huge oversupply of houses.

The negative equity problem and excess inventory will put pressure on the government to continue to subsidize mortgage interest rates. If interest rates rise and prices resume their downward slide, more people will opt for accelerated default causing the mortgage bubble to finally deflate.

Like foolish buyers during the housing bubble, banks really have no plan B. They are in amend-extend-pretend mode for the long haul. They can't afford to lose $4,000,000,000,000, yet that is what they must do. Perhaps they can extend it long enough to only lose $2,000,000,000,000? The banks have much pain ahead.

Peak buyer walks away

This property was purchased on 10/4/2006 for $1,150,000 the owner used a $805,000 first mortgage, a $115,000 stand-alone second, and a $230,000 down payment which was lost at auction. This property was pushed through the foreclosure process in about a year, so this owner did not get as much squatting time as others.

Foreclosure Record

Recording Date: 11/12/2009

Document Type: Notice of Sale

Foreclosure Record

Recording Date: 07/22/2009

Document Type: Notice of Default

In a last minute attempt to record an interest in the property, there was a loan for $10,500 recorded three days before the trustee sale. I don't know what they were hoping to accomplish as the first lien holder blew them out at trustee sale. This property, like many other trustee sale flips I profile, was purchased by Palladio Properties LLC, a fund very active in the Irvine market.

The property was auctioned on 4/5/2010 for $814,000. The opening bid was $751,500. After sales commissions and preparation for sale, Palladio Properties LLC will probably make about a 12% profit on this deal.

If you would like to learn how you can get involved with trustee sales, please contact me at sales@idealhomebrokers.com.

Irvine Home Address … 6 INDIANA Irvine, CA 92606

Resale Home Price … $999,000

Home Purchase Price … $814,000

Home Purchase Date …. 4/5/2010

Net Gain (Loss) ………. $125,060

Percent Change ………. 15.4%

Annual Appreciation … 63.0%

Cost of Ownership

————————————————-

$999,000 ………. Asking Price

$199,800 ………. 20% Down Conventional

4.59% …………… Mortgage Interest Rate

$799,200 ………. 30-Year Mortgage

$197,306 ………. Income Requirement

$4,092 ………. Monthly Mortgage Payment

$866 ………. Property Tax

$0 ………. Special Taxes and Levies (Mello Roos)

$83 ………. Homeowners Insurance

$116 ………. Homeowners Association Fees

============================================

$5,157 ………. Monthly Cash Outlays

-$981 ………. Tax Savings (% of Interest and Property Tax)

-$1035 ………. Equity Hidden in Payment

$343 ………. Lost Income to Down Payment (net of taxes)

$125 ………. Maintenance and Replacement Reserves

============================================

$3,609 ………. Monthly Cost of Ownership

Cash Acquisition Demands

——————————————————————————

$9,990 ………. Furnishing and Move In @1%

$9,990 ………. Closing Costs @1%

$7,992 ………… Interest Points @1% of Loan

$199,800 ………. Down Payment

============================================

$227,772 ………. Total Cash Costs

$55,300 ………… Emergency Cash Reserves

============================================

$283,072 ………. Total Savings Needed

Property Details for 6 INDIANA Irvine, CA 92606

——————————————————————————

Beds: 5

Baths: 2 full 1 part baths

Home size: 3,471 sq ft

($288 / sq ft)

Lot Size: 8,100 sq ft

Year Built: 1998

Days on Market: 82

Listing Updated: 40355

MLS Number: S614610

Property Type: Single Family, Residential

Community: Walnut

Tract: Camb

——————————————————————————

Large Beautiful Home in Harvard Square Gated Community. 5BR & 3BA with Large Bonus Room. 3 Fireplaces decorated with Marble. Plantation Shutters, Crown Moldings & Recessed Lights Through out. Upgraded Porcelain Tile & Hardwood Flooring. Granite Countertop & Walk-in Pantry in Kitchen. New Stainless Steel Appliances Installed.

Weakening Demand and Increasing Supply Cause Widespread Asking Price Reductions

The housing market has reached a tipping point where additional supply will overwhelm the number of active buyers and cause prices to move lower.

Irvine Home Address … 184 RHAPSODY Irvine, CA 92620

Resale Home Price …… $709,000

I`m standing on this cold, thin ice

And I`m about to crack

I`m over

I`m over

Over the edge

L.A. Guns — Over the Edge

We all watched the housing market go over the edge in late 2007 when rising inventory was greeted with a tremendous credit crunch. For the next 18 months, we watched prices fall until lenders reduced the supply on the market to match the weakened recessionary demand. The banking cartel's unwritten policy of restricting supply in combination with a plethora of government props has stabilized home prices temporarily; however, with the ongoing failure of loan modifications, the distressed properties must be sold, and the burgeoning inventory threatens to undermine market stability.

Housing Market Sees Widespread Price-Cutting

By Janet Morrissey Wednesday, July. 14, 2010

In a sign that the housing market has taken another turn for the worse, a new report shows almost a quarter of all home listings in the U.S. had at least one price reduction in June.

The price cutting is widespread too. The report, released Wednesday by residential real estate tracking firm Trulia, shows 21 of the country's 50 largest markets cut prices on at least 30% of their listings, up from 10 markets in May. (See pictures of Americans in their homes.)

Minneapolis led the way, with 40% of its listings registering at least one price reduction. This was followed by Milwaukee, Dallas, Boston, Baltimore, Phoenix and Memphis, which all slashed prices on more than 32% of their listings.

"Sellers are feeling the heat this summer as the economic recovery simmers down and home inventory levels climb," said Pete Flint, co-founder and chief executive of Trulia, in a statement. "We're seeing more sellers reduce their home listing prices to attract potential buyers." Housing inventory rose 5% between April and July.

In case you missed it Monday, Irvine's inventory just hit a 23-month high:

Moreover, waning consumer confidence, continued high unemployment, fears about a double-dip recession and a volatile stock market are all shaking buyer confidence in a possible housing-market recovery. "It's the perfect storm for creating less demand," says Ken Shuman, a spokesman for Trulia. "People are nervous." Recent housing data, including sharp drops in pending home sales, housing starts and mortgage applications for new home purchases, have all served to fan those fears. (See a PDF of housing price reductions.)

Probably the biggest factor influencing sales recently has been the federal homebuyer tax credit. The credit was particularly effective in bringing first-time homebuyers into the market. But now that it's over, move-up buyers are having a tougher time selling their existing homes, since the entry-level buyers have all but disappeared, says Alex Barron, founder and senior research analyst at Housing Research Center LLC. Under the federal tax-credit program, a home had to be purchased by April 30 in order to close by the June 30 deadline. "The whole market has slowed down anywhere from 30% to 40% across the country," says Barron. "When supply exceeds demand, you have to lower the prices."

Although the average price cut, according to the Trulia report, was 10%, some markets saw significantly bigger reductions: Detroit slashed prices by 26% on average, Las Vegas dropped prices by 15%, and both Miami and Phoenix saw average cuts of 13%. The total dollar amount slashed from home prices in June was $27.3 billion, the report said. (See high-end homes that won't sell.)

Read "The Fed Sees a Slower Recovery, but No Need to Change Course."

Read "With More Foreclosures, Housing Market Far From Recovery."

I got this email recently from a reader describing their experience buying a home in LA:

We've spent the last months helping my son buy a house in LA, focusing on specific micro-neighborhoods ….

We paid cash…. The details of what we bought aren't important, but what surprised me was how broken the entire market is.

Very large quantity of houses at some stage of foreclosure not proceeding to any resolution.

Very few listings are real listings anywhere close to market prices. Short sales at prices that are absurdly low (trying to solicit bids) or too high ( lender-approved but above market ).

The relatively small number of properties priced at market in the under 400K price range sell very, very quickly if they don't have real issues like foundation, drainage, substandard unpermitted construction.

Lenders are horribly inept at disposing of properties and the agents they hire do a crappy job. We saw a couple of houses where the stuff they had done to fix the house had substantially reduced the value ( covering up wood floors with crappy carpet or pergo, installing crappy appliances, painting over beautiful wood. )

Most agents are floundering badly and are clueless about what's going on.

… Buying with cash allowed us to close on a property about 10% under market when we found an anxious seller.

It's my gut feeling that everything above the entry level market ( under 450K) is due for another step down. Imbalance between supply and demand.

Double dip looks doubly certain

Commentary: The economic recovery is just an illusion

July 20, 2010 — Robert P. Murphy

NASHVILLE, Tenn. (MarketWatch) — Economists and financial analysts are currently arguing whether the economy will experience a "double dip," a recession followed by a short recovery, followed by another recession.

Some think the worst is behind us, and that output and employment will slowly but steadily increase during the next few years. Others believe we are headed for another crash. The lessons from the last business cycle favor the case for pessimism.

It has been said that if one laid all the world's economists end to end, they wouldn't reach a conclusion. Even so, a surprisingly large number of economists now agree that then-Federal Reserve Chairman Alan Greenspan made a tragic mistake. After the dot-com bubble burst in 2000, Greenspan opened the monetary floodgates.

Specifically, Greenspan allowed the "monetary base" to increase 22% from June 2000 through June 2003. The monetary base, also called "high-powered money," is the base upon which bank loans are pyramided, expanding the total amount of money held by the public.

During the same three-year period, Greenspan cut the federal funds rate — the interest rate commercial banks charge each other for overnight loans — from 6.5% down to 1%, the lowest federal funds rate in more than 40 years.

The rationale for Greenspan's easy-credit policy was to provide a "soft landing" for the economy in the wake of the dot-com crash and Sept. 11 attacks. And for a while, it seemed he had succeeded. People marveled that housing prices continued to rise, even amidst the recession of 2001. Indeed, people referred to Greenspan as "the Maestro."

I Pity Alan Greenspan. He has offered feeble defenses of his choices, but I think he is a fool and history will remember him as such.

In retrospect, economists across the political spectrum recognize the role Greenspan's Fed played in fueling the housing bubble. The more cynical analysts argue that Greenspan's policies weren't "easy" at all and merely postponed the inevitable day of reckoning for the economy. Rather than gritting its teeth and suffering through the necessary adjustments in the early 2000s, the nation got an injection of artificial credit that masked the underlying problems with a euphoric boom.

The housing market eventually collapsed, as all bubbles do. At this point, Ben Bernanke was at the helm of the Fed. Unfortunately, he got his policies out of Greenspan's playbook, except Bernanke doubled down.

Rather than pushing short-term interest rates down to 1% as Greenspan did, Bernanke has pushed them down to almost zero percent. And in contrast to Greenspan's 22% increase in the monetary base during a three-year period, Bernanke increased it by 94% in one year.

The unprecedented monetary stimulus from the Fed, in conjunction with the massive deficits of the federal government, did succeed in partially re-flating the stock market and stabilizing home prices. Time magazine named Bernanke its 2009 Person of the Year, and Obama administration officials are taking credit for nipping the Great Recession in the bud. Yet the parallels with the Greenspan episode are clear.

It makes no sense to "rescue" the economy by having politicians borrow and spend trillions of dollars. It also makes no sense to fix the horrible mistakes of the housing-bubble years by having the Fed create electronic money out of thin air to buy "toxic assets" from investment banks that would otherwise be insolvent.

The alleged economic recovery is unfortunately just as illusory as the prosperity of the housing-bubble years. It is disturbing to consider that if this is the calm before the storm, then the pending crash will be painful indeed. In the current debate on the direction of the economy, those predicting a "double dip" have the stronger — if more depressing — case.

Robert P. Murphy is a senior fellow in Business and Economic Studies at the California-based Pacific Research Institute.

I don't have much to add to that brilliant synopsis.

When you add it all up, it certainly looks as if the housing market is in for a rocky fall and winter. But Irvine is different, right?

Another peak buyer and another Palladio Properties LLC flip

This property was purchased on 8/22/2005 for $740,000. The owner used a $592,088 first mortgage and a $147,912 down payment. He obtained a $100,000 HELOC on 7/11/2006, but it isn't clear if the owner ever used that money. He stopped paying last spring, and after about 12 months, the foreclosure went forward.

Foreclosure Record

Recording Date: 11/17/2009

Document Type: Notice of Sale (aka Notice of Trustee's Sale)

Click here to get Foreclosure Report.

Foreclosure Record

Recording Date: 08/14/2009

Document Type: Notice of Default

The operators of the Palladio Properties LLC investment fund appear to know what they are doing. They have been consistently been targeting 10% to 15% profit margins depending on renovation expenses, and their resale pricing is within market comps. Their property turnover is probably good. I have seen many of their flips recently.

If you would like to learn how you can get involved with trustee sales, please contact me at sales@idealhomebrokers.com.

Irvine Home Address … 184 RHAPSODY Irvine, CA 92620

Resale Home Price … $709,000

Home Purchase Price … $596,000

Home Purchase Date …. 4/30/2010

Net Gain (Loss) ………. $70,460

Percent Change ………. 11.8%

Annual Appreciation … 71.5%

Cost of Ownership

————————————————-

$709,000 ………. Asking Price

$141,800 ………. 20% Down Conventional

4.59% …………… Mortgage Interest Rate

$567,200 ………. 30-Year Mortgage

$140,030 ………. Income Requirement

$2,904 ………. Monthly Mortgage Payment

$614 ………. Property Tax

$333 ………. Special Taxes and Levies (Mello Roos)

$59 ………. Homeowners Insurance

$203 ………. Homeowners Association Fees

============================================

$4,114 ………. Monthly Cash Outlays

-$696 ………. Tax Savings (% of Interest and Property Tax)

-$735 ………. Equity Hidden in Payment

$243 ………. Lost Income to Down Payment (net of taxes)

$89 ………. Maintenance and Replacement Reserves

============================================

$3,015 ………. Monthly Cost of Ownership

Cash Acquisition Demands

——————————————————————————

$7,090 ………. Furnishing and Move In @1%

$7,090 ………. Closing Costs @1%

$5,672 ………… Interest Points @1% of Loan

$141,800 ………. Down Payment

============================================

$161,652 ………. Total Cash Costs

$46,200 ………… Emergency Cash Reserves

============================================

$207,852 ………. Total Savings Needed

Property Details for 184 RHAPSODY Irvine, CA 92620

——————————————————————————

Beds: 4

Baths: 2 full 1 part baths

Home size: 2,000 sq ft

($355 / sq ft)

Lot Size: n/a

Year Built: 2005

Days on Market: 46

Listing Updated: 40329

MLS Number: S619238

Property Type: Condominium, Residential

Community: Woodbury

Tract: Wdch

——————————————————————————

Gorgeous Detached Home in Woodbury. Main floor Bedroom & Bath. Mater Bedroom with Retreat area & Balcony. Recessed lighting & pre-wired Surrounding Sound Speakers in Living room. Planation Window Shutters. Move-in ready.

Laguna Niguel 2bd/2.5ba 1,197 sqft condo – Milano tract in Rancho Niguel $299,900

Another listing before it hits MLS. It is a 2bd/2.5ba 1,197 square foot condo in Laguna Niguel. It is priced at $299,900. It is a Plan E in the Milano tract in Rancho Niguel. This home is not yet on MLS but will be in 7 days.

If you want to learn more about this property, please contact us:

This is an Exclusive Access Property

Prime Loan Delinquencies Increase for 37th Straight Month

Prime mortgages are defaulting at ever-increasing rates. The problem with mortage delinquency is not improving.

Irvine Home Address … 14902 ELM Ave Irvine, CA 92606

Resale Home Price …… $769,000

Cars are crashin' every night

I drink n'drive everything's in sight

I make the fire

But I miss the firefight

I hit the bull's eye every night

It's so easy, easy

Guns N' Roses — It's So Easy

It is rare to find a great deal of consistency in financial data. There are always statistical blips where some indicator moves against the prevailing trend, and reporters are keen to report on any insignificant change as if it is a new trend. For the last 3 years, the news on mortgage delinquencies has been very consistent — consistently bad. This is one indicator that hasn't yet provided the slightest glimmer of hope to those waiting for the housing rebound.

Seriously Delinquent Prime RMBS Rise for 37th Straight Month: Fitch Ratings

Diana Golobay — Tuesday, July 13th, 2010, 11:22 am

The 60-plus-day delinquency rate for US prime residential mortgage-backed securities (RMBS) rose in the 37th consecutive month in June, according to Fitch Ratings.

The credit-rating agency noted the "seriously" delinquent rate — of 60 days or more — within prime jumbo RMBS rose to 10.4% in June, up from 10.3% in May and 6.4% at the same time last year.

What is even worse is that once borrowers go "seriously" delinquent, the cure rate has been getting steadily worse.

Think about what we have going on. We have a very large number of borrowers who purchased at the peak and can't afford the home with conventional financing even at very low interest rates. People simply can't pay off a loan that is six-times their yearly income no matter how favorable the interest rate. Add to all these peak buyers the HELOC abusers and other peak refinancers, and you have a recipe for enormous debt that will never get repaid. Once these struggling loan owners stop paying, they enter the abyss never to return.

The five states with the highest volume of prime RMBS loans outstanding — California, New York, Florida, Virginia and New Jersey — represent a combined two-thirds of the estimated $354bn market, Fitch said. Prime jumbo RMBS delinquencies of 60 days or more rose in all but one of these top volume states:

The rate of loans rolling into later stages of delinquency within prime RMBS remained above 1% in June after a dip months earlier, but is still below the record high 1.4% recorded in March.

"The persistently high roll rates indicate that the delinquency declines are more a reflection of increased property liquidation and ongoing loan modification activity than of widespread improvement in mortgage payment performance," said Fitch managing director Vincent Barberio, in a statement, adding that "Prime RMBS has yet to show any signs of a favorable turnaround."

Almost nobody cures their debt by bringing payments current. This used to happen before the bubble, but with the huge debt loads, negative equity positions, and high unemployment, very few borrowers come up with the cash to cure their loans. The next best alternative is to get a loan modification and add the missed payments to the loan balance. Many in our government thought this solution might actually work. It won't because the debt load is far to large, and with negative equity, many borrowers don't see the point. This leaves liquidation through short sale or foreclosure as the ultimate solution. The loan is "cured" because it no longer exists.

Despite improvements in subprime and Alt-A RMBS delinquencies, roll rates remain elevated in those loan types, too.

Subprime RMBS delinquencies fell again in June to 43.7% from 44.8% in the previous month. The subprime RMBS roll rate fell slightly to 4.2% from 4.3% a month earlier.

Alt-A RMBS delinquencies slipped to 3.7% in June from 33.9% in May, marking the third monthly decline since April 2006. Roll rates rose to 3.4% in June from 3.1% in May.

Many of the loans in Irvine are packaged into prime residential mortgage-backed securities. We are not subprime dominated, so despite the high delinquency rates, lenders have not foreclosed on delinquent borrowers here. Orange County has high delinquency rates, and the steady increase in defaults on prime mortgages has not missed Irvine. Each day I profile a property that was likely a prime mortgage gone bad. With the sky-high prices we had here (and still have) the level of mortgage distress is high as well. Perhaps the lender's gambit of allowing borrowers to squat will succeed, and Irvine will not see further price declines. Anything is possible, but I rather doubt it.

Late buyer still milked the equity cash cow

  • Today's featured property was originally purchased on 6/10/2005 for $749,000. The owner, a married woman buying as her sole and separate property, used a $495,000 first mortgage and a $254,000 down payment.
  • On 11/10/2005, she refinanced with a $499,000 first mortgage.
  • On 1/27/2006 she obtained a $190,000 HELOC.
  • On 3/28/2007 she refinanced with a $688,000 first mortgage and she got a $86,000 HELOC.
  • Total property debt is $774,000
  • Total mortgage equity withdrawal is $279,000 including her substantial down payment.
  • Total squatting time was at least 22 months.

Foreclosure Record

Recording Date: 04/23/2009

Document Type: Notice of Sale

Foreclosure Record

Recording Date: 10/23/2008

Document Type: Notice of Default

Palladio Properties LLC also purchased this place at auction. They have been very busy in the foreclosure auction market.

If you would like to learn how you can get involved with trustee sales, please contact me at sales@idealhomebrokers.com.

Irvine Home Address … 14902 ELM Ave Irvine, CA 92606

Resale Home Price … $769,000

Home Purchase Price … $625,000

Home Purchase Date …. 5/4/2010

Net Gain (Loss) ………. $97,860

Percent Change ………. 15.7%

Annual Appreciation … 85.9%

Cost of Ownership

————————————————-

$769,000 ………. Asking Price

$153,800 ………. 20% Down Conventional

4.59% …………… Mortgage Interest Rate

$615,200 ………. 30-Year Mortgage

$151,880 ………. Income Requirement

$3,150 ………. Monthly Mortgage Payment

$666 ………. Property Tax

$0 ………. Special Taxes and Levies (Mello Roos)

$64 ………. Homeowners Insurance

$43 ………. Homeowners Association Fees

============================================

$3,924 ………. Monthly Cash Outlays

-$755 ………. Tax Savings (% of Interest and Property Tax)

-$797 ………. Equity Hidden in Payment

$264 ………. Lost Income to Down Payment (net of taxes)

$96 ………. Maintenance and Replacement Reserves

============================================

$2,732 ………. Monthly Cost of Ownership

Cash Acquisition Demands

——————————————————————————

$7,690 ………. Furnishing and Move In @1%

$7,690 ………. Closing Costs @1%

$6,152 ………… Interest Points @1% of Loan

$153,800 ………. Down Payment

============================================

$175,332 ………. Total Cash Costs

$41,800 ………… Emergency Cash Reserves

============================================

$217,132 ………. Total Savings Needed

Property Details for 14902 ELM Ave Irvine, CA 92606

——————————————————————————

Beds: 3

Baths: 3 baths

Home size: 2,600 sq ft

($296 / sq ft)

Lot Size: 5,000 sq ft

Year Built: 1972

Days on Market: 28

Listing Updated: 40374

MLS Number: S621843

Property Type: Single Family, Residential

Community: Walnut

Tract: Cp

——————————————————————————

College Park Remodeled Home. Wood flooring, Crown Moldings & Recessed lighting throughout. Granite Countertop. 3 Bedrooms plus spacious bonus room. Mater bedroom with Deck. New Air-conditioner & New Stainless Steel Appliances installed. New interior paint. New light fixtures.Walking distance to school & Association Pool.

Amid Weak Sales Volume Irvine Inventory Hits 23-Month High

Sales volumes are still 20% below historic norms, and inventory just hit a new 23-month high. Will prices hold up, or will they weaken and move lower?

Irvine Home Address … 59 DEL CAMBREA Irvine, CA 92606

Resale Home Price …… $610,000

I feel too close to be losin' touch

By givin' in, what am I givin' up

Am I losin' way too much

Hey

California waiting

Every little thing's gotta be just right

Kings of Leon — California Waiting

I wish I could be bullish on Irvine or Orange County real estate. I am bullish on the beaten down fringe markets like Riverside County or Las Vegas because prices are in line with incomes, and with low interest rates, the payment affordability is fantastic. When people go back to work in these areas, particularly in Las Vegas, prices will rebound. Orange County in general, and Irvine in particular, has not corrected enough for me to be bullish on pricing here. We are all still waiting.

In Friday's astute observations, I was asked about my predictions for the future. I replied:

With all the government manipulation and the cartel behavior of the lenders, it is really hard to tell when prices will reach a bottom. Much will depend on interest rates.

I suspect we will see a bottoming of payment affordability in 2011 with the combination of high inventory and low interest rates. As interest rates go back up, prices will continue to go down, but as inventory pressures abate, payment affordability may not be as good. I could easily see a scenario where the low interest rates make the median home affordable with a 25% DTI in 2011 and by 2013, the prices may actually be lower, but in order to purchase a median home, the median household income may require a 28% DTI.

Further, I think we will see affordability bottom at different times for different market strata. The low end will bottom first, and we are close to that now. The high end will bottom last as the gap between the low end and the high end recompresses to its historic relationship. The low end may bottom in 2011 while the high end may slowly deflate through 2014.

Sales Volume 20% below historic norms

A recent OC Register article noted that O.C. home sales hit 4-year high. That sounds great, but the very first item published in that article was the chart below showing sales are running 20% or more below historic norms of the last 22 years.

July 13th, 2010 — posted by Jon Lansner

The article does provide some context for its occasionally bullish statistics.

  • June buying is 21.7% below the average sales activity of June from 1988 through 2009. (See chart above comparing sales activity of the most recent 12 months compared to their respective 1988-2009 monthly averages.)
  • In the 12 months ended in June, Orange County home sales totaled 32,813 – that is 26% below the average sale activity of 44,344 for a year from 1988 through 2009
  • … sales in 2010’s second quarter sales were 24% percent below the 1988-2009 average.

Those numbers are pathetic. Lenders are afraid to process too many foreclosures or complete too many short sales with those grim absorption numbers. There simply isn't enough buyer interest to absorb the distressed inventory, so lenders are preventing it from hitting the market.

Uncle Sam likely had a hand in this sales bump. House shoppers who entered escrow by April 30 were told they had to close the deal by June 30 to possibly collect up to an $8,000 federal tax credit. Just after the June 30 deadline — which spurred a deal-closing flurry — that deadline was extended by Congress to Sept. 30. (DETAILS HERE!)

“This is good news, even if part of it is due to stimulus programs such as tax credits and very low interest rates,” says Kerry Vandell, director of real estate studies at the Merage School of Business at UCI. “Consider how we all would feel if, after all the stimulus activity, sales and prices continued to drop. The fact that a broad array of economic indicators — including Wall Street hiring — is pointing toward recovery is a very good sign. However, in the end, recovery will not be complete until job growth in the private sector turns solidly and significantly positive. We are not there yet. However, I anticipate solid job recovery by year end.”

Do you get the feeling Dr. Vandell was reaching for something positive to say? Consider how we would all feel if… people in the industry told the truth! Why am I the only voice bothering to point out that not everything is perfect in the housing market? Sometimes I think these people forget that not everyone expects or wants house prices to rise at double-digit rates.

The tax credit program in combination with low interest rates and withheld inventory has provided a brief respite on the way to the bottom. Perhaps the tax credit made for a higher bottom by giving some false hope to those contemplating accelerated default. Perhaps it was a massive waste of taxpayer dollars subsidizing those who were going to buy anyway. It was likely a little of both.

And post tax break, there’s talk that the market is cooling …

  • Steve Thomas of Altera Real Estate calculates a “market time” benchmark tracking how many months it theoretically takes to sell all the inventory in the local MLS for-sale listings at the current pace of pending deals being made. By this Thomas logic, as of last Thursday, it would take 3.78 months for buyers to gobble up all homes for sale at the current pace. This is slower pace than the 3.37 months of inventory found two weeks earlier or 2.66 months of a year earlier. (See more of “‘Unrealistic’ sellers flood O.C. home market” by CLICKING HERE!)

Even Steve Thomas's unreliable, made-up numbers based on escrows rather than closed sales is showing undeniable weakness.

  • Holly Schwartz of Torelli Realty in Costa Mesa concurs, saying her firm sees a drop in activity as tax-break deadlines passed. “The first half of 2010 was strong; the tax credit incentive helped,” she said.

An honest view of what is happening in the market. I hope her broker doesn't get too angry with her for failing to shovel manure at the OC Register. Not to worry, the two interviewed from Seven Gables scooped the poop:

  • But Carolynn Santaniello of Seven Gables Real Estate hasn’t seen that much buyer drop-off: “I have seen a slowdown in the under $450,000 range since the tax credit expired. In the mid and upper range, I have not see as much as a drop in buyer demand. The first half of 2010 has been very busy and I don’t see an end in sight for me, personally. Serious buyers are still buying.”
  • Amanda Wernick of the Sandy DeAngelis Team at Seven Gables adds: “Post tax credit has not shown any loss of activity. We’re constantly speaking to possible new buyers, though sellers are re-evaluating their sales strategy.”

What does it mean to re-evaluate a sales strategy. Is that realtor talk for backing off their WTF asking prices?

Beach town home sales swoon

July 18th, 2010 — posted by Jon Lansner

While the affordable slice of the housing market enjoyed a sales boost from an expiring federal tax credit, Orange County’s beach communities had falling sales activity as the June 30 tax-break deadline arrived. (Then it was extended to Sept. 30.)

In June, DataQuick shows 553 homes sold in 17 Orange County beach cities ZIP codes — off 3% from May and just up 5% from a year ago. In May, beach homebuying was running 40% above a year ago. And, perhaps most stunning: News that owner of “Portabello” has cut the seaside, blufftop mansion’s asking price by $25 million!

Now in beach towns where the median selling price if $685,000 — up only 1.4% vs. a year ago — a tax break of up to $8,000 is no market mover. Still, in today’s climate, anything should help. But as beach sales fell 3% from May to June as the rest of the market saw sales rise by 7%.

Very little is selling in the beach towns because prices are way too high. Anything requiring financing in excess of the jumbo conforming limit of $729,750 is selling at an extremely slow pace. First, the cost of financing is considerably higher (5.5% instead of 4.5% at Wells Fargo), and second, now that people have to be qualified for these loans with their real incomes rather than the fantasies they were allowed to put on loan applications in the past, there are very few qualified buyers. With the huge default rates on over $1,000,000 loans, expect to see a great deal more inventory in the beach communities.

Irvine's Inventory hits 23 month high

We have been watching the inventory in Irvine rise steadily throughout 2010. From a low of 440 homes on 1/2/2010 to the current 794, the inventory has now entered a more normal range. If sales rates were near historic norms, the current level of inventory would pose no problems for absorption, but with buyer demand weak, the current level of inventory should blunt further price increases, and if this trend continues through the end of the prime homebuying season, we will begin to see price weakness this fall and winter despite lower rates. For now, it is still a seller's market, but the balance of power is shifting, and a few months from now, buyers may not need to be so aggressive to obtain properties.

It is typical for inventory to peak in July or August as new sellers quit entering the fray. Lenders may also pull back on new listings for fear of what it will do to the market. This fall and winter will be the first test of the strength of the lending cartel. If all the members of the cartel stop adding inventory, pricing may hold up during the off season; however, if some members of the cartel choose to keep the liquidation going at full speed, inventory will continue to climb, and prices should soften.

IMO, lenders would be foolish not to take advantage of very low interest rates and still inflated prices to offload some inventory. Those banks that choose to break from the cartel will be rewarded with higher prices whereas those that try to hold on will be stuck with increased REO inventory and the likelihood of lower prices next year.

Two failed loan modifications and over three years of squatting

The owners of today's featured property set a new standard for HELOC abuse and gaming the system.

  • Today's featured property was purchased on 9/15/1998 for $299,000. My property records show this was purchased with a $90,000 first mortgage and a $209,000 down payment; although, it is possible that my data source is not correct and missed the first mortgage.
  • On 12/15/1998 they obtained a $40,000 HELOC.
  • On 12/28/1999 they opened a $60,000 HELOC.
  • On 7/2/2001 they refinanced with a $200,000 first mortgage.
  • On 5/29/2003 they refinanced the first mortgage for $270,000.
  • On 9/19/2004 they needed more money so they refinanced yet again for $400,000.
  • On 1/27/2005 they went back one more time and obtained a $448,000 first mortgage.
  • Total mortgage equity withdrawal is $358,000.
  • Total squatting time is at least 40 months, although the borrowers may have made a few payments during the period from July 2007 through December 2008.

Foreclosure Record

Recording Date: 05/20/2010

Document Type: Notice of Sale

Foreclosure Record

Recording Date: 02/19/2010

Document Type: Notice of Default

Foreclosure Record

Recording Date: 06/29/2009

Document Type: Notice of Rescission

Foreclosure Record

Recording Date: 12/10/2008

Document Type: Notice of Default

Foreclosure Record

Recording Date: 07/25/2007

Document Type: Notice of Rescission

Foreclosure Record

Recording Date: 06/13/2007

Document Type: Notice of Default

It is pretty obvious these borrowers cannot afford their home. Since they still had equity, the bank was willing to go above and beyond the call of duty to modify their loan over and over again. These borrowers crossed the invisible event horizon of the Ponzi limit during the refinance of 2004 or 2005. With the amend-pretend-extend dance on its third encore, these owners are facing the prospect of finally selling their home.

I imagine they are quite attached to the property. After providing several hundred thousand dollars of spending money and over three years with no housing costs, it will be quite an adjustment for them to rent a property that actually costs them money rather than gives it to them.

Irvine Home Address … 59 DEL CAMBREA Irvine, CA 92606

Resale Home Price … $610,000

Home Purchase Price … $299,000

Home Purchase Date …. 9/15/1998

Net Gain (Loss) ………. $274,400

Percent Change ………. 91.8%

Annual Appreciation … 6.1%

Cost of Ownership

————————————————-

$610,000 ………. Asking Price

$122,000 ………. 20% Down Conventional

4.59% …………… Mortgage Interest Rate

$488,000 ………. 30-Year Mortgage

$120,477 ………. Income Requirement

$2,499 ………. Monthly Mortgage Payment

$529 ………. Property Tax

$0 ………. Special Taxes and Levies (Mello Roos)

$51 ………. Homeowners Insurance

$156 ………. Homeowners Association Fees

============================================

$3,234 ………. Monthly Cash Outlays

-$419 ………. Tax Savings (% of Interest and Property Tax)

-$632 ………. Equity Hidden in Payment

$209 ………. Lost Income to Down Payment (net of taxes)

$76 ………. Maintenance and Replacement Reserves

============================================

$2,469 ………. Monthly Cost of Ownership

Cash Acquisition Demands

——————————————————————————

$6,100 ………. Furnishing and Move In @1%

$6,100 ………. Closing Costs @1%

$4,880 ………… Interest Points @1% of Loan

$122,000 ………. Down Payment

============================================

$139,080 ………. Total Cash Costs

$37,800 ………… Emergency Cash Reserves

============================================

$176,880 ………. Total Savings Needed

Property Details for 59 DEL CAMBREA Irvine, CA 92606

——————————————————————————

Beds: 3

Baths: 2 full 1 part baths

Home size: 1,350 sq ft

($452 / sq ft)

Lot Size: 2,352 sq ft

Year Built: 1994

Days on Market: 17

Listing Updated: 40371

MLS Number: S623648

Property Type: Single Family, Residential

Community: Westpark

Tract: Posi

——————————————————————————

Positano Plan A in a quiet inside tract location. Upgraded flooring,custom interior painting and low maintenance backyard. Main floor bedroom with full bath, direct access garage and high vaulted ceiling.Walk to Plaza Vista school, pools, parks and tennis courts. Must see.

Trustee Sale Hedge Fund

Pooled-investment funds have been on my mind lately, so when I saw the cartoon below, I thought it was particularly funny.

If anyone is interested in a bonk in the head and five minutes of memory loss, contact me at sales@idealhomebrokers.com.