I use rental parity analysis to find neighborhoods where cashflow properties abound in Las Vegas. Owner occupants can also take advantage of this analysis to narrow their search to the cities and zip codes with the best bargains.
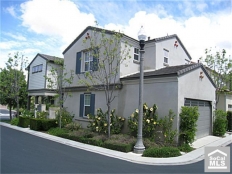
Irvine Home Address … 214 TUBEROSE Irvine, CA 92603
Resale Home Price …… $704,900
![]()
The power of equality
Is not yet what it ought to be (ought to be)
It fills me up like a hollow tree (hollow tree)
The power of equality
Right or wrong
My song is strong
Red Hot Chili Peppers — The Power of Equality
Equality has power. Rental parity is a powerful price point because the cost of ownership is equal to the cost of rental. Theoretically, buyers should be indifferent at rental parity, but in the real world kool aid intoxication prompts many buyers to bid prices up above rental parity. The true power of this threshold doesn't become apparent until prices fall and owners find themselves paying far more than comparable rentals for properties worth less than they paid.
Today's post will be heavy on math, but I want to give everyone a look inside the black box of aggregate rental parity calculations. I use this analysis in Las Vegas to locate neighborhoods with the best rental property deals, but owner occupants can also take advantage of this analysis to narrow their search for properties to those cities or zip codes with the best bargains. In our deflating housing market, rental parity analysis is a useful tool for identifying which areas have deflated and which ones have not. I will be presenting the data for Irvine and select Orange County cities in my September 12 presentation at JT Schmids.

Rental Parity defined
Rental parity is the price point where the cost of ownership is equal to the cost of rental. Rental parity is an important price level because buyers who pay more than rental parity risk being trapped in a negative cashflow situation if they should need or want to move before the resale value has appreciated enough to cover their transaction costs on the sale. When people pay more than rental parity, they don't have a viable plan B to get out of their property.
Because rental parity is such an important threshold, evaluating the costs of ownership relative to rentals is an excellent way to measure value. If a property is trading above rental parity, the price is inflated above reasonable valuation. Perhaps in a few of the most desirable communities where move-up buyers bring equity from previous sales, properties can trade consistently above rental parity. However, for the vast majority of the housing stock, valuations at or below rental parity are the norm and define fundamental value.
If a property is reselling below rental parity, it can be rented for a profit. If it selling well below rental parity, it may be a good cashflow investment. The only way to be certain is to perform a property-specific analysis taking account of recent comps for both resales and rentals and inputting specific property information for HOAs, Mello Roos, and other costs.
I developed the analysis I will cover today to identify areas in Las Vegas where cashflow properties are common. Rather than try to analyze all 40,000 properties on the MLS, I developed this technique to narrow my search to specific areas of town or specific zip codes. It also enables me to give a rough idea of cap rates and cash-on-cash returns in any area based on aggregate numbers.
Using Rental Parity Analysis to find bargains
I performed a detailed analysis of the Las Vegas housing market (PDF of analysis here). I use it to identify which zip codes and which areas of town provide the greatest returns to cashflow investors. However, this is a useful tool to anyone looking for a home, not just investors. Nobody wants to overpay, and its difficult to get a broad overview of prices and values across the whole of Orange County by browsing properties on Redfin.
A rental parity analysis will reveal if a specific property you are looking at is a good deal or just average for the area, it may prompt you to look in areas you previously never considered, or it may reinforce your desire to keep looking in your area of choice. It's one more tool you can use to be sure you have made the correct decision on buying a home.
Patrick.net has a great rental parity calculator you can use to analyse properties. Check it out.
Rental parity analysis and the returns on real estate
Rental parity analysis gives me a broad overview of the market, but the point of the analysis is to direct me toward individual properties which yield results equal to or better than the rest of the neighborhood. Once I have identified the property, I put the information into an IHB Fundamental Value Report to calculate the cost of ownership and returns from the property as an investment.
The return on real estate is measured in three ways: capitalization rate, cash-on-cash return, and internal rate of return. Each of those is described in detail below.
Calculating capitalization rates
The basic calculation I perform is the capitalization rate, the net operating income divided by price. The capitalization rate is the return an all-cash investor would obtain from the property. It is always wise to examine the unleveraged returns of any investment as extreme leverage can exaggerate the returns of nearly any investment and disguise the underlying risk.
To obtain the capitalization rate for an entire zip code, I obtain four values from the MLS:
- Average rents over last 30 days
- Average square feet of rentals
- Median sales price
- Average square feet of resales
The square footage is necessary to normalize the numbers. Although not perfect, normalization by square footage is far superior than simply taking the raw rental number and dividing it by the median home price.
From these four pieces of data, I calculate the capitalization rate as demonstrated below.
.png)
Below is an example from the 89031 Zip Code in Las Vegas:
| Cap Rate | Avg Rent | Avg Rent SF |
Avg Rent
Per SF |
Avg Sale Price | Avg Sale SF |
Avg Sale
Per SF |
| 8.0% | $1,148 | 1,751 | $0.66 | $116,335 | 1,817 | $64.04 |
So how does that compare with the reality of individual properties in that zip code?

The capitalization rate analysis correctly predicted where I could find properties with desirable characteristics.
Cash-on-Cash return calculations
The cash-on-cash return is more important than capitalization rates for the average investor who uses debt to acquire real estate. The cash-on-cash return compares the down payment to the cashflow remaining after interest is paid (includes positive cashflow plus amortization).
The calculation for cash-on-cash uses the capitalization rate calculated above and magnifies it — both up or down — based on the financing terms. The lower the down payment, the greater the returns are magnified. This is why speculators were keen to use 100% financing when it was made readily available during the bubble. Returns were infinite, and the risk of loss was passed on to the lender.
The debt ratio is the magnifying factor of leverage. The down payment is divided into 1 to obtain the multiplying factor.
The fulcrum point of leverage is the interest rate. The interest rate must be lower than the capitalization rate for debt to have a positive effect. This was one of the key mistakes investors made during the bubble. People were buying properties with 4% capitalization rates using 6.5% debt. That's crazy. No sane investor would apply debt that is more expensive than the capitalization rate — insane speculators do this all the time, but the moment prices go down, and the property cannot be sold for a profit, the negative cashflow of inappropriately leveraged real estate eats people up.

The above property with a 7.7% capitalization rate yields 17.3% to an investor using leverage.

Internal Rate of Return
Current cashflows are not the only ways investors profit from real estate. The housing bubble was characterized by an overly exuberant opinion of future appreciation, and I have consistently decried considering appreciation as a reason to buy real estate in direct response to the foolishness of bubble-buyer attitudes. However, real estate can and does appreciate, and resale at a higher price in the future does have value. The best way to calculate this value is through a discounted cashflow analysis. When examining the rate of return of real estate, the internal rate of return is the best method available.
I won't attempt to walk anyone through the math of the internal rate of return calculation. Like everyone else in finance, I use a spreadsheet to calculate it for me. The concept of internal rate of return is not nearly as difficult to understand as the math used to calculate it. 
Imagine you are buying a house for $123,000 you believe will be worth $215,000 10 years from now. What is the current value of the $93,000 profit you will obtain in 10 years? It depends on the interest rate. That calculation is what finance people call net present value.
Now Imagine you could put $123,000 in a bank account earning a high interest rate (I know you can't today, but just imagine). What interest rate would be required to have your $123,000 grow into $215,000 at the end of 10 years? That interest rate would be like the internal rate of return on the property that increased in value by the same amount over the same period.
Internal rate of return considers more than just the lump sum at the end. Internal rate of return compares the amount and timing of all the cash inflows and compares it to the initial investment amount to compute an overall rate of return on the investment. Internal rate of return is the most accurate measure of the financial performance of real estate.
A Las Vegas investment property
The property below is an property offered by the investment fund I manage. The second presentation on September 12 will focus on how investors can get involved with cashflow properties in Las Vegas. One of these methods is direct ownership and management of rental properties such as the one below.

Most properties in Las Vegas are trading below rental parity, even in the nicest neighborhoods in Summerlin. If you invest in areas outside of the ones most desired by owner occupants, the prices fall off quickly, but the rents do not. This creates opportunity to pick up properties with outstanding current cashflow and potential for rebound appreciation to rental parity many years from now.
The first page of the report shows the asking price and the rate of return as an unleveraged investment. This is followed with a detailed look at the returns on a financed purchase. Many properties in Las Vegas generate such good cashflow they can cover the payment on a 15-year mortgage.

The second page of the report gives greater detail on the cost of ownership. It provides a list of comparable resales and rentals to verify current value.

The third page examines the current valuation relative to rental parity, and it considers the possibility of rebound appreciation over 10 years taking prices back to rental parity (nowhere near the peak, but to where prices should be). Assumptions on appreciation impact the internal rate of return, but not the current cashflow. If you don't believe Las Vegas housing prices will ever recover, it will not impact the cash returns you receive while owning the property.
The final chart is a graphical representation of the thousands of scenarios you can run to test different financing terms. If you develop your own spreadsheet and go through the exercise, you will find lower interest rates increase returns, and lower down payments increase returns — assuming the interest rate is lower than the cap rate.

Nicer and newer properties typically don't provide the best cashflow. The property above is an 1814 SF 4/2 built in 2003. Owner occupants have kept these prices up to where cap rates are near 8%. An 8% cap rate is unheard of in Orange County, except perhaps for undesirable properties in Santa Ana, but 8% cap rates are quite common in Las Vegas.
If you are willing to own a smaller, older property in a less desirable but not bad neighborhood, the returns in Las Vegas are truly outstanding.

If you are interested in learning more about rental parity analysis and investing in cashflow properties, I suggest you come to the presentations on September 12. I will be available before and after the presentations to answer any questions you might have.
It didn't go up enough to Ponzi the payments
The former owners of today's featured property paid $534,000 on 9/26/2003. They used a $421,900 first mortgage, a $79,000 second mortgage, and a $33,100 down payment. They withdrew their down payment about 5 months later when they refinanced with a $555,000 first mortgage. They also got $21,000 in HELOC booty to go with their down payment. The refinanced again on 4/29/2004 for $563,000 and obtained another $8,000. They were foreclosed on 7/22/2011 with a balance due of $652,500.
Apparently the bank hasn't gotten the memo about prices being back at 2003 levels. Like a delusional seller of the post-bubble era, they have priced this property to get everything they are owed on the deal after commissions. Good luck with that.
——————————————————————————————————————————————-
This property is available for sale via the MLS.
Please contact Shevy Akason, #01836707
949.769.1599
sales@idealhomebrokers.com
Irvine House Address … 214 TUBEROSE Irvine, CA 92603
Resale House Price …… $704,900
Beds: 4
Baths: 3
Sq. Ft.: 2100
$336/SF
Property Type: Residential, Condominium
Style: Two Level, Contemporary
Year Built: 2003
Community: Quail Hill
County: Orange
MLS#: S671457
Source: SoCalMLS
Status: Active
On Redfin: 1 day
——————————————————————————
Excellent corner location in Solstice – Quail Hill. Two story home with one bed/bath downstairs. Numberous highlights including custom neutral paint and carpet. Granite countertops in kitchen, walk in pantry, light, bright and open floor plan. .. Upstairs has large loft and balcony as well as upstairs laundry room. One of top school districts in the state.
——————————————————————————————————————————————-
Proprietary IHB commentary and analysis ![]()
Numberous?
Resale Home Price …… $704,900
House Purchase Price … $534,000
House Purchase Date …. 9/26/2003
Net Gain (Loss) ………. $128,606
Percent Change ………. 24.1%
Annual Appreciation … 3.5%
Cost of Home Ownership
————————————————-
$704,900 ………. Asking Price
$140,980 ………. 20% Down Conventional
4.19% …………… Mortgage Interest Rate
$563,920 ………. 30-Year Mortgage
$152,599 ………. Income Requirement
$2,754 ………. Monthly Mortgage Payment
$611 ………. Property Tax (@1.04%)
$200 ………. Special Taxes and Levies (Mello Roos)
$147 ………. Homeowners Insurance (@ 0.25%)
$0 ………. Private Mortgage Insurance
$230 ………. Homeowners Association Fees
============================================
$3,942 ………. Monthly Cash Outlays
-$645 ………. Tax Savings (% of Interest and Property Tax)
-$785 ………. Equity Hidden in Payment (Amortization)
$211 ………. Lost Income to Down Payment (net of taxes)
$108 ………. Maintenance and Replacement Reserves
============================================
$2,831 ………. Monthly Cost of Ownership
Cash Acquisition Demands
——————————————————————————
$7,049 ………. Furnishing and Move In @1%
$7,049 ………. Closing Costs @1%
$5,639 ………… Interest Points @1% of Loan
$140,980 ………. Down Payment
============================================
$160,717 ………. Total Cash Costs
$43,300 ………… Emergency Cash Reserves
============================================
$204,017 ………. Total Savings Needed
——————————————————————————————————————————————————-
Nice math post today… my eyes are still crossed.
I would like to see a rundown like this on an Irvine property.
Today’s featured listing’s price is poorly researched, a model match sold for 630k, they are going have a hard time getting $700k. I think the bank has their details wrong, the pictures show it as a Soltice Plan 2, not Plan 3 so the actual square footage is 1840, not 2100 (that’s Plan 3 w/ the extra upstairs room option).
I’m still scratching my eyes looking at the picture of the featured house. Did TIC really think it was a good idea to cram a couple more houses into this development instead of having a GD sidewalk in front of the house. This is a sign of the times. I love the older neighborhoods with sidewalks and a nice parkway between the sidewalk and street. I guess they weren’t running out of land or developers weren’t quite as greedy 40 years ago.
The presentations are at PM not AM right?
Also how did you go about getting the comparable rents, is there a website that will find that information for you?
Yes, the presentations are PM. I obtain comparable rents directly from the MLS. I don’t know of a good website to get this history. You can infer a lot from asking prices on the MLS and Craigslist.
Good analysis and write up, it’s too bad that these scenarios are difficult to find in Irivne. Vegas is exteremely devalued. Decent SFR’s for under 100k brings in investors.
How about doing a write up on say, Youngtown, Oh or Indianapolis, In? Those cities have even more attractive valuations.
I pointed this out a few times. Rental parity doesnt take into account upgrades or large lots very well. Basically its great for the average house in the development but if one of the houses on an identical tract has a corner lot or is very large, the rental difference doesnt equate with the purchase price difference usually. That is because what a renter prefers is different than an owner.
also, it is a freakin pain the move with a family. Simple as that. No dollar amount plug in is going to show what a pain that is. These are where people live. This isn’t some financial instrument that is easy to value.
Moving around apts for “move in specials” year to year gets old really fast.
Try renting a SFR home under a 7 year lease agreement. Let’s see what kind of annual rental increases they will price in. Even at 3%, rents will be 22% higher by the end of the lease.
Also, in NV, there is no personal income tax. So rental parity will always be be lower than CA because the net after tax cost of owning a house is higher in NV while the after tax returns are higher for investors. Just a different type of market. Homes there should always in theory be closer to the “financial modeling” rental parity because of this skewing.
Having moved twice in the past year (with a family), and having had a stretch of moving 9/10 summers when single, I agree that moving is a pain. However, it is a pain that can be dulled considerably with professional movers.
Maybe you haven’t paid attention to the past 10 years, but a good chunk of our country regarded their home as an investment. Many more used it as collateral in cash-out refinancings to fuel consumption or debt consolidation. That behavior is hardly the actions of someone who views a home as merely “where they live”.
I would imagine that some landlords would welcome long-term renters. And the cost of those 3%/yr increases would be weighed against any extra you might pay to own. You shouldn’t forget about the 6%/sale and other transaction costs with owning that might arise unexpectedly if a move is required. Costs have to factor into decision making.
The weaknesses you point out are true for any aggregate analysis. The special circumstance properties are always undervalued in Zillow or epraisal or other automated valuation models because those models can’t pick up the unique character of the property.
“That is because what a renter prefers is different than an owner.”
That is only true to a point. Renters like nice properties like owners do, but renters are often not willing to pay what owners are willing to pay to obtain the niceties. Owners over-improve their properties all the time and add little value. Renters may discount these improvements more than other owners, but it isn’t discounted to zero.
Renters will pay more rent for corner lots with greater privacy or granite counter tops and other amenities.
IR,
Great analysis. You had real interest rates for investor instead of the phoney owner occupied teaser rates used by other sellers. The hard attributes to predict are future rent, repair expense and having enough reserves to survive a long vacancy or bad tenant. I have not seen such properties in OC or coastal CA. Some in inland CA with 17% unemployment that may turn into a money pit (sellers used a standard 5% vacancy rate :} that has no touch of reality). How are the true vacancy rates in LV?
I’m tired of looking in CA and may expand outward to LV.
The vacancy rates in Las Vegas are bad. However, when you think about vacancy, the problems tend to be concentrated at the bottom of the housing ladder. A property that rents for $1,200 per month can always find a renter by lowering the rent. A property that rents for $700 per month may not be able to find a warm body with a job no matter how much the rent is lowered. The key to investing in Las Vegas is to stay away from anything renting for less than $850 per month. I prefer SFDs to condos for this reason.
Around this condo, there are two ~1500sqft 3/2.5’s, one for sale @ $599k and one for rent @ $2700/mo. Maybe different models, but seem to be pretty comparable. $599k seems pretty close to rental parity.
In Turtle Rock $2500 to $2800 seems like a sweet point for renting a 3 bedroom condo with additional study room (2000 sf to 2700 sf). The size varies alot. For $1700 to $2200 seems to be a sweet spot for a 2 bedroom (900 sf to 2100 sf). Single family houses seems to rent for more, and apt building for less. Seems like the apt building in NPB are better value without factoring in the schools.
asking price: 122900
resale value in year 10: 215.127
annual appreciation rate: 5.75%
It seems too high to me.
I believe prices will decline for another year or two in Las Vegas, and appreciation will be slow for another year or two after that; however, once the supply problems abate, I believe the market will see a significant rebound appreciation up to rental parity levels.
Right now, the only reason more investors are not buying these properties is because they fear values will drop. Once it is widely believed the bottom is in, the 10%+ cap rates will be very attractive. Further, in 3 to 5 years, many people who walked away from their mortgages will be able to buy again. Between the investors who aren’t worried about continued declines, and the owner occupants who are re-entering the buyer pool, I believe prices will go up steeply for several years. Also, once the market has had a year or two of double-digit appreciation, then the kool aid buyers will be participating in full force.
I want to have all the properties I want before the crazies come bid the prices back up again.
“I want to have all the properties I want before the crazies come bid the prices back up again”
re: “bid”
take ur time ; it’s gonna’ be a while
IR:
My stomach always gets queasy when people start talking about “rental parity” and “California real estate” in the same sentence.
Substitute “tulip bulb” for “California real estate” and you’ll have the same experience.
After house prices in California decline to the American average of around $192,000, then it makes sense to talk about rental parity.
Until then, you’re just comparing tulip bulbs at bubble prices, which is nonsense.
Interesting post, IR..
Is there a particular source that you use for your rental parity analysis data?