In Los Angeles and Orange Counties, the conforming loan limit dropped from $729,750 to $625,000 on October 1, 2011. Many market bulls claimed this would have no effect on sales. In November sales of houses with loans between $625,000 and $729,750 declined 84% as compared to last November. So much for having no impact.

Home Address … 25 WILD Trl Irvine, CA 92618
Asking Price ……. $622,990
In other news, the falling prices are beginning to motivate some buyers as evidenced by the small increase in sales volume. Falling prices and increasing sales are prerequisite to forming a durable market bottom.
SoCal home sales rise on declining prices

The number of homes sold in Southern California rose modestly last month from both October and a year earlier as investors and first-time buyers targeted homes priced below $400,000.
Prices, however, slipped in most areas, except in San Bernardino, Calif., where the median price rose 2.3% and nearby Riverside, where prices remained stable, according to San Diego real estate information firm DataQuick.
How do prices slip? It makes it all sound very minor, doesn't it. Prices have been dropping ever since the tax credit expired at rates similar to the worst of the crash in 2008.
A total of 16,884 new and resale houses and condos sold in Los Angeles, Riverside, San Diego, Ventura, San Bernardino and Orange counties in November, up 0.3% from October and up 4.2% from November 2010.
More often than not, sales have dropped between October and November and have fallen, on average, 8.4% between those two months since 1988, when DataQuick's statistics begin. Still, last month’s sales were 22.7% lower than the November average of 21,832 transactions since the record-keeping began.
A small uptick is a start, but obviously, the market has a long way to go. The lack of a move-up market is paralyzing sales and forcing above-median home sellers to lower their prices to make a deal. Expect this trend to continue for at least a few more years. 
November existing-home/condo sales rose 5.8% from a year earlier, while new home sales fell 15.2% to the lowest level on record for a November.
So much for a recovery in homebuilding.
“Tis still the season to go bargain hunting — or at least that’s what the November home sales data suggest. The portion of homes sold to investors continued to hover near an all-time high,” said John Walsh, DataQuick president.
Distressed property sales accounted for 51.3% of the Southland resale market last month, down from 52.3% in October and down from 53.4% a year earlier.
Short sales, where the sale price fell short of what was owed on the property, made up just shy of 20% of Southland resales in November.
With distressed sales making up 50% of the market, don't expect appreciation any time soon.
Lower conforming loan limits that took effect Oct. 1 continued to impact the housing market. Lawmakers recently restored the higher limits, which vary by county, for FHA loans but not for mortgages guaranteed by Fannie Mae and Freddie Mac.
In Los Angeles and Orange counties, where the conforming loan limit was lowered from $729,750 to $625,500, the number of homes sold with purchase loans in that range totaled 58 in November, down 44.2% from October and down 84.1% from a year earlier.
The chart below (click to expand) shows homes sales and median prices changes in the Southern California markets tracked by DataQuick.
Write toKerry Curry.
Follow her on Twitter @communicatorKLC.

Back in August when the lowering of the conforming limit was all but certain, Jaysen Gillespie a the Global Decision Analytics blog took a look at its impact: New lower conforming loan limit impact on Irvine, CA.
The above chart shows the distribution of home prices for all sales under $2M in Irvine, CA from 1/1/2010 through 7/31/2011. Irvine, CA is an expensive sub-market of an expensive region (Southern California). As a result, it is likely to feel any impact from lower conforming home limits more than most other places.
With that in mind, we’ve identified two potential price ranges that could be most impacted by the new limits. The green band represents homes that have selling prices where a 3.5% down payment represents a loan between the old limit ($729,000) and the new limit ($625,000). These properties represent 13.0% of all home sales in Irvine, CA. For the taxpayer’s sake, let’s hope that not many of the buyers in this price range are using only a 3.5% down payment. Those buyers are likely to be underwater soon as we predict continued downward drift in higher end home values in Southern California. These buyers represent one end of the spectrum.
On another point (but not the end, which would be “all cash” buyers) of the spectrum, we have buyers who put down 20%. At current Irvine, CA valuations, this is a substantial down-payment of around $170,000. For this level of royalty, we’ve used a purple band in the chart above. Using a 20% downpayment, 8.4% of sales in Irvine, CA would be impacted by the gap between the old and new conforming loan limits.
These are estimates — buyers in the green and purple bands have a few options. In order of long-term common sense for the buyer they are:
1. Pay less. Leverage seller fear that the loan limits really will reduce demand and correspondingly demand a lower price.
2. (tie) Put more down. Buy down the loan amount so that it becomes conforming.
2. (tie) Delay the purchase. The price-lowering impact from this change will be slight, but will occur over time. With an ongoing slow economy and prices above rental parity, there are no upward drivers for Irvine, CA home values.
3. Use “creative” financing. Pay the asking price but increase your monthly carrying cost for the term of the debt obligation.

As Jaysen noted, 20% of the Irvine market is impacted by the lowered limits, and that band just experienced an 84% decline in loan origination. No wonder prices are falling in the $700,000 to $900,000 price range.

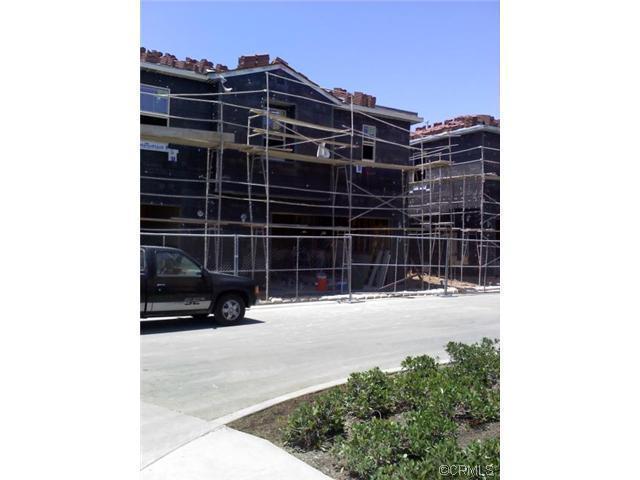
New construction for $257/SF
New home sales in November fell to the lowest level recorded by DataQuick since it began keeping records in 1988. To ignite sales, KB Homes is lowering its price. Will it work?
——————————————————————————————————————————————-
This property is available for sale via the MLS.
Please contact Shevy Akason, #01836707
949.769.1599
sales@idealhomebrokers.com
Home Address … 25 WILD Trl Irvine, CA 92618
Asking Price ……. $622,990
Beds: 4
Baths: 3
Sq. Ft.: 2423
$257/SF
Property Type: Residential, Condominium
Style: Two Level
Year Built: 2011
Community: Portola Springs
County: Orange
MLS#: I11091805
Source: CRMLS
Status: Active
On Redfin: 156 days
——————————————————————————
This is a brand new never been lived in home that is located in a beautiful master planned community. This beautiful 4 bedroom, 3 bathroom has many upgrades which include granite countertops and stainless steel appliances. This home is energy star qualified and comes with a 10 year limited warranty! This is a must see.
——————————————————————————————————————————————-
Proprietary commentary and analysis ![]()
Asking Price ……. $622,990
Cost of Home Ownership
————————————————-
$622,990 ………. Asking Price
$124,598 ………. 20% Down Conventional
4.02% …………… Mortgage Interest Rate
$498,392 ………. 30-Year Mortgage
$149,582 ………. Income Requirement
$2,385 ………. Monthly Mortgage Payment
$540 ………. Property Tax (@1.04%)
$415 ………. Special Taxes and Levies (Mello Roos)
$130 ………. Homeowners Insurance (@ 0.25%)
$0 ………. Private Mortgage Insurance
$394 ………. Homeowners Association Fees
============================
$3,864 ………. Monthly Cash Outlays
-$552 ………. Tax Savings (% of Interest and Property Tax)
-$716 ………. Equity Hidden in Payment (Amortization)
$174 ………. Lost Income to Down Payment (net of taxes)
$98 ………. Maintenance and Replacement Reserves
============================================
$2,869 ………. Monthly Cost of Ownership
Cash Acquisition Demands
——————————————————————————
$6,230 ………. Furnishing and Move In @1%
$6,230 ………. Closing Costs @1%
$4,984 ………. Interest Points
$124,598 ………. Down Payment
============================================
$142,042 ………. Total Cash Costs
$43,900 ………… Emergency Cash Reserves
============================================
$185,942 ………. Total Savings Needed
——————————————————————————————————————————————————-
“In Los Angeles and Orange counties, where the conforming loan limit was lowered from $729,750 to $625,500, the number of homes sold with purchase loans in that range totaled 58 in November, down 44.2% from October and down 84.1% from a year”
Great example of how % numbers can distort headlines and create alarm/panic. 1. There were only 58 transactions. 2. How many were cash buyers (investors who would not be affected by owner-occupied loan limits anyway?) Please engage brain before putting mouth in gear.
“1. There were only 58 transactions. 2. How many were cash buyers (investors who would not be affected by owner-occupied loan limits anyway?) ”
Zero
58 was the number of transactions which took out loans in the range between $625k and $730k. Cash buyers don’t take out loans
Casual Observer (aka Planet Reality):
Your comment above makes no sense.
There were 58 transactions this November, but at 84% less that implies 362 transactions the previous November.
These are statistically-speaking large enough numbers to be meaningful, contrary to your opinion.
It appears that the 58 are transactions and not loans. Just a low amount of transactions in that price range,
“It appears that the 58 are transactions and not loans.”
Where does that appear to be the case?
The article is fairly clear in stating that there were 58 transactions with loan values in between $625k and $730k, and that that number is 84% less than the number of transactions with loans in that range last year.
This information alone isn’t all that interesting, what would be interesting to know is what effect this had on the selling of homes priced in the $647k-$911k range. It’s possible there was no change in prices or number of homes sold, and that buyers just found ways around taking out loans in that range through creative financing or putting more money down.
Most likely there indeed was some real effect on prices and sales but I don’t see that specific data in this article. The DataQuick figures for LA and OC (which includes all sales in all price ranges) shows a 4.6% increase in number of sales and a 5.2% to 8.0% decrease in median prices. Is there anyway to see data for that $647k-$911k range specifically?
“Is there anyway to see data for that $647k-$911k range specifically?”
Here are sales numbers from MLS for LA and Orange County SFR and Condos that Closed with a Sold Price between $647k-$911k.
November 2011 – 545
October 2011 – 578
September 2011 – 740
November 2010 – 668
October 2010 – 674
September 2010 – 762
The [url=http://www.zillow.com/blog/2011-09-28/conforming-mortgage-limit-set-to-drop-oct-1/]limit changed on Oct 1[/url] so I think those numbers make sense.
Need to know how many homes were available. Year over year numbers within a month’s period of time are misleading as to the true nature of the marketplace. Obviously, all conditions of the marketplace have an effect on sales volume, sale amounts, finance in general, economics, etc.