According to Altos Research, Irvine’s single-family housing market is nearly the same as it was the previous month. Altos gives Irvine’s single-family homes a Market Action Index of 22.58, which Altos defines as a buyer’s market. (Above 30 is defined as a seller’s market; below is defined as a buyer’s market.) Altos also states that the average single-family home has been on the market for about 112 days as of October 12, 2012.
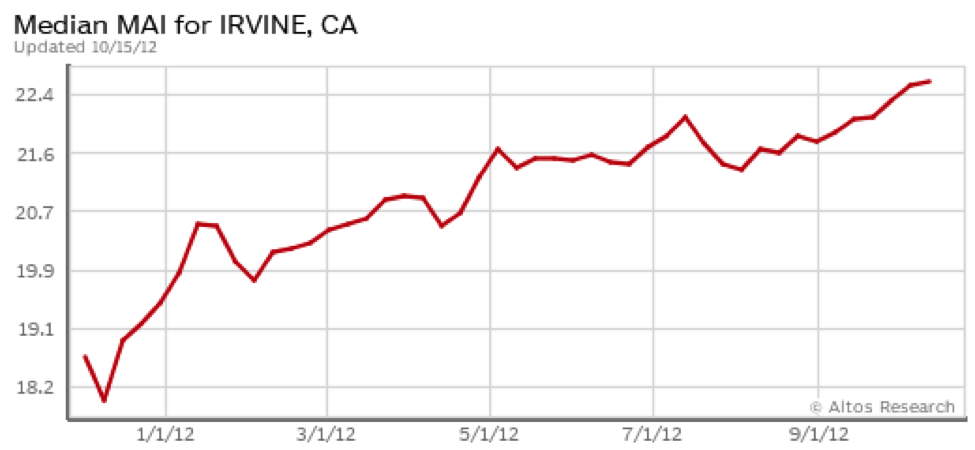
Altos Market Action Index for Single-family Homes in Irvine
Following is data from Redfin, on Irvine’s September 2012 housing market:
| Type | List Price/# Homes Listed | Sold Price/# Homes Sold | List Per SF | Sold Per SF | % Chg Y-O-Y Sold Price/SF |
| Houses | |||||
| 12-Sep | $958K/205 | $690K/91 | $375 | $346 | 0.90% |
| 12-Aug | $960K/221 | $710K/125 | $380 | $345 | -0.30% |
| 12-Jul | $949K/226 | $760K/95 | $382 | $368 | 7.90% |
| 12-Jun | $890K/251 | $735K/103 | $384 | $356 | 5% |
| Condos | |||||
| 12-Sep | $542K/174 | $430K/118 | $352 | $307 | 1.70% |
| 12-Aug | $525K/168 | $427K/141 | $338 | $306 | 0% |
| 12-Jul | $509K/181 | $425K/115 | $342 | $306 | -1.60% |
| 12-Jun | $498K/202 | $430K/152 | $336 | $313 | -1.30% |
| All | |||||
| 12-Sep | $750K/381 | $530K/210 | $365 | $323 | 1.90% |
| 12-Aug | $736K/390 | $536K/267 | $362 | $328 | 3.50% |
| 12-Jul | $744K/408 | $545K/211 | $363 | $322 | 0.30% |
| 12-Jun | $720K/456 | $515K/257 | $363 | $327 | 0.90% |
Note:
· The September 2012 overall median selling price was up 6% from the previous year.
· The August 2012 overall median selling price was down 0.6% from the previous year.
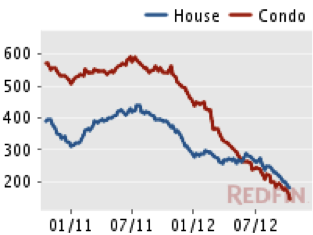
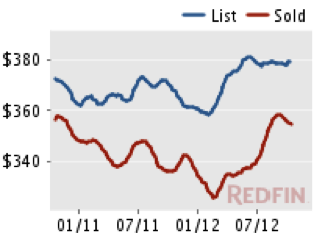
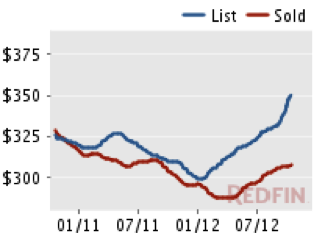
The following charts show Irvine’s inventory, median price per square foot of houses, and median price per square foot of condos, respectively.
If you would like to see some housing numbers for each of Irvine’s neighborhoods, see my previous post “Irvine Housing by the Numbers – October 2012 Update.”